 Open Access Article
Lophiostomin A–D: new 3,4-dihydroisocoumarin derivatives from the endophytic fungus Lophiostoma sp. Sigrf10†
Ziling Maoa,
Mengyao Xuea,
Gan Gua,
Weixuan Wanga,
Dianpeng Lib,
Daowan Lai*a and
Ligang Zhou *a
*a
aDepartment of Plant Pathology, College of Plant Protection, China Agricultural University, Beijing 100193, China. E-mail: dwlai@cau.edu.cn; lgzhou@cau.edu.cn
bGuangxi Key Laboratory of Functional Phytochemicals Research and Utilization, Guangxi Institute of Botany, Guilin 541006, China
First published on 14th February 2020
Abstract
Four new 3,4-dihydroisocoumarin congeners, named lophiostomin A–D (1–4), together with two known α-pyridones (5 and 6) were isolated from cultures of the endophytic fungus Lophiostoma sp. Sigrf10 obtained from Siraitia grosvenorii. The structures of the new compounds were determined via combined analysis involving 1D and 2D NMR, high-resolution electrospray ionization mass spectrometry (HRESIMS), and electronic circular dichroism (ECD) spectra, as well as quantum chemical ECD computations for assigning the absolute configurations. All the compounds were evaluated for their antibacterial and antifungal activities. Compounds 1 and 2 displayed moderate inhibitory activities against the spore germination of Magnaporthe oryzae, whereas 5 and 6 were active against the following tested pathogenic bacteria: Bacillus subtilis, Agrobacterium tumefaciens, Ralstonia solanacearum, and Xanthomonas vesicatoria.
Introduction
The living plants colonized by endophytic fungi show no symptoms, and are considered to play important roles in the ecological fitness of their host.1 From such interactions, compounds derived from endophytes might have antimicrobial activities.2,3 These microorganisms are also abundant resources for exploring other novel metabolites with interesting bioactivities such as cytotoxic, antitumor, and anti-inflammatory activities.4,5As part of the continuing interest in searching for bioactive substances from endophytic fungi,6–8 the endophytic fungi from medicinal plants were screened for their antimicrobial-producing potential. As a result, the extract of Lophiostoma sp. Sigrf10, which was derived from Siraitia grosvenorii, was found to display interesting antibacterial activity in a preliminary assay. This strain was then subjected to large scale fermentation, and the resulting culture was subjected to phytochemical investigation, which led to the isolation and identification of four 3,4-dihydroisocoumarins and two α-pyridones. 3,4-Dihydroisocoumarins have been previously reported from terrestrial or marine-derived fungi, and exhibited interesting bioactivities, such as anti-inflammatory,9 antibacterial,10 or phytotoxic activities.11
Although members of the genus Lophiostoma have been reported as endophytes,12 or saprophytes from terrestrial, fresh water or marine enviorments,13 chemical investigations that have been documented were mostly on the marine-derived species. These included sterol, cerebroside, phenalenone derivatives, sesterterpenoid, merosesquiterpenoids, ten-membered macrolides, and pyrrolidine derivatives, displaying antibacterial, antifungal, antimalarial, and cytotoxic activities.14–16 In the present study, the isolation, structure elucidation, and antimicrobial activities of the metabolites from a terrestrial Lophiostoma strain are reported for the first time.
Results and discussion
Structure elucidation
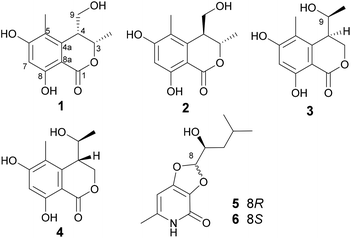
The fungal EtOAc extract was successively subjected to repeated column chromatography over silica gel, Sephadex LH-20, ODS column chromatography as well as reversed-phase HPLC to afford compounds 1–6 (Fig. 1).Lophiostomin A (1) was isolated as a pale yellow oil. It exhibited a prominent pseudomolecular peak at m/z 237.0766 [M − H]− in the HRESIMS spectrum (Fig. S4, ESI†), suggesting a molecular formula of C12H14O5 with six degrees of unsaturation. The UV spectrum displayed maximum absorptions at 232, 265 and 310 nm which was similar to that of tetrahydroascochin,17 indicating it was a 3,4-dihydroisocoumarin derivative. The 13C-NMR spectrum (Fig. S6, ESI†) showed a total of 12 resonances (Table 1) that could be assigned to one ester carbonyl (δC 170.1), six sp2-hybridized carbons including one CH, and five quaternary ones, two sp3-hybridized methines, including one oxygenated (δC 76.6) and one non-oxygenated (δC 40.9), one hydroxymethyl (δC 59.1) and two methyl groups (δC 18.0, 10.4). The six sp2-hybridized carbons constituted a pentasubstituted benzene ring, as only one sp2 CH group was observed, and the chemical shift of this CH group (δC 100.5, δH 6.25) implied that both of its ortho positions were oxygenated. The 1H-NMR spectrum (Fig. S5, ESI†) revealed the existence of one chelated OH (δH 11.18), one aromatic proton (δH 6.25, s), two methines (δH 4.69, 3.07), one hydroxymethyl group (δH 3.65, 3.49), and two methyl groups (δH 1.50, 2.00). Analysis of the coupling constants of these protons, indicated that the methyl group at δH 1.50 (3-Me, d, J = 6.6 Hz) was connected to the oxygenated methine at δH 4.69 (H-3, qd, J = 6.6, 2.7 Hz), which in turn coupled to the other methine at δH 3.07 (H-4, ddd, J = 6.4, 4.4, 2.7 Hz), and the latter methine was further linked to the hydroxymethyl group [H2-9, δH 3.65 (dd, J = 11.2, 6.4 Hz); 3.49 (dd, J = 11.2, 4.4 Hz)]. The previously mentioned functionalities, i.e., one benzene ring, one ester carbonyl, one CH3–CH–CH–CH2OH unit, accounted for five degrees of unsaturation, thus indicating that there was one additional ring in 1.
| Position | 1 (DMSO-d6) | 2 (DMSO-d6) | 3 (CD3OD) | 4 (CD3OD) | ||||
|---|---|---|---|---|---|---|---|---|
| δC, type | δH, mult. (J in Hz) | δC, type | δH, mult. (J in Hz) | δC, type | δH, mult. (J in Hz) | δC, type | δH, mult. (J in Hz) | |
| 1 | 170.1, C | 168.2, C | 171.8, C | 171.8, C | ||||
| 3 | 76.6, CH | 4.69, qd (6.6, 2.7) | 73.6, CH | 5.01, q (6.7) | 69.6, CH2 | 4.89, dd (11.2, 1.4); 4.35, dd (11.1, 2.8) | 68.9, CH2 | 4.85, overlapped; 4.45, dd (11.7, 3.9) |
| 4 | 40.9, CH | 3.07, ddd (6.4, 4.4, 2.7) | 42.7, CH | 2.98, dd (9.9, 4.7) | 43.1, CH | 2.99, ddd (8.2, 2.9, 1.4) | 42.7, CH | 3.15, t-like (4.6) |
| 4a | 142.0, C | 137.4, C | 142.0, C | 141.1, C | ||||
| 5 | 113.8, C | 115.5, C | 116.1, C | 116.4, C | ||||
| 6 | 163.8, C | 165.4, C | 164.7, C | 164.8, C | ||||
| 7 | 100.5, CH | 6.25, s | 100.8, CH | 6.21, s | 101.8, CH | 6.29, s | 102.0, CH | 6.30, s |
| 8 | 161.1, C | 161.5, C | 163.6, C | 163.7, C | ||||
| 8a | 99.3, C | 97.6, C | 101.5, C | 101.5, C | ||||
| 9 | 59.1, CH2 | 3.65, dd (11.2, 6.4); 3.49, dd (11.2, 4.4) | 61.3, CH2 | 3.41, dd (11.0, 4.8); 3.31, dd (11.0, 10.0) | 68.8, CH | 3.85, dq (8.2, 6.5) | 69.0, CH | 4.00, qd (6.5, 5.4) |
| 3-CH3 | 18.0, CH3 | 1.50, d (6.6) | 19.3, CH3 | 1.23, d (6.7) | ||||
| 5-CH3 | 10.4, CH3 | 2.00, s | 10.2, CH3 | 2.00, s | 12.0, CH3 | 2.10, s | 11.1, CH3 | 2.10, s |
| 9-CH3 | 21.4, CH3 | 1.13, d (6.5) | 19.5, CH3 | 1.14, d (6.5) | ||||
| 8-OH | 11.18, s | 11.25, s | ||||||
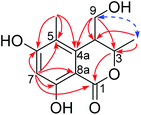
The planar structure of 1 was constructed by analysis of the HMBC spectrum (Fig. 2 and S7, ESI†). The correlations from the singlet methyl group (δH 2.00, 5-Me) to C-4a (δC 142.0), C-5 (δC 113.8), and C-6 (δC 163.8), and from the aromatic proton H-7 (δH 6.25, s) to C-5, C-6, C-8 (δC 161.1), and C-8a (δC 99.3), as well as the long-ranged correlation from H-7 to the ester carbonyl group (δC 170.1) allowed the establishment of a 1-carbonyl-3-methyl-4,6-dihydroxyl-2-substituted benzene ring, in which the chelated OH was placed at C-8. The correlations from H2-9 (δH 3.65, 3.49) to C-4a, and from H-3 (δH 4.69, qd) to C-1 (δC 170.1) revealed that C-4 was directly bonded to C-4a, whereas the oxymethine (C-3) was linked to the carbonyl through an ester bond. Hence, the planar structure of 1 was established as shown in Fig. 2.
With regards to the relative stereochemistry, the coupling constant (J = 2.7 Hz) between H-3 and H-4 was similar to that of tetrahydroascochin (2.5 Hz), a 3,4-cis-dimethyl dihydroisocoumarin that was prepared from (4S)-(+)-ascochin by catalytic hydrogenation,17 indicating the cis configuration for the 3-methyl and 4-hydroxymethyl group in 1. This was supported by the observed NOESY correlation between both groups (Fig. 2 and S8, ESI†).
The CD spectrum exhibited a negative cotton effect (CE) at 311.5 nm and a positive one at 269.5 nm, which was similar to that of tetrahydroascochin,17 implying the same orientation of the substituents on the α-pyrone, ring and hence, the 3S,4R configuration of 1. The absolute configuration of the 3,4-dihydroisocoumarin could also be deduced by applying the semi-empirical rule18 that correlates the P-helicity of the heterocyclic ring with the positive CE of the n → π* transition at 269.5 nm (Fig. 3, left panel). However, it was reported that the ester n → π* transition was not the only contributor to the CE at this region due to overlap with several π → π* transitions in the case of tetrahydroascochin,17 hence. The application of this rule to similar compounds should be done with care.
 | ||
| Fig. 3 The P-helicity of the hetero ring (left) and the DFT calculated, most stable conformer of 1 (right). | ||
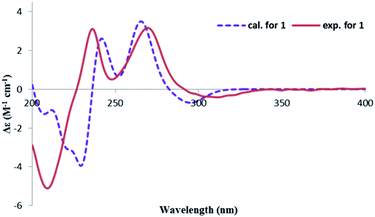
In order to confirm the previous absolute configuration assignments, TDDFT ECD computation of 1 was performed, which is a powerful method used for solving the stereochemistry puzzle of organic compounds nowadays.19–21 A MMFF conformational search of (3S,4R)-1, followed by optimization at the B3LYP/6-31G(d) level in the gas phase resulted in eight conformers with a population ≥1% (Fig. S1, ESI†). All these conformers adopted a half-chair conformation in which 3-methyl and 4-hydroxymethyl was equatorial and axial, respectively, and an intramolecular hydrogen bond was formed between 8-OH and 1-carbonyl, whereas they differed mainly on the orientation of the remaining hydroxyl groups (i.e., 9-OH and 6-OH). Among them, 6-OH was oriented towards H-7 in most of the conformers (6/8), accounting for a total of 91.1% of the population (Fig. S1, ESI†). The lowest energized conformer is shown in Fig. 3 (right panel). Then, the TDDFT ECD calculation of these conformers was performed at three different levels (PBE0/TZVP, CAM-B3LYP/TZVP, BH&HLYP/TZVP) with a PCM solvent model in methanol (Fig. S2, ESI†). Among them, the BH&HLYP/TZVP calculated ECD spectra gave the best fit to the experimental data (Fig. 4). Therefore, the absolute configuration of 1 was determined unambiguously.
Lophiostomin B (2) was isolated as a congener of 1, and both shared the same molecular formula as determined by HRESIMS (Fig. S9, ESI†). The UV and NMR data (Table 1, Fig. S10 and S11, ESI†) of 2 were similar to those of 1. Analysis of the 2D-NMR spectra (Fig. S12 and S13, ESI†) revealed that 2 shared the same planar structure as 1, and the major differences in their NMR data were found in the hetero ring. For instance, C-1 (Δδ = −1.9 ppm), C-8a (−1.7 ppm), C-4a (−4.6 ppm), and C-3 (−3.0 ppm) of 2 were upfield-shifted compared to those of 1, whereas C-4 (+1.8 ppm), C-9 (+2.2 ppm), and 3-Me (+1.3 ppm) were downfield-shifted. Thus, 2 was a stereoisomer of 1.
Because 2 was obviously not an enantiomeric partner of 1, the former had to be an epimer of 1 (i.e., 3,4-trans) as long as there were only two chiral centers in their structures. This was also reflected from a different coupling constant between H-3 and H-4 (∼0 Hz in 2 vs. 2.7 Hz in 1), and further corroborated by the results of the NOESY experiment. The NOESY correlation from 3-Me to H-4 supported a trans relationship between H-3 and H-4.
The absolute configuration of 2 was also determined by studying the CD spectra. According to the semi-empirical rule, a negative CE at 270 nm was correlated to the M-helicity of the hetero ring (Fig. 5), hence, a 3S,4S configuration was expected, if 4-hydroxymethyl was axially orientated to avoid the steric hinderance to the 5-methyl group. This was corroborated by the ECD calculations. As shown in Fig. 6, the CD spectrum of 2 was almost mirrored to that of 1, suggesting an opposite configuration at either C-4 or C-3, but not for both, as compounds 1 and 2 were not a pair of enantiomers. Although it would be expected that the change happened at C-4, as this should influence the co-planarity of the benzene ring more than that of C-3, a randomly selected (3R,4R) structure of 2 was subjected to the TDDFT ECD computations. The calculated ECD spectra of (3R,4R)-2 were similar to those of (3S,4R)-1, however, opposite to the experimental spectrum of 2 (Fig. 6), meaning that the configuration of C-3 had a negligible effect on the CD spectrum, hence, 2 was 3S,4S-configurated. Therefore, lophiostomin B (2) was elucidated as the 4-epimer of lophiostomin A (1).
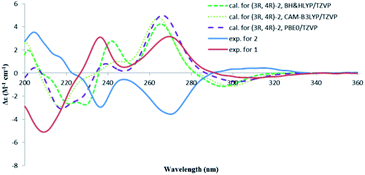 | ||
| Fig. 6 Calculated CD spectra for (3R,4R)-2 at three different levels and the experimental spectra for 1 and 2. | ||
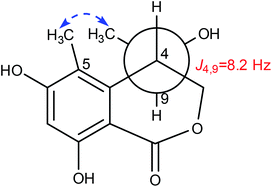
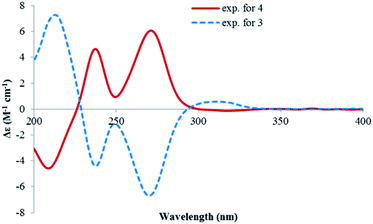
Lophiostomin C (3) was isolated as a colorless amorphous solid, which had the same molecular formula (Fig. S14, ESI†) as those of 1 and 2. Inspection of their NMR data (Table 1 and Fig. S15–S18, ESI†) revealed that they shared the same building blocks of one penta-substituted benzene ring, one ester carbonyl, two sp3 methine groups, one oxymethylene, and two methyl groups, however, the oxymethylene group in 3 was significantly downfield-shifted (δC 69.6; δH 4.89, 4.35, each dd), whereas the oxymethine group in 3 was upfield shifted (δC 68.8; δH 3.85, dq), compared to those of 1 and 2. This suggested that the ester bond was formed between the oxymethylene group and the carbonyl in 3, instead of the oxymethine group in 1 and 2. This was confirmed by the observed HMBC correlations from the oxymethylene group (δH 4.89, 4.35) to the carbonyl (C-1, δC 171.8). The relative stereochemistry was deduced by analysis of the 1H–1H coupling constants and the NOESY correlations. The large 3J value (8.2 Hz) between H-4 and H-9 indicated their anti-relationship as shown in the Newman projection in Fig. 7, whereas the observed NOESY correlation between the two methyl groups (5-Me and 9-Me) defined the relative stereochemistry of the two chiral centers in 3. The CD spectrum of 3 (Fig. 8) was similar to that of 2, meaning the same orientation of the substituent at C-4, thus, the absolute configuration was determined as 4R,9S in 3 as shown in Fig. 1.
Lophiostomin D (4) was isolated as an isomer of 3, both having similar UV, NMR data and the same molecular formula (Fig. S19, ESI†). Analysis of the 1D- and 2D-NMR data (Fig. S20–S22, ESI†) revealed that they shared the same gross structure. The notable differences in their NMR data were found in the hetero ring, i.e., C-3 (δC 68.9 in 4 vs. 69.6 in 3), H-4 (δH 3.15 vs. 2.99), C-4a (δC 141.1 vs. 142.0), H-9 (δH 4.00 vs. 3.85), and 9-methyl group (δC 19.5 vs. 21.4), suggesting a different stereochemistry for them. This was reflected by a smaller coupling constant (5.4 Hz) between H-4 and H-9. Interestingly, the CD spectrum of 4 was the mirror image of that of 3 (Fig. 8), suggesting an opposite stereochemistry at C-4. Because 4 and 3 were not a pair of enantiomers, 4 must have the 4S,9S absolute configuration. Thus, lophiostomin D (4) was determined to be the 4-epimer of lophiostomin C (3).
The known compounds were identified by comparing their physical and spectroscopic data with those reported in the literature, and included (8R,9S)-dihydroisoflavipucine (5) and (8S,9S)-dihydroisoflavipucine (6).22
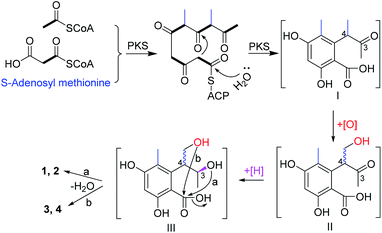
In this study, two pairs of 3,4-dihydroisocoumarin-types of epimers (1–4) were isolated. Although they had different substitution patterns, they were analogues of 6-hydroxymellein, which was biosynthesized through a non-reducing PKS pathway.23 Likewise, the biosynthetic pathway for compounds 1–4 were proposed (Scheme 1). Starting from one unit of acetyl CoA, the PKS could extend it with four units of malonyl CoA, and methylate it twice with S-adenosyl methionine, to give the ACP-tethered pentaketide, followed by hydrolysis to release the polyketide (I). Then, oxygenation of the 4-Me group gave the intermediate (II), which could be epimerized at C-4 before a further reduction of the 3-ketone to give the alcohol (III). The subsequent attack from either the 3-hydroxyl (route a) or the hydroxymethyl (route b) to the carboxyl group produced the lactones 1 and 2, and 3 and 4, respectively.
Antimicrobial activities
The isolated compounds were tested for their antibacterial activities. Among them, compounds 5 and 6 were active against four pathogenic bacteria, including Bacillus subtilis, Agrobacterium tumefaciens, Ralstonia solanacearum, and Xanthomonas vesicatoria, with IC50 values in the range of 35.68–44.85 μM (Table 2). Zhou et al.24 reported that 5 displayed strong activities against Staphylococcus aureus, Shewanella putrefaciens, and Vibrio natriegens.| Bacterium | MIC/IC50 (μM) | Compounda | ||
|---|---|---|---|---|
| 5 | 6 | Streptomycin sulfateb | ||
| a The other compounds were inactive (IC50 > 150 μM).b Positive control. | ||||
| B. subtilis | MIC | 150.0 | 100.0 | 12.5 |
| IC50 | 42.72 ± 2.37 | 35.91 ± 1.89 | 3.37 ± 0.51 | |
| A. tumefaciens | MIC | 150.0 | 150.0 | 25.0 |
| IC50 | 44.85 ± 2.86 | 40.44 ± 4.12 | 4.12 ± 0.67 | |
| R. solanacearum | MIC | 150.0 | 150.0 | 12.5 |
| IC50 | 41.53 ± 3.58 | 39.83 ± 4.55 | 2.50 ± 0.27 | |
| X. vesicatoria | MIC | 100.0 | 100.0 | 25.0 |
| IC50 | 35.68 ± 3.10 | 35.66 ± 3.70 | 5.02 ± 0.96 | |
The isolated compounds were also evaluated for their antifungal activities against the rice blast pathogen Magnaporthe oryzae. Among them, compounds 1 and 2 moderately inhibited the spore germination of M. oryzae with IC50 values of 81.67 and 86.61 μg mL−1, respectively, whereas the other tested compounds were inactive (IC50 > 200 μg mL−1) (Table 3).
Conclusions
In this study, two pairs of 3,4-dihydroisocoumarin epimers, lophiostomin A–D (1–4), and one pair of epimeric α-pyridones (5 and 6) were isolated from a culture of the endophytic fungus Lophiostoma sp. Sigrf10. The 4-epimeric pairs of the 3,4-dihydroisocoumarins (i.e., 1/2, and 3/4) were found to display opposite CD spectra to each other. The absolute configurations of these new compounds were determined by studying their CD behaviours, and by comparing the TDDFT-calculated ECD spectra with the experimental ones. A plausible biosynthetic pathway for these polyketides was proposed, which merits further investigation. Lophiostomin A (1) and B (2) exhibited antifungal activities against M. oryzae, and compounds 5 and 6 showed moderate antibacterial activities.Experimental section
General experimental procedures
The optical rotations were measured on a Rudolph Autopol IV automatic polarimeter (Rudolph Research Analytical, New Jersey, USA). The ultraviolet (UV) spectra were scanned by a TU-1810 UV-VIS spectrophotometer (Beijing Persee General Instrument Co., Ltd., Beijing, China). Circular dichroism (CD) spectra were recorded on a Jasco J-810 CD spectrometer (Jasco Corp., Tokyo, Japan). High resolution electrospray ionization mass spectrometry (HRESIMS) spectra were recorded on an LC1260-Q-TOF/MS 6520 instrument (Agilent Technologies, CA, USA). The 1H-, 13C-, and 2D-NMR spectra were measured on an Avance 400 NMR spectrometer (Bruker BioSpin, Zurich, Switzerland). Chemical shifts were expressed in δ (ppm) referenced to the solvent residual peaks at δH 2.50/δC 39.5 for DMSO-d6, or the internal standard TMS for CD3OD, respectively, and coupling constants (J) in hertz (Hz). Sephadex LH-20 (Pharmacia Biotech, Uppsala, Sweden), ODS-A silica gel (AA12S50, YMC Gel, Japan) and normal phase silica gel (200–300 mesh, Qingdao Marine Chemical Inc., Qingdao, China) were used for column chromatography. Semi-preparative HPLC separation was carried out on an LabAlliance instrument (Scientific Systems, Inc., State College, Pennsylvania, USA) equipped with a Series III pump (flow rate: 3 mL min−1) and a UV detector (Mode 201) using a Prevail C18 column (250 mm × 10 mm, 5 μm, Grace Corporation, Columbia, MD, USA). The HPLC-DAD analysis was performed using a Shimadzu LC-20A instrument with a SPD-M20A photodiode array detector (Shimadzu Corp., Tokyo, Japan) and an analytic C18 column (250 mm × 4.6 mm id, 5 μm, Phenomenex Inc., Torrance, CA, USA). The precoated silica gel GF-254 plates (Qingdao Marine Chemical, Inc.) were used for analytical TLC.Fungal material and fermentation
The fungus was isolated from the healthy tuberous root of S. grosvenorii, collected from the Guangxi Province of China in June 2015, and identified as Lophiostoma sp. Sigrf10 by analysis of its morphological characteristics and internal transcribed spacer (ITS) sequence (GenBank accession number: KT369820) of the rDNA gene. A voucher specimen was deposited in the Department of Plant Pathology, China Agricultural University.The fungus was grown on potato dextrose agar (PDA) plates at 25 °C for 8–10 d. Then, several plugs of agar medium (0.5 cm × 0.5 cm) containing fungal hyphae were transferred to several 250 mL Erlenmeyer flasks each containing 100 mL of potato dextrose broth (PDB) medium to prepare the seed culture, and incubated on a rotary shaker at 150 rpm, 25 °C for 7 d. The scale-up fermentation was carried out in 25 Erlenmeyer flasks (1 L), each containing 150 g of rice and 150 mL of distilled water. Each flask was inoculated using a seed culture. The fermentation was kept at 25 °C in a solid state for 45 d before harvesting.
Extraction and isolation
The cultures were combined, dried and ground. The dry materials were extracted with MeOH and exhaustive maceration (3 × 10 L) at room temperature. After filtration, the filtrate was concentrated under vacuum at 40 °C to afford a brown residue, which was suspended in water and partitioned sequentially with petroleum ether, EtOAc, and n-BuOH, to give the corresponding fractions. Then, the EtOAc fraction was concentrated under vacuum to give a brownish residue (28.0 g).The EtOAc extract was subjected to column chromatography (CC) over silica gel (200–300 mesh) with gradient elution of petroleum ether–acetone (100![[thin space (1/6-em)]](https://www.rsc.org/images/entities/char_2009.gif) :
:![[thin space (1/6-em)]](https://www.rsc.org/images/entities/char_2009.gif) 0–0
0–0![[thin space (1/6-em)]](https://www.rsc.org/images/entities/char_2009.gif) :
:![[thin space (1/6-em)]](https://www.rsc.org/images/entities/char_2009.gif) 100) to obtain four fractions (fractions A–D). Fraction B (8.0 g) was separated by ODS CC with a gradient elution of MeOH–H2O (30
100) to obtain four fractions (fractions A–D). Fraction B (8.0 g) was separated by ODS CC with a gradient elution of MeOH–H2O (30![[thin space (1/6-em)]](https://www.rsc.org/images/entities/char_2009.gif) :
:![[thin space (1/6-em)]](https://www.rsc.org/images/entities/char_2009.gif) 70–100
70–100![[thin space (1/6-em)]](https://www.rsc.org/images/entities/char_2009.gif) :
:![[thin space (1/6-em)]](https://www.rsc.org/images/entities/char_2009.gif) 0) to yield four subfractions (B1–B4). Subfraction B3 was subjected to CC over Sephadex LH-20 using CHCl3–MeOH (1
0) to yield four subfractions (B1–B4). Subfraction B3 was subjected to CC over Sephadex LH-20 using CHCl3–MeOH (1![[thin space (1/6-em)]](https://www.rsc.org/images/entities/char_2009.gif) :
:![[thin space (1/6-em)]](https://www.rsc.org/images/entities/char_2009.gif) 1) as the eluent, followed by semi-preparative HPLC (48% MeOH/H2O) to afford 5 (2.5 mg) and 6 (3.0 mg). Fraction C (5.0 g) was separated by ODS CC with a gradient elution of MeOH–H2O (25
1) as the eluent, followed by semi-preparative HPLC (48% MeOH/H2O) to afford 5 (2.5 mg) and 6 (3.0 mg). Fraction C (5.0 g) was separated by ODS CC with a gradient elution of MeOH–H2O (25![[thin space (1/6-em)]](https://www.rsc.org/images/entities/char_2009.gif) :
:![[thin space (1/6-em)]](https://www.rsc.org/images/entities/char_2009.gif) 75–100
75–100![[thin space (1/6-em)]](https://www.rsc.org/images/entities/char_2009.gif) :
:![[thin space (1/6-em)]](https://www.rsc.org/images/entities/char_2009.gif) 0) to yield five subfractions (C1–C5). Subfraction C1 was separated by semi-preparative HPLC using MeOH–H2O (40
0) to yield five subfractions (C1–C5). Subfraction C1 was separated by semi-preparative HPLC using MeOH–H2O (40![[thin space (1/6-em)]](https://www.rsc.org/images/entities/char_2009.gif) :
:![[thin space (1/6-em)]](https://www.rsc.org/images/entities/char_2009.gif) 60) as eluent to afford 2 (4.0 mg) and 1 (7.0 mg), respectively. Fraction D (5.5 g) was separated on Sephadex LH-20 using CHCl3–MeOH (1
60) as eluent to afford 2 (4.0 mg) and 1 (7.0 mg), respectively. Fraction D (5.5 g) was separated on Sephadex LH-20 using CHCl3–MeOH (1![[thin space (1/6-em)]](https://www.rsc.org/images/entities/char_2009.gif) :
:![[thin space (1/6-em)]](https://www.rsc.org/images/entities/char_2009.gif) 1) as the eluent, followed by semi-preparative HPLC (35% MeOH/H2O) to afford 3 (7.0 mg) and 4 (4.5 mg).
1) as the eluent, followed by semi-preparative HPLC (35% MeOH/H2O) to afford 3 (7.0 mg) and 4 (4.5 mg).
![[thin space (1/6-em)]](https://www.rsc.org/images/entities/char_2009.gif) ε) 232 (3.75), 265 (3.73), 310 (3.57) nm; CD (c = 1.05 × 10⁻³ M, MeOH) λ (Δε) 209 (−5.11), 236.0 (+3.10), 248 (+0.50), 269.5 (+3.16), 311.5 (−0.42) nm; 1H-NMR (DMSO-d6, 400 MHz), and 13C-NMR (DMSO-d6, 100 MHz) see Table 1; HRESIMS m/z 237.0766 [M − H]− (calcd for C12H13O5, 237.0768).
ε) 232 (3.75), 265 (3.73), 310 (3.57) nm; CD (c = 1.05 × 10⁻³ M, MeOH) λ (Δε) 209 (−5.11), 236.0 (+3.10), 248 (+0.50), 269.5 (+3.16), 311.5 (−0.42) nm; 1H-NMR (DMSO-d6, 400 MHz), and 13C-NMR (DMSO-d6, 100 MHz) see Table 1; HRESIMS m/z 237.0766 [M − H]− (calcd for C12H13O5, 237.0768).![[thin space (1/6-em)]](https://www.rsc.org/images/entities/char_2009.gif) ε) 232 (3.74), 267 (3.72), 310 (3.56) nm; CD (c = 1.05 × 10⁻³ M, MeOH) λ (Δε) 204.5 (+3.54), 236.5 (−2.95), 247.5 (−0.55), 270 (−3.56), 314 (+0.44) nm; 1H-NMR (DMSO-d6, 400 MHz), and 13C-NMR (DMSO-d6, 100 MHz) see Table 1; HRESIMS m/z 237.0766 [M − H]− (calcd for C12H13O5, 237.0768).
ε) 232 (3.74), 267 (3.72), 310 (3.56) nm; CD (c = 1.05 × 10⁻³ M, MeOH) λ (Δε) 204.5 (+3.54), 236.5 (−2.95), 247.5 (−0.55), 270 (−3.56), 314 (+0.44) nm; 1H-NMR (DMSO-d6, 400 MHz), and 13C-NMR (DMSO-d6, 100 MHz) see Table 1; HRESIMS m/z 237.0766 [M − H]− (calcd for C12H13O5, 237.0768).![[thin space (1/6-em)]](https://www.rsc.org/images/entities/char_2009.gif) ε) 215 (3.64), 271 (3.36), 311 (3.14) nm; CD (c = 1.05 × 10⁻³ M, MeOH) λ (Δε) 213 (+7.29), 237.5 (−4.40), 249 (−1.13), 270 (−6.69), 311 (+0.58) nm; 1H-NMR (CD3OD, 400 MHz), and 13C-NMR (CD3OD, 100 MHz) see Table 1; HRESIMS m/z 239.0911 [M + H]+ (calcd for C12H15O5, 239.0914).
ε) 215 (3.64), 271 (3.36), 311 (3.14) nm; CD (c = 1.05 × 10⁻³ M, MeOH) λ (Δε) 213 (+7.29), 237.5 (−4.40), 249 (−1.13), 270 (−6.69), 311 (+0.58) nm; 1H-NMR (CD3OD, 400 MHz), and 13C-NMR (CD3OD, 100 MHz) see Table 1; HRESIMS m/z 239.0911 [M + H]+ (calcd for C12H15O5, 239.0914).![[thin space (1/6-em)]](https://www.rsc.org/images/entities/char_2009.gif) ε) 217 (3.66), 271 (3.56), 311 (3.20) nm; CD (c = 0.84 × 10⁻³ M, MeOH) λ (Δε) 208.7 (−4.58), 237.3 (+4.65), 249.4 (+0.94), 271.1 (+6.07), 316.9 (−0.13) nm; 1H-NMR (CD3OD, 400 MHz), and 13C-NMR (CD3OD, 100 MHz) see Table 1; HRESIMS m/z 239.0915 [M + H]+ (calcd for C12H15O5, 239.0914).
ε) 217 (3.66), 271 (3.56), 311 (3.20) nm; CD (c = 0.84 × 10⁻³ M, MeOH) λ (Δε) 208.7 (−4.58), 237.3 (+4.65), 249.4 (+0.94), 271.1 (+6.07), 316.9 (−0.13) nm; 1H-NMR (CD3OD, 400 MHz), and 13C-NMR (CD3OD, 100 MHz) see Table 1; HRESIMS m/z 239.0915 [M + H]+ (calcd for C12H15O5, 239.0914).Antibacterial assay
The antibacterial activities of 1–6 were evaluated against four plant pathogenic bacteria, including Bacillus subtilis ATCC 11562, Agrobacterium tumefaciens ATCC 11158, Ralstonia solanacearum ATCC 11696, and Xanthomonas vesicatoria ATCC 11633. The minimum inhibitory concentrations (MIC) and median inhibitory concentrations (IC50) of the tested compounds were determined in sterile 96-well plates by the modified broth dilution colorimetric assay.25 Streptomycin sulfate was used as the positive control.Antifungal activity assay
The antifungal activities of compounds 1–6 were tested against the rice blast pathogen, Magnaporthe oryzae 131 using a spore germination assay.6 Briefly, the tested compounds were dissolved in 10% aqueous ethanol (25 μL) and mixed with 25 μL of fungal spore suspension (2 × 10⁶ spores per mL, prepared from 7 d old cultures) on a concave glass slide. Slides containing the spores were incubated in a dark, moist chamber at 25 °C for 8 h before examination of the germination status under a microscope. Carbendazim was used as the positive control, and 10% ethanol was used as the negative control. The percentage spore germination inhibition of each compound was then determined by comparing them with the negative control as described previously.6ECD calculations
The Molecular Merck Force Field (MMFF) conformational search was performed with MacroModel software (Schrödinger) with an implicit solvent model for CHCl3, and application of a 21 kJ mol−1 energy window, followed by geometry optimization and frequency calculations at the B3LYP/6-31G(d) level in vacuo. The TDDFT ECD calculations of the dominant conformers (≥1%) at three different levels (PBE0/TZVP, CAM-B3LYP/TZVP, and BH&HLYP/TZVP) were performed with the polarizable continuum model (PCM) for MeOH using the Gaussian 09 software package described previously.26 The ECD spectrum of each conformer was plotted with the program SpecDis27 using the dipole-length computed rotational strengths with Gaussian curve and exponential half-width (σ) of 0.2 eV. The equilibrium population of each conformer at 298.15 K was calculated from its relative Gibbs free energies using Boltzmann statistics. The Boltzmann-averaged ECD spectra for (3S,4R)-1, and (3R,4R)-2 were generated according to the equilibrium population of the lowest energized conformers of each structure. The calculated spectra were then compared with the experimental spectra to determine the absolute configuration. The calculated ECD spectra were scaled by 1/4 (y-axes) and UV-shifted for a better comparison with the experimental data.Conflicts of interest
There are no conflicts to declare.Acknowledgements
Financial support for this research was provided by the National Key R&D Program of China (2017YFD0201105) and the Fund of Guangxi Key Laboratory of Functional Phytochemicals Research and Utilization (FPRU2014-3).Notes and references
- R. Rodriguez, J. White Jr, A. Arnold and R. Redman, New Phytol., 2009, 182, 314–330 CrossRef CAS PubMed.
- N. Radic and B. Strukelj, Phytomedicine, 2012, 19, 1270–1284 CrossRef PubMed.
- S. Kumar and N. Kaushik, Phytochem. Rev., 2012, 11, 507–522 CrossRef CAS.
- L. Chen, Q.-Y. Zhang, M. Jia, Q.-L. Ming, W. Yue, K. Rahman, L.-P. Qin and T. Han, Crit. Rev. Microbiol., 2016, 42, 454–473 CAS.
- J. Zhao, T. Shan, Y. Mou and L. Zhou, Mini-Rev. Med. Chem., 2011, 11, 159–168 CrossRef CAS PubMed.
- T. Shan, J. Tian, X. Wang, Y. Mou, Z. Mao, D. Lai, J. Dai, Y. Peng, L. Zhou and M. Wang, J. Nat. Prod., 2014, 77, 2151–2160 CrossRef CAS PubMed.
- D. Lai, Z. Mao, D. Xu, X. Zhang, A. Wang, R. Xie, L. Zhou and Y. Liu, RSC Adv., 2016, 6, 108989–109000 RSC.
- D. Lai, A. Wang, Y. Cao, K. Zhou, Z. Mao, X. Dong, J. Tian, D. Xu, J. Dai, Y. Peng, L. Zhou and Y. Liu, J. Nat. Prod., 2016, 79, 2022–2031 CrossRef CAS PubMed.
- D.-C. Kim, T. H. Quang, N. T. T. Ngan, C.-S. Yoon, J. H. Sohn, J. H. Yim, Y. Feng, Y. Che, Y.-C. Kim and H. Oh, J. Nat. Prod., 2015, 78, 2948–2955 CrossRef CAS PubMed.
- N. Abdissa and A. Abamecha, Nat. Prod. Chem. Res., 2018, 6, 1000301 Search PubMed.
- L. Huang, L. Ding, X. Li, N. Wang, W. Cui, X. Wang, C. B. Naman, J. E. H. Lazaro, X. Yan and S. He, Front. Microbiol., 2019, 10, 2846 CrossRef PubMed.
- J.-l. Cui, S.-x. Guo, H. Dong and P. Xiao, Phytother. Res., 2011, 25, 1189–1195 CrossRef CAS PubMed.
- A. Hashimoto, K. Hirayama, H. Takahashi, M. Matsumura, G. Okada, C. Y. Chen, J. W. Huang, M. Kakishima, T. Ono and K. Tanaka, Stud. Mycol., 2018, 90, 161–189 CrossRef CAS PubMed.
- M. A. M. Shushni, F. Azam and U. Lindequist, Nat. Prod. Commun., 2013, 8, 1223–1226 CrossRef CAS PubMed.
- C. Intaraudom, S. Nitthithanasilp, P. Rachtawee, T. Boonruangprapa, S. Prabpai, P. Kongsaeree and P. Pittayakhajonwut, Phytochemistry, 2015, 120, 19–27 CrossRef CAS PubMed.
- C.-J. Zheng, C.-L. Shao, M. Chen, Z.-G. Niu, D.-L. Zhao and C.-Y. Wang, Chem. Biodiversity, 2015, 12, 1407–1414 CrossRef CAS PubMed.
- K. Krohn, I. Kock, B. Elsaesser, U. Floerke, B. Schulz, S. Draeger, G. Pescitelli, S. Antus and T. Kurtan, Eur. J. Org. Chem., 2007, 1123–1129 CrossRef CAS.
- S. Antus, G. Snatzke and I. Steinke, Liebigs Ann. Chem., 1983, 1983, 2247–2261 CrossRef.
- N. Berova, L. D. Bari and G. Pescitelli, Chem. Soc. Rev., 2007, 36, 914–931 RSC.
- X.-C. Li, D. Ferreira and Y. Ding, Curr. Org. Chem., 2010, 14, 1678–1697 CrossRef CAS PubMed.
- A. E. Nugroho and H. Morita, J. Nat. Med., 2014, 68, 1–10 CrossRef CAS PubMed.
- T. Chen, C.-K. Lam, W.-D. Chen, X.-H. Chen, G.-K. Feng, X.-F. Zhu, W.-J. Lan and H.-J. Li, Arabian J. Chem., 2017, 10, 288–294 CrossRef CAS.
- C. Zaehle, M. Gressler, E. Shelest, E. Geib, C. Hertweck and M. Brock, Chem. Biol., 2014, 21, 719–731 CrossRef CAS PubMed.
- Y. Zhou, A. Debbab, V. Wray, W. Lin, B. Schulz, R. Trepos, C. Pile, C. Hellio, P. Proksch and A. H. Aly, Tetrahedron Lett., 2014, 55, 2789–2792 CrossRef CAS.
- S. Lu, W. Sun, J. Meng, A. Wang, X. Wang, J. Tian, X. Fu, J. Dai, Y. Liu, D. Lai and L. Zhou, J. Agric. Food Chem., 2015, 63, 3501–3508 CrossRef CAS PubMed.
- J. Meng, G. Gu, P. Dang, X. Zhang, W. Wang, J. Dai, Y. Liu, D. Lai and L. Zhou, Front. Chem., 2019, 7, 435 CrossRef CAS PubMed.
- T. Bruhn, A. Schaumloeffel, Y. Hemberger and G. Bringmann, Chirality, 2013, 25, 243–249 CrossRef CAS PubMed.
Footnote |
| † Electronic supplementary information (ESI) available: ECD calculation data for 1 and 2; and HRESIMS, 1D and 2D NMR spectra of 1–4. See DOI: 10.1039/d0ra00538j |
| This journal is © The Royal Society of Chemistry 2020 |

