 Open Access Article
Core-dependent properties of copper nanoclusters: valence-pure nanoclusters as NIR TADF emitters and mixed-valence ones as semiconductors†
Leon Li-Min
Zhang‡
a,
Guodong
Zhou‡
 b,
Guoqing
Zhou
c,
Hung-Kay
Lee
a,
Ni
Zhao
 b,
Oleg V.
Prezhdo
 c and
Thomas C. W.
Mak
 *a
*a
aDepartment of Chemistry and Center of Novel Functional Molecules, The Chinese University of Hong Kong, Hong Kong SAR, People's Republic of China. E-mail: tcwmak@cuhk.edu.hk
bDepartment of Electronic Engineering, The Chinese University of Hong Kong, Hong Kong SAR, People's Republic of China
cDepartment of Chemistry, University of Southern California, Los Angeles, California 90089-1062, USA
First published on 7th September 2019
Abstract
We report herein that copper alkynyl nanoclusters show metal-core dependent properties via a charge-transfer mechanism, which enables new understanding of their structure–property relationship. Initially, nanoclusters 1 and 2 bearing respective Cu(I)15 (C1) and Cu(I)28 (C2) cores were prepared and revealed to display near-infrared (NIR) photoluminescence mainly from the mixed alkynyl → Cu(I) ligand-to-metal charge transfer (LMCT) and cluster-centered transition, and they further exhibit thermally activated delayed fluorescence (TADF). Subsequently, a vanadate-induced oxidative approach to in situ generate a nucleating Cu(II) cation led to assembly of 3 and 4 featuring respective [Cu(II)O6]@Cu(I)47 (C3) and {[Cu(II)O4]·[VO4]2}@Cu(I)46 (C4) cores. While interstitial occupancy of Cu(II) triggers inter-valence charge-transfer (IVCT) from Cu(I) to Cu(II) to quench the photoluminescence of 3 and 4, such a process facilitates charge mobility to render them semiconductive. Overall, metal-core modification results in an interplay between charge-transfer processes to switch TADF to semiconductivity, which underpins an unusual structure–property correlation for designed synthesis of metal nanoclusters with unique properties and functions.
Introduction
Amid rapid expansion of research endeavor into nanoscale materials, atomically precise metal nanoclusters have attracted considerable interest.1 They not only motivate continuous efforts in the chemical community to achieve ever-evolving compositional and structural complexity, but also serve as an inspiration to materials scientists due to their use in a variety of emerging technological applications.2 In particular, their precise structural nature facilitates deeper understanding of the structure–property relationship, which has direct ramifications for design of functional nanomaterials.3,4In this regard, the copper alkynyl nanoclusters constitute a good research platform owing to their versatile self-assembled nanostructures and appealing physio-chemical properties in photoluminescence, catalysis, biomedical sensing and electronics.5 However, such a goal is currently far from reach. For example, while it is presumed that copper alkynyl nanoclusters would exhibit exotic photoluminescence performances, relevant investigations are very preliminary, and key studies are still mechanistic in nature.5 Nevertheless, some impressive progress has been made in the recent literature. Scott and Hayton reported [Cu20(PhC![[triple bond, length as m-dash]](https://www.rsc.org/images/entities/char_e002.gif) C)12(OAc)6] as an effective catalyst for [3 + 2] cycloadditions between alkynes and azides.6 Zheng reported that [Cu53(CF3COO)10(tBuC
C)12(OAc)6] as an effective catalyst for [3 + 2] cycloadditions between alkynes and azides.6 Zheng reported that [Cu53(CF3COO)10(tBuC![[triple bond, length as m-dash]](https://www.rsc.org/images/entities/char_e002.gif) C)20Cl2H18]+ was used as an effective precursor to generate γ-CuI films as perovskite solar cells.7 These results imply the potentiality of diversified yet underexplored attributes of copper alkynyl nanoclusters.
C)20Cl2H18]+ was used as an effective precursor to generate γ-CuI films as perovskite solar cells.7 These results imply the potentiality of diversified yet underexplored attributes of copper alkynyl nanoclusters.
We have previously established a comproportionation reaction methodology and focused on the structural role of anionic species to enhance the size and nuclearity of copper(I) alkynyl nanoclusters.8 In this work, we make inroads to comparative synthesis of valence-pure and mixed-valence copper nanoclusters that exhibit metal-core dependent material properties via a charge-transfer mechanism, which enables new understanding of their structure–property relationship.
Initially, the comproportionation reaction furnished nanoclusters [Cu(I)15(tBuC![[triple bond, length as m-dash]](https://www.rsc.org/images/entities/char_e002.gif) C)14NO3] (1) and [Cu(I)28(tBuC
C)14NO3] (1) and [Cu(I)28(tBuC![[triple bond, length as m-dash]](https://www.rsc.org/images/entities/char_e002.gif) C)22(SO4)2(OMe)2] (2). They were revealed to exhibit NIR photoluminescence mainly from the mixed alkynyl → Cu(I) LMCT and cluster-centered transition and further exhibit TADF. To the best of our knowledge, 1 and 2 constitute the first examples of coinage-metal nanoclusters displaying NIR TADF. Subsequently, a vanadate-assisted approach to in situ generate a nucleating Cu(II) cation was developed in conjugation with the comproportionation reaction to assemble {[Cu(II)O6]@Cu(I)47(iPrC
C)22(SO4)2(OMe)2] (2). They were revealed to exhibit NIR photoluminescence mainly from the mixed alkynyl → Cu(I) LMCT and cluster-centered transition and further exhibit TADF. To the best of our knowledge, 1 and 2 constitute the first examples of coinage-metal nanoclusters displaying NIR TADF. Subsequently, a vanadate-assisted approach to in situ generate a nucleating Cu(II) cation was developed in conjugation with the comproportionation reaction to assemble {[Cu(II)O6]@Cu(I)47(iPrC![[triple bond, length as m-dash]](https://www.rsc.org/images/entities/char_e002.gif) C)33}(ClO4)4 (3) and {[Cu(II)O4][VO4]2@Cu(I)46(tBuC
C)33}(ClO4)4 (3) and {[Cu(II)O4][VO4]2@Cu(I)46(tBuC![[triple bond, length as m-dash]](https://www.rsc.org/images/entities/char_e002.gif) C)27(tBuPO3)2(H2O)}(BF4)3(CH2Cl2)2(Et2O)2(H2O) (4). While interstitial incorporation of Cu(II) triggers IVCT from Cu(I) to Cu(II) to quench the photoluminescence of 3 and 4, such a process facilitates charge mobility to render them semiconductive. Overall, metal-core modification originating from the interplay of the charge-transfer process causes a switch from TADF to semiconductivity. Such pros and cons effect of Cu(II) cations on cluster properties not only advances our knowledge on the structure–property relationship of atomically precise metal nanoclutructursters, but also provides a potential route to tailor future development of function-specific nanoclusters.
C)27(tBuPO3)2(H2O)}(BF4)3(CH2Cl2)2(Et2O)2(H2O) (4). While interstitial incorporation of Cu(II) triggers IVCT from Cu(I) to Cu(II) to quench the photoluminescence of 3 and 4, such a process facilitates charge mobility to render them semiconductive. Overall, metal-core modification originating from the interplay of the charge-transfer process causes a switch from TADF to semiconductivity. Such pros and cons effect of Cu(II) cations on cluster properties not only advances our knowledge on the structure–property relationship of atomically precise metal nanoclutructursters, but also provides a potential route to tailor future development of function-specific nanoclusters.
Results and discussion
Synthesis and characterization
While the structures of nanoclusters dictate their physio-chemical behavior,9 a systematic synthetic study based on a proven methodology is not just a routine exercise, but it aims to obtain novel nanoclusters with desirable properties. Herein, screening the Cu(II) source of the comproportionation reaction Cu(0)/Cu(II)/tBuC![[triple bond, length as m-dash]](https://www.rsc.org/images/entities/char_e002.gif) CH furnished two valence-pure Cu(I) nanoclusters (Scheme 1, upper part). Use of Cu(II) (NO3)2 at room temperature yielded red crystals of [Cu(I)15(tBuC
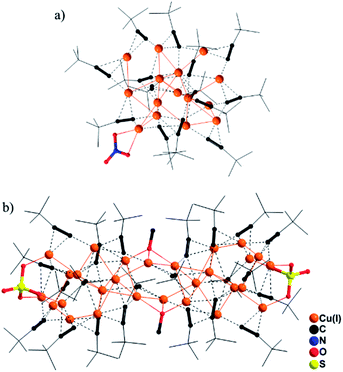
CH furnished two valence-pure Cu(I) nanoclusters (Scheme 1, upper part). Use of Cu(II) (NO3)2 at room temperature yielded red crystals of [Cu(I)15(tBuC![[triple bond, length as m-dash]](https://www.rsc.org/images/entities/char_e002.gif) C)14NO3] (1). During revision of this manuscript, synthesis of 1 was reported by Xie and Lu.10 Single-crystal X-ray diffraction analysis (SCXD) revealed that the Cu(I)15 (C1) core of 1 is stabilized by 14 alkynyl ligands and one μ-κO:κO′ NO3− with Cu(I)–O bond lengths of 2.169 and 2.379 Å (Fig. 1a). By using Cu(II)SO4 in the solvothermal reaction, [Cu(I)28(tBuC
C)14NO3] (1). During revision of this manuscript, synthesis of 1 was reported by Xie and Lu.10 Single-crystal X-ray diffraction analysis (SCXD) revealed that the Cu(I)15 (C1) core of 1 is stabilized by 14 alkynyl ligands and one μ-κO:κO′ NO3− with Cu(I)–O bond lengths of 2.169 and 2.379 Å (Fig. 1a). By using Cu(II)SO4 in the solvothermal reaction, [Cu(I)28(tBuC![[triple bond, length as m-dash]](https://www.rsc.org/images/entities/char_e002.gif) C)22(SO4)2(OMe)2] (2) was obtained as yellow crystals. Notably, 2 cannot be obtained without solvothermal treatment, presumably because its formation involving deprotonation of MeOH to the MeO− bridging ligand does not readily occur under ambient conditions. As shown in Fig. 1b, in addition to 22 alkynyl ligands, two μ3-MeO− and two μ3-κO:κO′:κO′′ SO42− ligands cap the respective central and terminal section of the Cu(I)28 (C2) core to assemble 2 as an elongated nanorod. In addition to its significant structural diversity, 2 also represents the highest-nuclearity Cu(I) alkynyl cluster assembled without an interstitial species.5d The Cu(I)–O bond distances span the range 1.925–2.140 Å.
C)22(SO4)2(OMe)2] (2) was obtained as yellow crystals. Notably, 2 cannot be obtained without solvothermal treatment, presumably because its formation involving deprotonation of MeOH to the MeO− bridging ligand does not readily occur under ambient conditions. As shown in Fig. 1b, in addition to 22 alkynyl ligands, two μ3-MeO− and two μ3-κO:κO′:κO′′ SO42− ligands cap the respective central and terminal section of the Cu(I)28 (C2) core to assemble 2 as an elongated nanorod. In addition to its significant structural diversity, 2 also represents the highest-nuclearity Cu(I) alkynyl cluster assembled without an interstitial species.5d The Cu(I)–O bond distances span the range 1.925–2.140 Å.
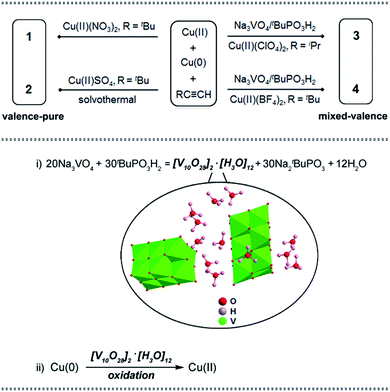 | ||
| Scheme 1 Upper: synthetic routes of copper nanoclusters 1–4. Lower: the vanadate-induced formation pathway of the nucleating Cu(II) cation in 3 and 4. | ||
Based on the comproportionation reaction to form Cu(I) nanoclusters, we have previously introduced polyoxomolybdate (POMo) to synthesize POMo@Cu(I) nanoclusters.8a Herein, an attempt to introduce polyoxovanadate (POV)11 by using Na3VO4/tBuPO3H2 yielded unprecedented Cu(II)-containing Cu(I) nanoclusters 3 and 4 (Scheme 1, upper part). Control experiments were conducted to probe the formation path for the Cu(II) cation. As illustrated in the lower part of Scheme 1, in step (i) Na3VO4/tBuPO3H2 reacted to form a decavanadate hydronium compound [V10O28]2·[H3O]12, which has not been reported prior to this work; in step (ii) [V10O28]2·[H3O]12 oxidized Cu(0) to in situ generate Cu(II) (see details in the ESI†). The Cu(II) generated via such a POV-assisted route consequently serves as a nucleating cation to form the mixed-valence nanoclusters 3 and 4.
In the synthesis of 3, a one-pot reaction of Na3VO4/tBuPO3H2 and Cu(0)/Cu(II)(ClO4)2/iPrC![[triple bond, length as m-dash]](https://www.rsc.org/images/entities/char_e002.gif) CH in methanol yielded a yellow precipitate that was re-dissolved in dichloromethane, to which slow diffusion of diethyl ether afforded deep red crystals of {[Cu(II)O6]@Cu(I)47(iPrC
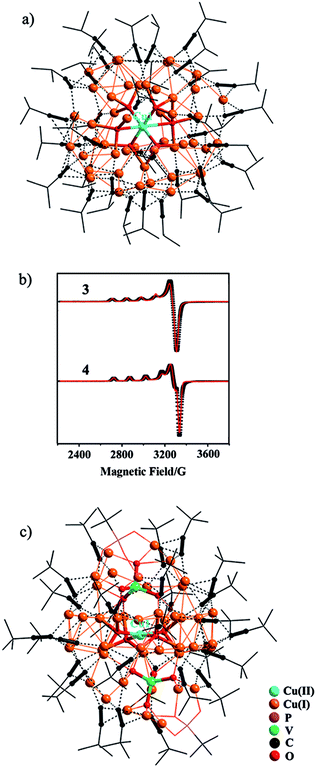
CH in methanol yielded a yellow precipitate that was re-dissolved in dichloromethane, to which slow diffusion of diethyl ether afforded deep red crystals of {[Cu(II)O6]@Cu(I)47(iPrC![[triple bond, length as m-dash]](https://www.rsc.org/images/entities/char_e002.gif) C)33}·(ClO4)4 (3). As shown in Fig. 2a, the central Cu(II) cation, Cu1, is stabilized within the Cu(I) shell by forming Cu(I)–O–Cu(II) bonding interactions (Fig. S12†). The octahedral coordination environment of Cu1 exhibits significant Jahn–Teller distortion (Fig. S12†), where atoms O1–O4 are equatorial donors with Cu(II)–O bond lengths of 1.940–1.957 Å, and O5 and O6 are axial donors with elongated distances of 2.325 and 2.635 Å, respectively. Bond-valence sum (BVS) calculation gives a calculated value of 2.18 for Cu1 (Table S2†).12 The +II oxidation state of Cu1 is further confirmed by the EPR spectrum (Fig. 2b), where it shows four-line splitting with g‖ (2.310) > g⊥ (2.053) > ge (2.0023), and A‖ = 135 G typical of Cu(II) axial signals in the dx2−y2 ground state,13 which is in accordance with the elongated octahedral coordination geometry of Cu1. This {[Cu(II)O6]@Cu(I)47} (C3) core is shielded by 33 peripheral iPrC
C)33}·(ClO4)4 (3). As shown in Fig. 2a, the central Cu(II) cation, Cu1, is stabilized within the Cu(I) shell by forming Cu(I)–O–Cu(II) bonding interactions (Fig. S12†). The octahedral coordination environment of Cu1 exhibits significant Jahn–Teller distortion (Fig. S12†), where atoms O1–O4 are equatorial donors with Cu(II)–O bond lengths of 1.940–1.957 Å, and O5 and O6 are axial donors with elongated distances of 2.325 and 2.635 Å, respectively. Bond-valence sum (BVS) calculation gives a calculated value of 2.18 for Cu1 (Table S2†).12 The +II oxidation state of Cu1 is further confirmed by the EPR spectrum (Fig. 2b), where it shows four-line splitting with g‖ (2.310) > g⊥ (2.053) > ge (2.0023), and A‖ = 135 G typical of Cu(II) axial signals in the dx2−y2 ground state,13 which is in accordance with the elongated octahedral coordination geometry of Cu1. This {[Cu(II)O6]@Cu(I)47} (C3) core is shielded by 33 peripheral iPrC![[triple bond, length as m-dash]](https://www.rsc.org/images/entities/char_e002.gif) C− ligands (Fig. 2a).
C− ligands (Fig. 2a).
In light of the alkynyl ligand effect on cluster assembly, iPrC![[triple bond, length as m-dash]](https://www.rsc.org/images/entities/char_e002.gif) CH was replaced by tBuC
CH was replaced by tBuC![[triple bond, length as m-dash]](https://www.rsc.org/images/entities/char_e002.gif) CH in the synthesis. Accordingly, the reaction of Na3VO4/tBuPO3H2 with Cu(0)/Cu(II)(BF4)2/tBuC
CH in the synthesis. Accordingly, the reaction of Na3VO4/tBuPO3H2 with Cu(0)/Cu(II)(BF4)2/tBuC![[triple bond, length as m-dash]](https://www.rsc.org/images/entities/char_e002.gif) CH yielded a disparate nanocluster {[Cu(II)O4]·[VO4]2@Cu(I)46(tBuC
CH yielded a disparate nanocluster {[Cu(II)O4]·[VO4]2@Cu(I)46(tBuC![[triple bond, length as m-dash]](https://www.rsc.org/images/entities/char_e002.gif) C)27(tBuPO3)2(H2O)}·(BF4)3·(CH2Cl2)2·(Et2O)2·(H2O) (4). As seen in Fig. 2c, Cu1 is also encased inside the cavity of the nanocluster that is sandwiched by two [VO4]3− anions. It exhibits a distorted square-planar coordination geometry with Cu(II)–O bond lengths of 1.913(6)–1.945(6) Å (Fig. S12†), and BVS analysis supports its +II oxidation state (calc. 2.04, Table S2†). In the EPR spectrum of 4 (Fig. 2b), the axial signals g‖ (2.280) > g⊥ (2.040) > ge (2.0023) and A‖ = 150 G are in agreement with the observed coordination environment of Cu1. Extensive Cu(I)–O–Cu(II) connectivity (Fig. S12†) consolidates the {[Cu(II)O4]·[VO4]2}@Cu(I)46 (C4) core, which is further protected by 27 tBuC
C)27(tBuPO3)2(H2O)}·(BF4)3·(CH2Cl2)2·(Et2O)2·(H2O) (4). As seen in Fig. 2c, Cu1 is also encased inside the cavity of the nanocluster that is sandwiched by two [VO4]3− anions. It exhibits a distorted square-planar coordination geometry with Cu(II)–O bond lengths of 1.913(6)–1.945(6) Å (Fig. S12†), and BVS analysis supports its +II oxidation state (calc. 2.04, Table S2†). In the EPR spectrum of 4 (Fig. 2b), the axial signals g‖ (2.280) > g⊥ (2.040) > ge (2.0023) and A‖ = 150 G are in agreement with the observed coordination environment of Cu1. Extensive Cu(I)–O–Cu(II) connectivity (Fig. S12†) consolidates the {[Cu(II)O4]·[VO4]2}@Cu(I)46 (C4) core, which is further protected by 27 tBuC![[triple bond, length as m-dash]](https://www.rsc.org/images/entities/char_e002.gif) C− and 2 μ4-κO:κO′:κO′:κO′′ tBuPO32− peripheral struts.
C− and 2 μ4-κO:κO′:κO′:κO′′ tBuPO32− peripheral struts.
Photophysical and optical properties
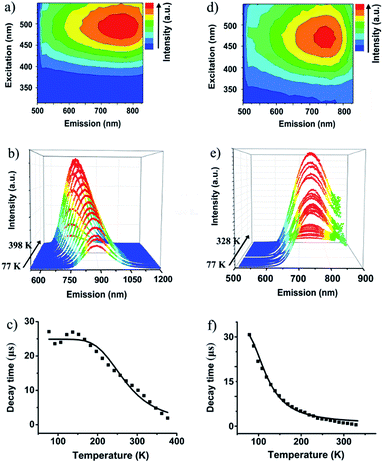
The valence-pure 1 and 2, and mixed-valence 3 and 4 offer a new basis to explore the structure–property relationship. In this vein, photoluminescence as one of the most important properties was first studied. As a result, while valence-pure nanoclusters show NIR TADF, mixed-valence ones do not emit, indicating that incorporation of Cu(II) has quenched the photoluminescence. Fig. 3a and d show the 3D excitation–emission correlation spectra recorded for crystalline samples of 1 and 2 at 298 K, which exhibit excitation windows with maximum wavelengths at 500 and 475 nm, respectively. In their temperature-dependent emission profiles, while 1 largely blue-shifted upon increasing temperature, 2 only exhibited a marginal blue-shift. As shown in Fig. 3b, upon excitation at 500 nm at 77 K, 1 featured a board NIR emission band centered at 871 nm. With increasing temperature, a continuous bathochromic effect occurred to afford at 398 K an emission maximum at 731 nm. The luminescence intensity grew persistently from 77 K to peak at 298 K and then started to decline, where the identifiable emission maximum at 731 nm was observed at 398 K. When heated from 77 to 328 K, the emission maximum of 2 blue-shifted from 748 to 738 nm (Fig. 3e). In this process, the luminescence intensity increased from 77 K to culminate at 208 K and then decreased. Above 328 K, luminescence became too weak to be identified.The blue-shifting trend with increasing temperature is suggestive of a TADF mechanism for Cu(I) clusters 1 and 2.14 In this context, the temperature-dependent emission decay time was measured (Fig. 3c and f), and their correlation was studied with the Boltzmann equation derived from the TADF model:
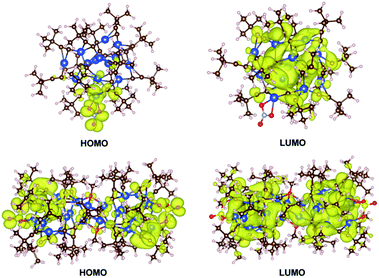
DFT calculations were performed with the Vienna Ab initio Simulation Package (VASP)17 to gain insight into the photophysical properties of 1 and 2, where their whole molecular structures remained intact. The Perdew–Burke–Ernzerhof (PBE) exchange-correlation functional and projector augmented wave (PAW) method were employed with an energy cutoff of 500.0 eV.18 For computational efficiency, a single nanocluster of 1 and 2 was extracted and padded with 10 Å in x, y, and z directions, and the gamma point was used to sample the Brillouin zone. The optimized geometries of the ground state of 1 and 2 are comparable to those determined by X-ray crystallographic analysis. For example, the computed structure of 1 gave bond lengths of Cu12–O1 2.348 and Cu12–O2 2.118 Å, which are close to the respective values of 2.379 and 2.169 Å in the crystal structure. The highest occupied molecular orbital (HOMO) and lowest unoccupied molecular orbital (LUMO) of 1 and 2 are shown in Fig. 4. For 1, the HOMO is predominately distributed over the nitrate oxygen atoms and their coordinated Cu(I) atoms, whereas the LUMO resides on the remaining Cu(I) atoms with some population on the tBuC![[triple bond, length as m-dash]](https://www.rsc.org/images/entities/char_e002.gif) C− ligands. For 2, the HOMO is dominated by the sulfate oxygen atoms and their coordinated Cu(I) atoms and tBuC
C− ligands. For 2, the HOMO is dominated by the sulfate oxygen atoms and their coordinated Cu(I) atoms and tBuC![[triple bond, length as m-dash]](https://www.rsc.org/images/entities/char_e002.gif) C− ligands, and the LUMO is contributed by Cu(I) atoms and tBuC
C− ligands, and the LUMO is contributed by Cu(I) atoms and tBuC![[triple bond, length as m-dash]](https://www.rsc.org/images/entities/char_e002.gif) C− ligands. Thus the emissions of 1 and 2 originating from LUMO to HOMO charge transfer mainly involve a mixed tBuC
C− ligands. Thus the emissions of 1 and 2 originating from LUMO to HOMO charge transfer mainly involve a mixed tBuC![[triple bond, length as m-dash]](https://www.rsc.org/images/entities/char_e002.gif) C− → Cu(I) LMCT and cluster-centered transition. This result is in agreement with that of [Cu(I)15(tBuC
C− → Cu(I) LMCT and cluster-centered transition. This result is in agreement with that of [Cu(I)15(tBuC![[triple bond, length as m-dash]](https://www.rsc.org/images/entities/char_e002.gif) C)10(CF3COO)5]·tBuC
C)10(CF3COO)5]·tBuC![[triple bond, length as m-dash]](https://www.rsc.org/images/entities/char_e002.gif) CH reported by Sun.19
CH reported by Sun.19
To contextualize the quenching effect of Cu(II) on photoluminescence properties, we compared the optical properties of 1–2 with 3–4. Fig. 5 shows the UV-Vis-NIR spectra measured in the solid state. While 1 and 2 show no indication of NIR absorption, 3 and 4 exhibit prominent bands in the NIR region 700–1200 nm, which evidently stem from incorporation of Cu(II). According to the DFT calculation and reported metal alkynyl clusters, the visible-light absorption in 300–600 nm for 1–4 is attributed to various charge transfer transitions including π → π* acetylide, cluster-centered, MLCT and LMCT interactions.19a,20 In contrast, the NIR absorption of 3 and 4 is assigned to IVCT from Cu(I) (3d10) to Cu(II) (3d9). Such IVCT was achieved by the Cu(I)–O–Cu(II) linkage as described above.20 The fact that 3 and 4 do not emit also provides spectral evidence for a charge-transfer quenching mechanism, that is, the characteristic photoluminescence of 3 and 4 originating from the alkynyl → Cu(I) LMCT and cluster-centered transition was switched off by the subsequent Cu(I) → Cu(II) IVCT transition.21
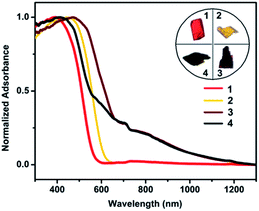 | ||
| Fig. 5 UV-Vis-NIR diffuse reflectance spectra of 1–4 measured in the solid state. Inset: appearance of single crystals under ambient light. | ||
Dielectric and electrical properties
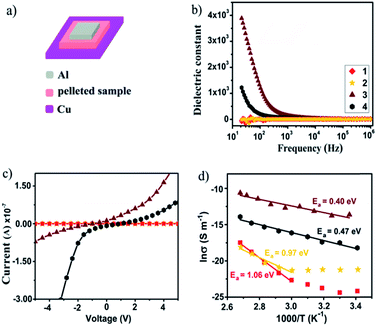
The divergent photophysical properties of 1–2 from 3–4 demonstrate that their metal cores tailor the materials' bulk behavior. This prompts us to further explore their dielectric and electrical properties, which have been less studied in metal nanoclusters owing to their instability in the fabrication of high-quality thin films.22 In this vein, bulk crystalline samples of 1–4 were each prepared as a pellet and sandwiched between Cu and Al electrodes to fabricate an electronic device for measurements (Fig. 6a). As shown in Fig. 6b, 1 and 2 display frequency-independent dielectric behavior with a dielectric constant of about 5.0, which corresponds to a low-dielectric state. By contrast, drastic response to frequency was detected from 103 and 102 Hz for 3 and 4, which gave at 20 Hz high dielectric constants of 3800 and 1500, respectively. For reference, [Cu(I)17(tBuC![[triple bond, length as m-dash]](https://www.rsc.org/images/entities/char_e002.gif) C)16MeOH]·BF4 with a cation–anion structure showed similar dielectric behavior to neutral nanoclusters 1 and 2 (Fig. S11†). This excludes the possibility that the high-dielectric state of 3 and 4 originates from cation/anion movement under an applied electric field. Instead, it is attributed to interfacial polarization dictated by the presence/distribution of Cu(II) cations and O2− anions with large dipole moments.
C)16MeOH]·BF4 with a cation–anion structure showed similar dielectric behavior to neutral nanoclusters 1 and 2 (Fig. S11†). This excludes the possibility that the high-dielectric state of 3 and 4 originates from cation/anion movement under an applied electric field. Instead, it is attributed to interfacial polarization dictated by the presence/distribution of Cu(II) cations and O2− anions with large dipole moments.
The temperature-dependent electrical conductivities of 1–4 were measured using a two-probe current–voltage (I–V) technique. At ambient temperature, 1 and 2 show low conductivities of 3.19 × 10⁻¹¹ and 6.09 × 10⁻¹¹ S m−1, which upon increasing the temperature to 100 °C increased to 2.57 × 10⁻⁸ and 2.29 × 10⁻⁹ S m−1, respectively. The I–V curves show a linear characteristic in the measured temperature range (Fig. 6c). As seen in Fig. 6d, the corresponding Arrhenius fit to data in the linear regime provides activation energies of 1.06 eV for 1 and 0.97 eV for 2, suggesting that both are electrical insulators. In contrast, the ambient temperature conductivities of 3 and 4 are significantly higher at 1.01 × 10⁻⁶ and 1.24 × 10⁻⁸ S m−1 and enhanced over a temperature range of 80 °C to attain 2.33 × 10⁻⁵ and 9.04 × 10⁻⁷ S m−1, respectively. As such, 3 and 4 show two to four orders of magnitude increased ambient-temperature conductivities over 1 and 2. The logarithm of conductivity and inverse temperature displays a linear relationship, which indicates that 3 and 4 are thermally activated semiconductors. The activation energy was fitted to be 0.40 eV for 3 and 0.47 eV for 4. The electrical conductivities of 3 and 4 are comparable to those of semiconductive Cu(II) materials with moderate conductivity.23 Their enhanced electrical conductivities are likely due to interstitial incorporation of a Cu(II) cation as the electron acceptor to trigger IVCT that follows LMCT to facilitate charge mobility,24 where the Cu(II) cation should be chemically stabilized by ligand oxygen atoms within the Cu(I) shell. These results suggest that the electrical nature of Cu(I) nanoclusters can be modified by incorporating a trace amount of Cu(II) as the dopant, which may facilitate the search for suitable metal nanoclusters as new semiconducting materials.
Conclusions
In summary, we have prepared mixed-valence Cu(II)/Cu(I) nanoclusters via a vanadate-assisted oxidative procedure for comparison with related valence-pure Cu(I) nanoclusters. The charge-transfer processes occurring within these two types of nanoclusters dominate their photophysical, dielectric and electrical properties. Particularly, while the valence-pure nanoclusters exhibit near-infrared thermally activated delayed fluorescence, the mixed-valence ones display semiconductivity. These results not only demonstrate the feasibility to modify the metal core to engender distinct desirable properties, but also facilitate rationalization of the structure–property relationship for future development of function-specific metal nanoclusters.Conflicts of interest
There are no conflicts to declare.Acknowledgements
This work is dedicated to the memory of Prof. George A. Jeffrey (1915–2000), Founding Head of Department of Crystallography at the University of Pittsburgh. We gratefully acknowledge financial support by the Wei Lun Foundation and Faculty of Engineering Direct Grant by the Chinese University of Hong Kong, and a Postdoctoral Fellowship to L. L.-M. Zhang by the Chinese University of Hong Kong.Notes and references
- (a) Z. Lei, X.-K. Wan, S.-F. Yuan, Z.-J. Guan and Q.-M. Wang, Acc. Chem. Res., 2018, 51, 2465 CrossRef CAS PubMed; (b) R. S. Dhayal, W. E. van Zyl and C. W. Liu, Acc. Chem. Res., 2016, 49, 86 CrossRef CAS PubMed; (c) Z. B. Gan, N. Xia and Z. K. Wu, Acc. Chem. Res., 2018, 51, 2774 CrossRef CAS PubMed; (d) Q.-M. Wang, Y.-M. Lin and K.-G. Liu, Acc. Chem. Res., 2015, 48, 1570 CrossRef CAS PubMed; (e) Q. Li, M. Zhou, W. Y. So, J. C. Huang, M. X. Li, D. R. Kauffman, M. Cotlet, T. Higaki, L. A. Peteanu, Z. Z. Shao and R. Jin, J. Am. Chem. Soc., 2019, 141, 5314 CrossRef CAS PubMed; (f) X. Kang, S. X. Wang, Y. B. Song, S. Jin, G. D. Sun, H. Z. Yu and M. Z. Zhu, Angew. Chem., Int. Ed., 2016, 55, 3611 CrossRef CAS PubMed; (g) T. A. Nguyen, Z. R. Jones, B. R. Goldsmith, W. R. Buratto, G. Wu, S. L. Scott and T. W. Hayton, J. Am. Chem. Soc., 2015, 137, 13319 CrossRef CAS PubMed.
- (a) X. Liu and D. Astruc, Coord. Chem. Rev., 2018, 359, 112 CrossRef CAS; (b) X. Kang and M. Zhu, Chem. Soc. Rev., 2019, 48, 2422 RSC; (c) V. W.-W. Yam and K. K.-W. Lo, Chem. Soc. Rev., 1999, 28, 323 RSC; (d) X. Yuan, Z. Luo, Y. Yu, Q. Yao and J. Xie, Chem.–Asian J., 2013, 8, 858 CrossRef CAS PubMed; (e) Z.-H. Chen, L.-Y. Zhang and Z.-N. Chen, Organometallics, 2012, 31, 256 CrossRef CAS; (f) J.-W. Liu, L. Feng, H.-F. Su, Z. Wang, Q.-Q. Zhao, X.-P. Wang, C.-H. Tung, D. Sun and L.-S. Zheng, J. Am. Chem. Soc., 2018, 140, 1600 CrossRef CAS PubMed; (g) Z. Wang, H.-F. Su, C.-H. Tung, D. Sun and L.-S. Zheng, Nat. Commun., 2018, 9, 4407 CrossRef PubMed; (h) S.-S. Zhang, H.-F. Su, G.-L. Zhuang, X.-P. Wang, C.-H. Tung, D. Sun and L.-S. Zheng, Chem. Commun., 2018, 54, 11905 RSC; (i) Z. Wang, H.-F. Su, Y.-Z. Tan, S. Schein, S.-C. Lin, W. Liu, S.-A. Wang, W.-G. Wang, C.-H. Tung, D. Sun and L.-S. Zheng, Proc. Natl. Acad. Sci. U. S. A., 2017, 114, 12132 CrossRef CAS PubMed.
- (a) R. Jin, Nanoscale, 2015, 7, 1549 RSC; (b) M. Zhu, C. M. Aikens, F. J. Hollander, G. C. Schatz and R. Jin, J. Am. Chem. Soc., 2008, 130, 5883 CrossRef CAS PubMed; (c) W.-H. Fang, L. Zhang and J. Zhang, J. Am. Chem. Soc., 2016, 138, 7480 CrossRef CAS PubMed; (d) H. N. Miras, J. Yan, D.-L. Long and L. Cronin, Chem. Soc. Rev., 2012, 41, 7403 RSC; (e) D.-L. Long, E. Burkholdera and L. Cronin, Chem. Soc. Rev., 2007, 36, 105 RSC; (f) K.-G. Liu, S.-K. Chen, Y.-M. Lin and Q.-M. Wang, Chem. Commun., 2015, 51, 9896 RSC.
- (a) S. Hossain, Y. Niihori, L. V. Nair, B. Kumar, W. Kurashige and Y. Negishi, Acc. Chem. Res., 2018, 51, 3114 CrossRef CAS PubMed; (b) Y. Negishi, W. Kurashige, Y. Niihori and K. Nobusada, Phys. Chem. Chem. Phys., 2013, 15, 18736 RSC; (c) S. Wang, Y. Song, S. Jin, X. Liu, J. Zhang, Y. Pei, X. Meng, M. Chen, P. Li and M. Zhu, J. Am. Chem. Soc., 2015, 137, 4018 CrossRef CAS PubMed; (d) G. Soldan, M. A. Aljuhani, M. S. Bootharaju, L. G. AbdulHalim, M. R. Parida, A.-H. Emwas, O. F. Mohammed and O. M. Bakr, Angew. Chem., Int. Ed., 2016, 55, 5749 CrossRef CAS PubMed; (e) A. Ghosh, O. F. Mohammed and O. M. Bakr, Acc. Chem. Res., 2018, 51, 3094 CrossRef CAS PubMed; (f) Y. Wang, H. Su, L. Ren, S. Malola, S. Lin, B. K. Teo, H. Häkkinen and N. Zheng, Angew. Chem., Int. Ed., 2016, 55, 15152 CrossRef CAS PubMed; (g) R. P. B. Silalahi, K. K. Chakrahari, J.-H. Liao, S. Kahlal, Y.-C. Liu, M.-H. Chiang, J.-Y. Saillard and C. W. Liu, Chem.–Asian J., 2018, 13, 500 CrossRef CAS PubMed; (h) H. Qian, D. Jiang, G. Li, C. Gayathri, A. Das, R. R. Gil and R. Jin, J. Am. Chem. Soc., 2012, 134, 16159 CrossRef CAS PubMed.
- (a) F. Olbrich, J. Kopf and E. Weiss, Angew. Chem., Int. Ed., 1993, 32, 1077 CrossRef; (b) T. C. Higgs, P. J. Bailey, S. Parsons and P. A. Tasker, Angew. Chem., Int. Ed., 2002, 41, 3038 CrossRef CAS; (c) S. S. Y. Chui, M. F. Y. Ng and C.-M. Che, Chem.–Eur. J., 2005, 11, 1739 CrossRef CAS PubMed; (d) X. Y. Chang, K. H. Low, J. Y. Wang, J. S. Huang and C.-M. Che, Angew. Chem., Int. Ed., 2016, 55, 10312 CrossRef CAS PubMed; (e) G.-C. Kuang, P. M. Guha, W. S. Brotherton, J. T. Simmons, L. A. Stankee, B. T. Nguyen, R. J. Clark and L. Zhu, J. Am. Chem. Soc., 2011, 133, 13984 CrossRef CAS PubMed; (f) H. Lang, A. Jakob and B. Milde, Organometallics, 2012, 31, 7661 CrossRef CAS.
- A. W. Cook, Z. R. Jones, G. Wu, S. L. Scott and T. W. Hayton, J. Am. Chem. Soc., 2018, 140, 394 CrossRef CAS PubMed.
- P. Yuan, R. H. Chen, X. M. Zhang, F. J. Chen, J. Z. Yan, C. F. Sun, D. H. Ou, J. Peng, S. C. Lin, Z. C. Tang, B. K. Teo, L. S. Zheng and N. F. Zheng, Angew. Chem., Int. Ed., 2019, 58, 835 CrossRef CAS PubMed.
- (a) L.-M. Zhang and T. C. W. Mak, J. Am. Chem. Soc., 2016, 138, 2909 CrossRef CAS PubMed; (b) L. L.-M. Zhang and T. C. W. Mak, Angew. Chem., Int. Ed., 2017, 56, 16228 CrossRef CAS PubMed.
- (a) I. Chakraborty and T. Pradeep, Chem. Rev., 2017, 117, 8208 CrossRef CAS PubMed; (b) B. Nieto-Ortega and T. Bürgi, Acc. Chem. Res., 2018, 51, 2811 CrossRef CAS PubMed; (c) K. Kwak and D. Lee, Acc. Chem. Res., 2019, 52, 12 CrossRef CAS PubMed; (d) R. Jin, C. Zeng, M. Zhou and Y. Chen, Chem. Rev., 2016, 116, 10346 CrossRef CAS PubMed.
- Y.-P. Xie, J.-B. Wen, C.-W. Pan, G.-X. Duan, L.-Y. Li and X. Lu, Cryst. Growth Des., 2019 DOI:10.1021/acs.cgd.9b00803.
- (a) Y.-P. Xie and T. C. W. Mak, J. Am. Chem. Soc., 2011, 133, 3760 CrossRef CAS PubMed; (b) Y.-P. Xie and T. C. W. Mak, Angew. Chem., Int. Ed., 2012, 51, 8783 CrossRef CAS PubMed; (c) Y.-P. Xie, J.-L. Jin, X. Lu and T. C. W. Mak, Angew. Chem., Int. Ed., 2015, 54, 15176 CrossRef CAS PubMed; (d) Y.-P. Xie and T. C. W. Mak, Chem. Commun., 2012, 48, 1123 RSC; (e) G.-X. Duan, Y.-P. Xie, J.-L. Jin, L.-P. Bao, X. Lu and T. C. W. Mak, Chem.–Eur. J., 2018, 24, 6662 CrossRef; (f) G.-G. Gao, P.-S. Cheng and T. C. W. Mak, J. Am. Chem. Soc., 2009, 131, 18257 CrossRef CAS PubMed; (g) H. Liu, C.-Y. Song, R.-W. Huang, Y. Zhang, H. Xu, M.-J. Li, S.-Q. Zang and G.-G. Gao, Angew. Chem., Int. Ed., 2016, 55, 3699 CrossRef CAS PubMed.
- I. D. Brown and D. Altermatt, Acta Crystallogr., Sect. B: Struct. Sci., Cryst. Eng. Mater., 1985, 41, 244 CrossRef.
- (a) D. Armentano, T. F. Mastropietro, M. Julve, R. Rossi, P. Rossi and G. De Munno, J. Am. Chem. Soc., 2007, 129, 2740 CrossRef CAS PubMed; (b) V. Shivaiah and S. K. Das, Angew. Chem., Int. Ed., 2006, 45, 245 CrossRef CAS PubMed; (c) E. Faggi, R. Gavara, M. Bolte, L. Fajarí, L. Juliá, L. Rodríguez and I. Alfonso, Dalton Trans., 2015, 44, 12700 RSC.
- S. Evariste, A. M. Khalil, M. E. Moussa, A. K.-W. Chan, E. Y.-H. Hong, H.-L. Wong, B. L. Guennic, G. Calvez, K. Costuas, V. W.-W. Yam and C. Lescop, J. Am. Chem. Soc., 2018, 140, 12521 CrossRef CAS PubMed.
- (a) T. Sajoto, P. I. Djurovich, A. B. Tamayo, J. Oxgaard, W. A. Goddard and M. E. Thompson, J. Am. Chem. Soc., 2009, 131, 9813 CrossRef CAS PubMed; (b) T. Hofbeck, U. Monkowius and H. Yersin, J. Am. Chem. Soc., 2015, 137, 399 CrossRef CAS PubMed; (c) M. J. Leitl, V. A. Krylova, P. I. Djurovich, M. E. Thompson and H. Yersin, J. Am. Chem. Soc., 2014, 136, 16032 CrossRef CAS PubMed; (d) R. Czerwieniec, M. J. Leitl, H. H. H. Homeier and H. Yersin, Coord. Chem. Rev., 2016, 325, 2 CrossRef CAS; (e) T. J. Feuerstein, B. Goswami, P. Rauthe, R. Köppe, S. Lebedkin, M. M. Kappesbc and P. W. Roesky, Chem. Sci., 2019, 10, 4742 RSC.
- G. Li, R. S. Nobuyasu, B. Zhang, Y. Geng, B. Yao, Z. Xie, D. Zhu, G. Shan, W. Che, L. Yan, Z. Su, F. B. Dias and M. R. Bryce, Chem.–Eur. J., 2017, 23, 11761 CrossRef CAS PubMed.
- (a) G. Kresse, J. Non-Cryst. Solids, 1995, 192–193, 222 CrossRef; (b) G. Kresse and J. Hafner, Phys. Rev. B: Condens. Matter Mater. Phys., 1994, 49, 14251 CrossRef CAS PubMed; (c) G. Kresse and J. Furthmuller, Comput. Mater. Sci., 1996, 6, 15 CrossRef CAS; (d) G. Kresse and J. Furthmuller, Phys. Rev. B: Condens. Matter Mater. Phys., 1996, 54, 11169 CrossRef CAS PubMed.
- (a) J. P. Perdew, K. Burke and M. Ernzerhof, Phys. Rev. Lett., 1996, 77, 3865 CrossRef CAS PubMed; (b) P. E. Blöchl, Phys. Rev. B: Condens. Matter Mater. Phys., 1994, 50, 17953 CrossRef PubMed.
- (a) H.-Y. Zhuo, H.-F. Su, Z.-Z. Cao, W. Liu, S.-A. Wang, L. Feng, G.-L. Zhuang, S.-C. Lin, M. Kurmoo, C.-H. Tung, D. Sun and L.-S. Zheng, Chem.–Eur. J., 2016, 22, 17619 CrossRef CAS PubMed; (b) H.-Y. Zhuo, A.-Y. Hu, L. Feng, Q.-Y. Liu, X.-P. Wang and D. Sun, J. Cluster Sci., 2018, 29, 1017 CrossRef CAS.
- (a) C. Chan, K. Cheung, W. H. Lam, E. C. Cheng, N. Zhu, S. W. Choi and V. W.-W. Yam, Chem.–Asian J., 2006, 1, 273 CrossRef CAS PubMed; (b) W.-Y. Lo, C.-H. Lam, V. W.-W. Yam, N. Zhu, K.-K. Cheung, S. Fathallah, S. Messaoudi, B. L. Guennic, S. Kahlal and J.-F. Halet, J. Am. Chem. Soc., 2004, 126, 7300 CrossRef CAS PubMed; (c) G. F. Manbeck, W. W. Brennessel, R. A. Stockland and R. Eisenberg, J. Am. Chem. Soc., 2010, 132, 12307 CrossRef CAS PubMed; (d) S. Ibáñez, M. Poyatos and E. Peris, Angew. Chem., Int. Ed., 2018, 57, 16816 CrossRef PubMed.
- (a) S. Chen, W.-H. Fang, L. Zhang and J. Zhang, Angew. Chem., Int. Ed., 2018, 57, 11252 CrossRef CAS PubMed; (b) X. Ma, C.-S. Lin, X.-Q. Zhu, S.-M. Hu, T.-L. Sheng and X.-T. Wu, Angew. Chem., Int. Ed., 2017, 56, 1605 CrossRef CAS PubMed; (c) R.-W. Huang, Q.-Q. Xu, H.-L. Lu, X.-K. Guo, S.-Q. Zang, G.-G. Gao, M.-S. Tang and T. C. W. Mak, Nanoscale, 2015, 7, 7151 RSC; (d) Y. Xiao and Q.-M. Wang, Chem.–Eur. J., 2012, 18, 11184 CrossRef CAS PubMed.
- (a) M. Galchenko, A. Black, L. Heymann and C. Klinke, Adv. Mater., 2019, 31, 1900684 CrossRef PubMed; (b) F. A. Brede, J. Heine, G. Sextl and K. Müller-Buschbaum, Chem.–Eur. J., 2016, 22, 2708 CrossRef CAS PubMed.
- (a) J. Park, A. C. Hinckley, Z. H. Huang, D. W. Feng, A. A. Yakovenko, M. Lee, S. C. Chen, X. D. Zou and Z. N. Bao, J. Am. Chem. Soc., 2018, 140, 14533 CrossRef CAS PubMed; (b) H. Nagatomi, N. Yanai, T. Yamada, K. Shiraishi and N. Kimizuka, Chem.–Eur. J., 2018, 24, 1806 CrossRef CAS PubMed; (c) F. Yu, J. Li, Z.-H. Cao, M. Kurmoo and J.-L. Zuo, Inorg. Chem., 2018, 57, 3443 CrossRef CAS PubMed.
- (a) J. A. DeGayner, I.-R. Jeon, L. Sun, M. Dincă and T. D. Harris, J. Am. Chem. Soc., 2017, 139, 4175 CrossRef CAS PubMed; (b) I.-R. Jeon, L. Sun, B. Negru, R. P. V. Duyne, M. Dinca and T. D. Harris, J. Am. Chem. Soc., 2016, 138, 6583 CrossRef CAS PubMed; (c) L. J. Liu, J. A. DeGayner, L. Sun, D. Z. Zee and T. D. Harris, Chem. Sci., 2019, 10, 4652 RSC.
Footnotes |
| † Electronic supplementary information (ESI) available. CCDC 1907665–1907669 and 1907707. For ESI and crystallographic data in CIF or other electronic format see DOI: 10.1039/c9sc03455b |
| ‡ These authors contributed equally to this work. |
| This journal is © The Royal Society of Chemistry 2019 |

