 Open Access Article
Creative Commons Attribution 3.0 Unported Licence
A concentrated array of copper porphyrin candidate qubits†
Chung-Jui
Yu
a,
Matthew D.
Krzyaniak
 ab,
Majed S.
Fataftah
a,
Michael R.
Wasielewski
 *ab and
Danna E.
Freedman
 *a
*a
aDepartment of Chemistry, Northwestern University, Evanston, Illinois 60208, USA. E-mail: danna.freedman@northwestern.edu
bInstitute for Sustainability and Energy at Northwester, Northwestern University, Evanston, Illinois 60208-3113, USA
First published on 21st November 2018
Abstract
Synthetic chemistry offers a pathway to realize atomically precise arrays of qubits, the smallest unit of a quantum information science system. We harnessed framework chemistry to create an array of qubit candidates, featuring one qubit every 13.6 Å, by synthesizing the new copper(II) variant of the porphyrinic metal–organic framework PCN-224. We subjected the framework to pulse-electron paramagnetic resonance (EPR) measurements, establishing spin coherence at temperatures up to 80 K within a fully spin concentrated framework. Observation of Rabi oscillations further support the viability of the qubits within these arrays. To interrogate the spin dynamics of qubit arrays, we investigated spin–lattice relaxation, T1, through a combination of pulse-EPR and alternating current (ac) magnetic susceptibility measurements. These data revealed distinct vibrational environments within the frameworks that contribute to spin dynamics. The aggregate results establish a pathway for a synthetic approach to create spatially precise networks of qubits.
Introduction
The advent of quantum information science (QIS) offers the potential to revolutionize our problem-solving approaches across fields, from cryptography to the simulation of protein folding.1–5 The development of qubits, the elementary units of a QIS system, is a prerequisite to realize the promise of QIS. Electronic spin sublevels (MS levels) in paramagnetic coordination complexes are a promising class of qubits due to the facile synthetic tunability of their chemical and magnetic parameters.6–9 In the development of this class of qubits, the performance can be determined by two metrics: the coherence time (T2), which is the superposition lifetime within which all computations must be performed,9 and the spin–lattice relaxation time (T1), which serves as the upper limit to T2 and the inverse of which (1/T1) determines the operating speed of the qubit.10 There is a rich body of work describing the spin dynamics of coordination complexes, which enabled the development of synthetic design principles for the creation of molecular qubits.11–29 These recent advances have propelled coordination complexes as viable qubit candidates for QIS, with spin properties comparable to those seen in solid-state materials, such as the heralded nitrogen vacancy pair defects in diamond.14,29,30For coordination chemistry to realize QIS applications, the next crucial challenge is the integration of qubits into ordered arrays. Discrete spatial control is necessary to engender the qubit–qubit coupling for complex QIS system operations, such as gate operations within quantum computing.7,9,31,32 Much of the current studies on molecular qubits involve molecules dissolved in frozen solvent matrices or incorporated within diamagnetic solid-state matrices. The random distribution of spin centers within these matrices render discrete spatial control of qubits exceedingly difficult. Thus, there is a pressing need for the development of new materials that may incorporate molecular qubits into discrete ordered arrays.
Framework materials, most notably metal–organic frameworks (MOFs), offer a pathway to incorporate molecular qubits into well-ordered arrays. MOFs are porous materials synthesized from organic and inorganic building blocks using the fundamental principles of coordination chemistry.33–36 These materials hold several key advantages for the realization of ordered qubit arrays. First, the high degree of synthetic versatility of MOFs imparts immense synthetic control in the design of these materials, particularly for the installation of qubits. Furthermore, the highly modular nature of MOFs permits integration of two- and three-dimensional MOFs into an assortment of devices and substrates.35,37–42 Second, the porous nature of these materials spatially separates the qubits to potentially minimize destructive qubit–qubit interactions that shorten coherence time, thus permitting qubit manipulations in a concentrated array of qubits. In addition, the porosity of the framework offers the potential for quantum sensing applications. Quantum sensing would exploit the fragile superposition state of the qubit units to detect analytes within the framework.43
The aggregate of these features of MOFs suggest promise for the creation of qubit arrays in both QIS and quantum sensing applications. Indeed, a few recent studies have explored MOFs as platforms for such potential applications.44–46 Studies on copper(II), vanadyl, and cobalt(II) porphyrin frameworks have yielded new insights regarding the transition from molecular qubits to extended qubit arrays. However, these systems employed magnetically dilute MOFs, wherein only a fraction of the metal centers are spin active. The random nature of magnetic dilution results in similar limitations of spatial control of the spin centers to solution phase studies. The next step is to demonstrate spin coherence in a framework within which the spin centers are located at precise crystallographic positions. To achieve this, it is imperative to explore frameworks that are fully spin concentrated, thereby engendering spatial precision of the candidate qubits. Crucially, creating these networks enables quantification of the impact of spin–spin interactions on spin dynamics, which may provide new design principles for future molecular qubit arrays.
Herein we report the synthesis and pulse-EPR analysis of the new materials Cu0.1-PCN-224 (1), Cu0.4-PCN-224 (2), and Cu1.0-PCN-224 (3), which are new variants of the known Zr-based porphyrinic MOF PCN-224 featuring S = ½ copper(II) centers bound by the porphyrin linkers. Copper(II) porphyrins have been studied extensively within the EPR literature,47–52 and their coherence properties are well established in molecular form. The ability to easily compare the spin dynamics of copper(II) porphyrins embedded in MOFs to molecular copper(II) porphyrins is important for extracting the contribution of the MOF lattice to spin dynamics. We demonstrate the successful incorporation of the copper(II) porphyrin within the PCN-224 lattice. Crucially, we observe spin coherence up to 80 K in the fully spin concentrated framework 3. To better understand the contributions of electron–electron spin interactions and the phonon environment of the MOF on spin–lattice relaxation time, T1, and on coherence times, T2, we subjected these materials to a series of measurements. Pulse-EPR spectroscopy and ac magnetic susceptibility measurements enabled us to quantify the different contributions of electron–electron spin interactions and the phonon environment of the MOF on T1, thereby suggesting future design principles for networks of electronic spin candidate qubits.
Results and discussion
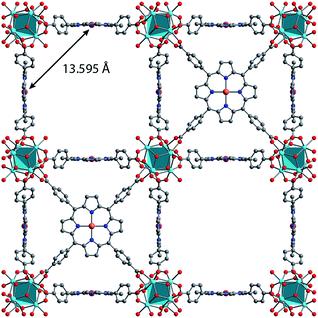
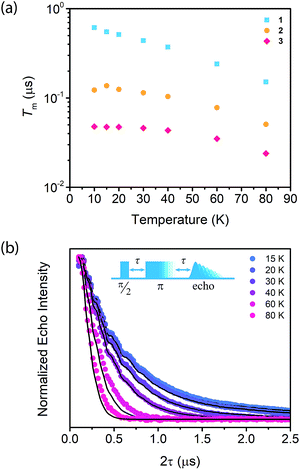
Synthesis of MOFs 1–3 proceeded via hydrothermal reactions of a mixture of zirconium tetrachloride (ZrCl4), 5,10,15,20-tetrakis(carboxyphenyl)porphyrin copper(II) (CuTCPP), 5,10,15,20-tetrakis(carboxyphenyl)porphyrin (TCPP), and benzoic acid in dimethylformamide (DMF). CuTCPP and TCPP were mixed in the desired molar ratio to achieve the targeted degree of metalation. Incorporation of CuTCPP into the framework was confirmed by diffuse-reflectance UV/visible spectroscopy and inductively coupled plasma-optical emission spectroscopy (ICP-OES). N2 adsorption isotherms of 1–3 yielded BET surface areas of 2427–3076 m2 g−1, confirming the porosity of the material. (ESI, Fig. S16–S19†). Single crystal X-ray diffraction of 3 confirmed the PCN-224 structure with copper(II) porphyrinic ligands, with nearest Cu–Cu distances of 13.5948(2) Å (Fig. 1). Continuous-wave (CW) EPR spectroscopy on 1–3 was modelled using EasySpin53 with axial g and A components, yielding g‖ = 2.186, g⊥ = 2.042, ACu‖ = 611 MHz, ACu⊥ = 79.4 MHz, AN‖ = 43.2 MHz and AN⊥ = 48.2 MHz (Fig. S1, Table S2†). We observe a concentration dependence with the Lorentzian linewidth ΓL of the CW spectra, with line broadening increasing with copper(II) concentration as a result of electron–electron dipolar interactions.54 The g and A values are consistent with those observed in molecular copper porphyrins.47,50,52 Thus, we confirm the successful incorporation of molecular copper(II) porphyrins into the PCN-224 framework with little change in electronic structure, thereby permitting our study of molecular spin dynamics within a MOF matrix.To begin our investigation on the spin dynamics of 1–3, we first sought to measure the phase memory time (Tm) of the copper(II) centers in the PCN-224 framework. Tm encompasses all processes that contribute to electron spin decoherence, including the intrinsic coherence time T2 of the electron spin.55 Here, we were particularly interested in whether we could observe a spin echo with 3, the fully concentrated framework, due to the spin dense environment. To quantify Tm, Hahn echo experiments were performed on the resonances at 2942 G and 3328 G across 10–80 K for 1–3. The two resonances correspond to different molecular orientations as a result of the axial environment of the copper(II) spin center. The lower field resonance corresponding to the principle axis g‖, which is perpendicular to the porphyrin plane. The higher field resonance corresponds to a powder average of orientations. Fits to a monoexponential decay collected on the 3328 G resonance yielded Tm values of 645, 121, and 46 ns for 1–3, respectively, at 10 K. By 80 K, Tm decays to 158, 38, and 25 ns for 1–3, respectively (Fig. 2a). Similar values were seen for 1–3 at 2942 G (Fig. S3†). Remarkably, in 3 a spin echo was observed up to 80 K at both resonances.
The foregoing results prompted us to test the quantum mechanical behavior of 1–3 through the application of a transient nutation.56–59 Rabi oscillations were observed for all of the frameworks by measuring the projection of the magnetization onto the z axis with a Hahn echo as a function of the duration of an initial nutation pulse. As expected, the nutation frequencies scale with the applied microwave powers in accordance with the S = ½ spin state for 1–3 (see Fig. S12†).56,60 The observation of Rabi oscillations and the S = ½ nature of the spins in 1–3 establish them as viable arrays of candidate qubits.
Compounds 1–3 demonstrate a clear trend in Tm between the different spin concentrations (Fig. 2a, S3†) across 10–80 K, whereby Tm sequentially decreases in magnitude with increasing spin concentration. It is noteworthy that a nearly identical trend in the temperature dependence on Tm is observed across 1–3. At both resonances, Tm does not depend significantly on temperature up to 20 K, after which Tm decreases at approximately the same rate between 1–3 (Fig. 2a, S3†). Within 1–3, the crystalline structure and open channels of PCN-224 yield identical nuclear spin environments around the copper(II) spin centers. The contribution of the fluctuating hyperfine field from nuclear spins to Tm should be the same between 1–3.54 Given that the only difference between 1–3 is the concentration of spins, we expect an enhancement in Tm relaxation induced by electron dipole–dipole interaction with increasing spin concentration. This process occurs when random copper(II) spin flips, the rate of which is inversely proportional to T1, promote Tm relaxation to nearby, dipolar-coupled copper(II) spin centers.61 We sought to model the temperature dependence of Tm for 1–3 incorporating electron–electron dipolar relaxation process. To do so, we applied the theory developed by Salikhov et al. that describes the contribution of electron dipole–dipole interactions and T1 to the electron spin echo decay (see ESI†).61
For our model, we utilized both the copper(II)–copper(II) distances obtained from the crystal structure of 3 up to 60 Å and a weighted number of spins (Table S14†). Utilizing the distances and the measured T1's, vide infra, we calculated the Tm relaxation enhancement relative to 10 K as a function of temperature (see ESI† for further details). Our model yielded fits that reproduce the temperature dependence of Tm (Fig. 2b, S6†), and we find that approximately 50 Å represents the limit at which the contribution of this relaxation process is significant. This distance is well within the range of electron–electron spin distances explored with electron–electron double resonance (ELDOR) techniques, suggesting the 50 Å limit from this model is within reason.62–65 Previous works on nitroxide radicals have demonstrated that, for distances beyond 60 Å, nuclear spin-induced decoherence pathways become much more significant than electron–electron spin interactions, further supporting the 50 Å limit determined for 1–3 by our model.63,65 Taken together, the 50 Å benchmark proposed by this model may serve as a key design parameter for future developments of ordered qubit arrays in MOFs. Additionally, this model provides a method to quantify electron–electron spin distances and interactions even in a highly spin concentrated system with T1 and Tm measurements, as ELDOR techniques are limited by the short Tm lifetimes.
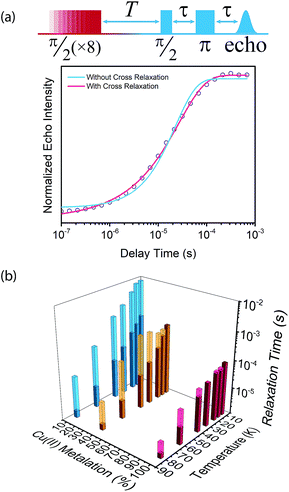
We then proceeded to quantify T1 in 1–3 across 10–80 K. Fundamentally, spin–lattice relaxation is the phonon-mediated equilibration of the excited and ground Zeeman energy levels for an electronic spin. In addition to phonon processes, spin–lattice relaxation may also be induced by spin–spin interactions through cross relaxation, whereby energy is exchanged from the observed copper(II) spin center to another, fast-relaxing center mediated by dipolar interactions.66 This relaxation pathway will possess a characteristic relaxation rate that contributes to the saturation recovery experiment, in addition to the intrinsic spin–lattice relaxation rate. Thus, the magnitude of the cross relaxation rate, relative to that of spin–lattice relaxation, will provide insight to the competition between T1 relaxation induced by environmental phonons or spin–spin interactions.
Saturation recovery experiments on 1–3 at 2942 and 3328 G yielded T1 valuesshown in Fig. 4a and S4.† The saturation recovery experiments on 1–3 were fit with the following expression (Fig. 3a, see ESI†):
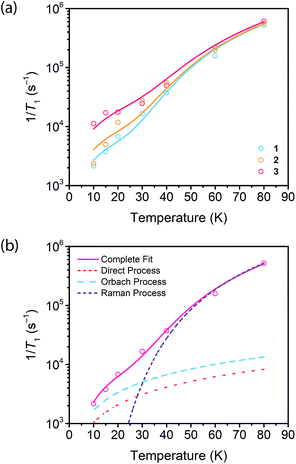 | ||
Fig. 4 (a) Fits to the temperature dependence of 1/T1 for  , ,  , and , and  at 3328 G. Results of the fits are reported in Table S13.† (b) Fit to the temperature dependence of 1/T1 of 1 at 3328 G resonance. The red line represents the total fit, while the orange, blue and purple dashed lines represent the contributions of the direct, Orbach–Aminov and Raman processes, respectively. at 3328 G. Results of the fits are reported in Table S13.† (b) Fit to the temperature dependence of 1/T1 of 1 at 3328 G resonance. The red line represents the total fit, while the orange, blue and purple dashed lines represent the contributions of the direct, Orbach–Aminov and Raman processes, respectively. | ||
We then assessed the temperature dependence of T1 across 1–3 to explore phonon contributions to T1 relaxation. Within 10–80 K, we observe a distinct concentration dependence in the spin–lattice relaxation rate (1/T1) across 1–3 at 3328 G, while no dependence was observed at the 2942 G resonance (Fig. 4a, S11†). To investigate this concentration dependence, we employed a model that accounts for three main phonon processes that contribute to T1 relaxation, which are the direct, Raman and Orbach–Aminov processes (Fig. 4b). The direct process is a low energy, single phonon process that is typically dominant at temperatures below 10 K. The Raman process is a two-phonon event analogous to the Raman scattering of photons, and is often dominant in the temperature range of 20–100 K in analogous molecular porphyrin complexes.67 Similarly, the Orbach–Aminov process is also a two-phonon process, with the difference that the process is facilitated by a specific excited state of the system. This latter process may manifest from spin concentrated systems, wherein dipolar interactions between electronic spins generate low-lying excited states that facilitate energy transfer for spin–lattice relaxation.66,68
To quantify the contribution of each process in Cu-PCN-224, we globally fit temperature dependence of T1 for 1–3 at both resonances (Fig. 4a, S11, ESI†). For the Orbach process, the energy of the excited state was calculated based on the through-space dipole–dipole interaction between nearest neighbor copper(II) spin centers (13.595 Å). From the results of the fits, the values of the contributions of the direct (Adir) and Raman (ARam) processes are approximately one and two orders of magnitude larger than those obtained for copper tetratolylporphyrin (CuTTP) diluted in a diamagnetic ZnTTP matrix (Tables S12, S13†).49 Given the similarity in g factors between 1–3 and CuTTP in a ZnTTP matrix, we can rule out differences in spin–orbit coupling, which couples lattice phonons to the electronic spin, as the source of this difference in phonon relaxation pathways. To explain the discrepancy, we propose the MOF lattice contributes a different vibrational environment that may facilitate spin relaxation more effectively. Indeed, a recent work has demonstrated new vibrational environments of vanadyl porphyrins emerging in a MOF lattice, in contrast to a diamagnetic solid state molecular matrix.45 In 1–3, the MOF lattice likely possess unique low-energy phonons that enhance T1 relaxation rates relative to their molecular analogues, thus accounting for the enhanced influence of the direct and Raman processes in 1–3. The results of the fits also revealed a concentration dependence in the values of the Orbach process (AOrb) across 1–3 at 3328 G. This concentration dependence has been similarly observed in previous studies on trityl radicals and Ir4+ ions in single crystals.66,68 The observation of this concentration dependence suggests that dipolar-coupled copper(II) spin centers may act as a fast-relaxing center that facilitate T1 relaxation of nearby spin centers. Curiously, no similar dependence was observed at the 2942 G resonance. This may suggest a potential orientation dependence on the contribution of the Orbach relaxation process on T1. At 2942 G, the EPR transition probed along the g‖ orientation may experience weaker dipolar interactions with neighboring spin centers. The EPR transition at 3328 G, which encompasses a powder average of orientations, may experience the more dipolar interactions with nearby spin centers, including those at 13.595 Å away.
Field dependent ac susceptibility of 3 provides an additional probe to the interplay between spin–spin cross relaxation and phonon mediated relaxation processes. Real (χ′) and imaginary (χ′′) components of the ac signal were measured across 0.025–2 T at 5 K, and the relaxation time, τ, was extracted by fitting Cole–Cole plots of the data (see ESI†). The field dependence of τ reveals an increase in τ from 0.025–0.2 T, with the maximum at 0.72 ms, before decaying from 0.2–2 T. The origin of this behavior stems from the suppression of spin–spin and spin–nuclei interactions with increasing magnetic fields, tempered by the increase in the efficiency of the direct process at higher fields.12,13,30,69 To quantify the contribution of the direct process to τ, we fit the field dependence of τ in 3 with the extended Brons–van Vleck model:12,13
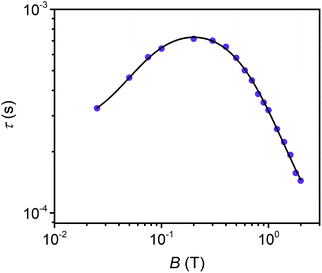 | ||
| Fig. 5 Field dependence of τ extracted from ac susceptibility measurements of 3 at 5 K. The black line represents fits to the data with the extended Brons–van Vleck model. | ||
Outlook
The foregoing results demonstrate the utility of synthetic chemistry to create spatially precise, concentrated arrays of qubits. We synthesized a new variant of the framework PCN-224 and studied the spin dynamics of the S = ½ centers within. Vitally, we observed spin coherence in a fully spin concentrated network, furthering the promise of MOFs as an architecture for incorporating molecular qubits in ordered arrays. We employed a model for T2 that, taking into account electron–electron spin interactions and T1, proposed a 50 Å limit within which spin–spin interactions play a significant role in decoherence. Through pulse-EPR and ac susceptibility measurements, distinct phonon environments in MOFs from their molecular analogues are observed. The sum of this work emphasizes T1 as a key figure of merit in limiting decoherence in spin–dense arrays. Future studies exploring different organic linkers and MOF structures on phonon distributions and electron–electron coupling strength in MOFs will be imperative to propel the field of molecular qubits towards scalable architectures.Conflicts of interest
There are no conflicts of interest.Acknowledgements
We thank Christos D. Malliakas for crystallographic assistance, Julia Oktawiec for her assistance in building the gas dosing setup, and Max Klemes and Michio Matsumoto for assistance with gas sorption measurements. This research was supported with funds from the National Science Foundation for CAREER Award No. CHE-1455017 (C.-J. Y., M. S. F., and D. E. F.) and Award No. CHE-1565925 (M. R. W.). We also acknowledge support from Northwestern University.Notes and references
- A. Aspuru-Guzik, A. D. Dutoi, P. J. Love and M. Head-Gordon, Science, 2005, 309, 1704 CrossRef CAS PubMed.
- R. P. Feynman, Int. J. Theor. Phys., 1982, 21, 467–488 CrossRef.
- N. Lambert, Y.-N. Chen, Y.-C. Cheng, C.-M. Li, G.-Y. Chen and F. Nori, Nat. Phys., 2012, 9, 10 Search PubMed.
- S. Lloyd, Science, 1996, 273, 1073–1078 CrossRef CAS PubMed.
- M. A. Nielsen and I. L. Chuang, Quantum Computation and Quantum Information: 10th Anniversary Edition, Cambridge University Press, Cambridge, 2010 Search PubMed.
- A. Ardavan and S. J. Blundell, J. Mater. Chem., 2009, 19, 1754–1760 RSC.
- G. Aromí, D. Aguila, P. Gamez, F. Luis and O. Roubeau, Chem. Soc. Rev., 2012, 41, 537–546 RSC.
- M. N. Leuenberger and D. Loss, Nature, 2001, 410, 789 CrossRef CAS PubMed.
- F. Troiani and M. Affronte, Chem. Soc. Rev., 2011, 40, 3119–3129 RSC.
- S. Nellutla, G. W. Morley, J. van Tol, M. Pati and N. S. Dalal, Phys. Rev. B: Condens. Matter Mater. Phys., 2008, 78, 054426 CrossRef.
- D. Aguilà, L. A. Barrios, V. Velasco, O. Roubeau, A. Repollés, P. J. Alonso, J. Sesé, S. J. Teat, F. Luis and G. Aromí, J. Am. Chem. Soc., 2014, 136, 14215–14222 CrossRef PubMed.
- M. Atzori, S. Benci, E. Morra, L. Tesi, M. Chiesa, R. Torre, L. Sorace and R. Sessoli, Inorg. Chem., 2017, 57, 731–740 CrossRef PubMed.
- M. Atzori, L. Tesi, S. Benci, A. Lunghi, R. Righini, A. Taschin, R. Torre, L. Sorace and R. Sessoli, J. Am. Chem. Soc., 2017, 139, 4338–4341 CrossRef CAS PubMed.
- K. Bader, D. Dengler, S. Lenz, B. Endeward, S.-D. Jiang, P. Neugebauer and J. van Slageren, Nat. Commun., 2014, 5, 5304 CrossRef CAS PubMed.
- K. Bader, S. H. Schlindwein, D. Gudat and J. van Slageren, Phys. Chem. Chem. Phys., 2017, 19, 2525–2529 RSC.
- K. Bader, M. Winkler and J. van Slageren, Chem. Commun., 2016, 52, 3623–3626 RSC.
- M. S. Fataftah, S. C. Coste, B. Vlaisavljevich, J. M. Zadrozny and D. E. Freedman, Chem. Sci., 2016, 7, 6160–6166 RSC.
- M. S. Fataftah, J. M. Zadrozny, S. C. Coste, M. J. Graham, D. M. Rogers and D. E. Freedman, J. Am. Chem. Soc., 2016, 138, 1344–1348 CrossRef CAS PubMed.
- A. Fernandez, J. Ferrando-Soria, E. M. Pineda, F. Tuna, I. J. Vitorica-Yrezabal, C. Knappke, J. Ujma, C. A. Muryn, G. A. Timco, P. E. Barran, A. Ardavan and R. E. P. Winpenny, Nat. Commun., 2016, 7, 10240 CrossRef CAS PubMed.
- J. Ferrando-Soria, E. M. Pineda, A. Chiesa, A. Fernandez, S. A. Magee, S. Carretta, P. Santini, I. J. Vitorica-Yrezabal, F. Tuna, G. A. Timco, E. J. L. McInnes and R. E. P. Winpenny, Nat. Commun., 2016, 7, 11377 CrossRef CAS PubMed.
- M. J. Graham, C.-J. Yu, M. D. Krzyaniak, M. R. Wasielewski and D. E. Freedman, J. Am. Chem. Soc., 2017, 139, 3196–3201 CrossRef CAS PubMed.
- F. Luis, A. Repollés, M. J. Martínez-Pérez, D. Aguilà, O. Roubeau, D. Zueco, P. J. Alonso, M. Evangelisti, A. Camón, J. Sesé, L. A. Barrios and G. Aromí, Phys. Rev. Lett., 2011, 107, 117203 CrossRef CAS PubMed.
- Y. Morita, Y. Yakiyama, S. Nakazawa, T. Murata, T. Ise, D. Hashizume, D. Shiomi, K. Sato, M. Kitagawa, K. Nakasuji and T. Takeji, J. Am. Chem. Soc., 2010, 132, 6944–6946 CrossRef CAS PubMed.
- C. Schlegel, J. van Slageren, G. Timco, R. E. P. Winpenny and M. Dressel, Phys. Rev. B: Condens. Matter Mater. Phys., 2011, 83, 134407 CrossRef.
- L. Tesi, E. Lucaccini, I. Cimatti, M. Perfetti, M. Mannini, M. Atzori, E. Morra, M. Chiesa, A. Caneschi, L. Sorace and R. Sessoli, Chem. Sci., 2016, 7, 2074–2083 RSC.
- G. A. Timco, S. Carretta, F. Troiani, F. Tuna, R. J. Pritchard, C. A. Muryn, E. J. L. McInnes, A. Ghirri, A. Candini, P. Santini, G. Amoretti, M. Affronte and R. E. P. Winpenny, Nat. Nanotechnol., 2009, 4, 173 CrossRef CAS PubMed.
- C.-J. Yu, M. J. Graham, J. M. Zadrozny, J. Niklas, M. D. Krzyaniak, M. R. Wasielewski, O. G. Poluektov and D. E. Freedman, J. Am. Chem. Soc., 2016, 138, 14678–14685 CrossRef CAS PubMed.
- J. M. Zadrozny, J. Niklas, O. G. Poluektov and D. E. Freedman, J. Am. Chem. Soc., 2014, 136, 15841–15844 CrossRef CAS PubMed.
- J. M. Zadrozny, J. Niklas, O. G. Poluektov and D. E. Freedman, ACS Cent. Sci., 2015, 1, 488–492 CrossRef CAS PubMed.
- M. Atzori, L. Tesi, E. Morra, M. Chiesa, L. Sorace and R. Sessoli, J. Am. Chem. Soc., 2016, 138, 2154–2157 CrossRef CAS PubMed.
- D. P. DiVincenzo, Fortschr. Phys., 2000, 48, 771–783 CrossRef.
- M. Affronte, J. Mater. Chem., 2009, 19, 1731–1737 RSC.
- M. Eddaoudi, D. B. Moler, H. Li, B. Chen, T. M. Reineke, M. O'Keeffe and O. M. Yaghi, Acc. Chem. Res., 2001, 34, 319–330 CrossRef CAS.
- O. K. Farha and J. T. Hupp, Acc. Chem. Res., 2010, 43, 1166–1175 CrossRef CAS PubMed.
- H. Furukawa, K. E. Cordova, M. O'Keeffe and O. M. Yaghi, Science, 2013, 341, 1230444 CrossRef PubMed.
- J. L. C. Rowsell and O. M. Yaghi, Microporous Mesoporous Mater., 2004, 73, 3–14 CrossRef CAS.
- W. M. Bloch, A. Burgun, C. J. Coghlan, R. Lee, M. L. Coote, C. J. Doonan and C. J. Sumby, Nat. Chem., 2014, 6, 906 CrossRef CAS PubMed.
- C. K. Brozek and M. Dincă, J. Am. Chem. Soc., 2013, 135, 12886–12891 CrossRef CAS PubMed.
- P. Falcaro, R. Ricco, C. M. Doherty, K. Liang, A. J. Hill and M. J. Styles, Chem. Soc. Rev., 2014, 43, 5513–5560 RSC.
- M. I. Gonzalez, E. D. Bloch, J. A. Mason, S. J. Teat and J. R. Long, Inorg. Chem., 2015, 54, 2995–3005 CrossRef CAS PubMed.
- V. Stavila, A. A. Talin and M. D. Allendorf, Chem. Soc. Rev., 2014, 43, 5994–6010 RSC.
- C. Wang, D. Liu and W. Lin, J. Am. Chem. Soc., 2013, 135, 13222–13234 CrossRef CAS PubMed.
- C. L. Degen, F. Reinhard and P. Cappellaro, Rev. Mod. Phys., 2017, 89, 035002 CrossRef.
- A. Urtizberea, E. Natividad, P. J. Alonso, M. A. Andrés, I. Gascón, M. Goldmann and O. Roubeau, Adv. Funct. Mater., 2018, 1801695 CrossRef.
- T. Yamabayashi, M. Atzori, L. Tesi, G. Cosquer, F. Santanni, M.-E. Boulon, E. Morra, S. Benci, R. Torre and M. Chiesa, J. Am. Chem. Soc., 2018, 140, 12090–12101 CrossRef CAS.
- J. M. Zadrozny, A. T. Gallagher, T. D. Harris and D. E. Freedman, J. Am. Chem. Soc., 2017, 139, 7089–7094 CrossRef CAS PubMed.
- K. L. Cunningham, K. M. McNett, R. A. Pierce, K. A. Davis, H. H. Harris, D. M. Falck and D. R. McMillin, Inorg. Chem., 1997, 36, 608–613 CrossRef CAS.
- J. L. Du, K. M. More, S. S. Eaton and G. R. Eaton, Isr. J. Chem., 1992, 32, 351–355 CrossRef CAS.
- J.-L. Du, G. R. Eaton and S. S. Eaton, J. Magn. Reson., Ser. A, 1996, 119, 240–246 CrossRef CAS.
- S. P. Greiner, D. L. Rowlands and R. W. Kreilick, J. Phys. Chem., 1992, 96, 9132–9139 CrossRef CAS.
- P. Håkansson, T. Nguyen, P. B. Nair, R. Edge and E. Stulz, Phys. Chem. Chem. Phys., 2013, 15, 10930–10941 RSC.
- J. Shao, E. Steene, B. M. Hoffman and A. Ghosh, Eur. J. Inorg. Chem., 2005, 2005, 1609–1615 CrossRef.
- S. Stoll and A. Schweiger, J. Magn. Reson., 2006, 178, 42–55 CrossRef CAS.
- A. Schweiger and G. Jeschke, Principles of pulse electron paramagnetic resonance, Oxford University Press, Oxford, 2001 Search PubMed.
- S. S. Eaton and G. R. Eaton, in Distance measurements in biological systems by EPR, ed. L. J. Berliner, S. S. Eaton and G. R. Eaton, Kluwer Academic/Plenum Publishers, New York, 2000, ch. 2, pp. 29–154 Search PubMed.
- A. V. Astashkin and A. Schweiger, Chem. Phys. Lett., 1990, 174, 595–602 CrossRef CAS.
- J. J. L. Morton, A. M. Tyryshkin, A. Ardavan, K. Porfyrakis, S. A. Lyon and G. A. D. Briggs, Phys. Rev. A: At., Mol., Opt. Phys., 2005, 71, 012332 CrossRef.
- H. C. Torrey, Phys. Rev., 1949, 76, 1059 CrossRef.
- L. M. K. Vandersypen and I. L. Chuang, Rev. Mod. Phys., 2005, 76, 1037 CrossRef.
- W. Akhtar, T. Sekiguchi, T. Itahashi, V. Filidou, J. J. L. Morton, L. Vlasenko and K. M. Itoh, Phys. Rev. B: Condens. Matter Mater. Phys., 2012, 86, 115206 CrossRef.
- K. M. Salikhov, S. A. Dzuba and A. M. Raitsimring, J. Magn. Reson., 1981, 42, 255–276 CAS.
- S. S. Eaton and G. R. Eaton, in Distance Measurements in Biological Systems by EPR, ed. L. J. Berliner, S. S. Eaton and G. R. Eaton, Kluwer Academic/Plenum Publishers, New York, 2000, ch. 1, pp. 1–27 Search PubMed.
- D. T. Edwards, S. Takahashi, M. S. Sherwin and S. Han, J. Magn. Reson., 2012, 223, 198–206 CrossRef CAS PubMed.
- W. L. Hubbell, C. J. López, C. Altenbach and Z. Yang, Curr. Opin. Struct. Biol., 2013, 23, 725–733 CrossRef CAS PubMed.
- G. Jeschke, ChemPhysChem, 2002, 3, 927–932 CrossRef CAS PubMed.
- H. Chen, A. G. Maryasov, O. Y. Rogozhnikova, D. V. Trukhin, V. M. Tormyshev and M. K. Bowman, Phys. Chem. Chem. Phys., 2016, 18, 24954–24965 RSC.
- Y. Zhou, B. E. Bowler, G. R. Eaton and S. S. Eaton, J. Magn. Reson., 1999, 139, 165–174 CrossRef CAS PubMed.
- E. A. Harris and K. S. Yngvesson, J. Phys. C: Solid State Phys., 1968, 1, 990 CrossRef.
- M. Atzori, E. Morra, L. Tesi, A. Albino, M. Chiesa, L. Sorace and R. Sessoli, J. Am. Chem. Soc., 2016, 138, 11234–11244 CrossRef CAS PubMed.
- A. C. De Vroomen, E. E. Lijphart, D. Y. H. Prins, J. Marks and N. J. Poulis, Physica, 1972, 61, 241–249 CrossRef CAS.
Footnote |
| † Electronic supplementary information (ESI) available. CCDC 1871557. For ESI and crystallographic data in CIF or other electronic format see DOI: 10.1039/c8sc04435j |
| This journal is © The Royal Society of Chemistry 2019 |

