 Open Access Article
Theranostic nanocomposite from upconversion luminescent nanoparticles and black phosphorus nanosheets†
Solomon Tiruneh Dibabaa,
Ruoyan Weib,
Wensong Xic,
Lei Zhaob,
Liyi Shib,
Wei Ren *a,
Torsten Mayr
 d and
Lining Sun
 *ab
*ab
aPhysics Department, International Centre for Quantum and Molecular Structures, Shanghai University, Shanghai 200444, China. E-mail: renwei@shu.edu.cn
bResearch Center of Nano Science and Technology, School of Material Science and Engineering, Shanghai University, Shanghai 200444, China. E-mail: lnsun@shu.edu.cn
cInstitute of Nanochemistry and Nanobiology, Shanghai University, Shanghai 200444, China
dApplied Sensors, Institute of Analytical Chemistry and Food Chemistry, Graz University of Technology, 8010 Graz, Austria
First published on 19th October 2018
Abstract
An anti-cancer campaign might not be easily achieved through a single therapeutic modality. Collaboration of multimodal therapies and diagnosis could be vital to win the battle against cancer. In this context, we synthesized a multifunctional theranostic nanocomposite (UCNP–BPNS) from upconversion nanoparticles (UCNP) and black phosphorus nanosheets (BPNS) for synergistic photothermal/photodynamic therapies in vitro and dual modal imaging. Core–shell UCNP (NaYF4:Yb,Er@NaGdF4) and BPNS were synthesized using solvo-thermal and liquid exfoliation methods, respectively, and then covalently conjugated after UCNP was modified with polyacrylic acid and BPNS with methoxypolyethylene glycol amine. The experimental results validate that the nanocomposite exhibited a good photothermal therapy (PTT) effect under 808 nm laser irradiation, endorsing the apparent heat conversion effect of BPNS. Besides, a very good photodynamic therapy (PDT) effect was achieved under 980 nm laser irradiation of the nanocomposite due to Förster resonance energy transfer from UCNP to BPNS that generated singlet oxygen (1O2). The synergistic PTT/PDT therapeutic effect provided by UCNP–BPNS under simultaneous 808 and 980 nm laser irradiation was significantly higher than either PTT or PDT alone. Furthermore, due to the merit of the outer shell coated on the surface of the core of UCNP, the nanocomposite exhibited good potential for magnetic resonance and upconversion luminescence imaging. These results demonstrated that our multifunctional nanocomposite has promising theranostic efficacy under near infrared laser irradiation.
1 Introduction
Cancer is one of the serious global health problems that needs careful and efficient methods of diagnosis and therapy.1 Research in the field of nanotechnology recently introduced some promising theranostic nanomedicines that combine therapeutic and imaging components into one single nanoplatform.2–9 Theranostic nanomedicines provide real-time image guided disease diagnosis and assessment of treatment efficacy. Compared to traditional one-modal therapy which has many disadvantages such as system and organ toxicity, poor bioavailability and impaired target specificity, multi-modal therapy showed promising effects in cancer treatment because of its high efficiency and low risk of cancer recurrence. To date, phototherapy, which is the combination of photodynamic therapy (PDT) and photothermal therapy (PTT), has been a hot area of research due to its excellent therapeutic results with comparably less toxic side effects for the treatment of cancer. Both PDT and PTT are selective therapeutic methods in which light of appropriate wavelength was illuminated onto specific regions of cancer cells or a target area without affecting the nearby normal tissues.PDT is a less invasive method of treatment that involves three essential components which are light source, nontoxic photosensitizer (PS) and tissue oxygen.10,11 Appropriate wavelength of light source is needed to excite the PS from ground state to its higher energy state so that it transfers energy to the nearby oxygen or other substance to generate reactive oxygen species (ROS) such as singlet oxygen (1O2). The singlet oxygen generated in the process of PDT can only interact with the proximal molecules and structures within a target area causing selective damage and death of the cancer cells without affecting the neighboring normal tissues.11 Most of the PS molecules that have been used for PDT usually are excited by visible or UV light, which have low penetration depth in biological tissues.12,13 This is hindering factors to treat deep cancer using PDT method. One of the strategies that have been developed recently to overcome this problem is combining PS with near-infrared (NIR) light excited upconversion nanoparticles (UCNP).12,14–16 To date, UCNP have become attractive nanostructures for numerous applications, including PDT and PTT in anti-cancer treatment because of their unique optical properties such as narrow bandwidth emission, large anti-stokes shifts, high chemical and photostability, a long fluorescence lifetime, non-blinking, high signal-to-background ratio (SBR), deeper tissue penetration with less photo-damage to biological samples, and low toxicity.17–19 UCNP can absorb NIR (up to 980 nm) light, which matches with optical transmission window of tissues (700–1000 nm), and emit high energy photon such as visible or UV light that can be transferred to PS for PDT application.20 In order to obtain efficient energy transfer from UCNP to PS, the PS should be connected to UCNP as close as possible and the absorption of PS should overlap well with the emission of UCNP. The PS chosen for PDT should also be non-toxic to the cells in the absence of light.
PTT is another non-invasive light induced method of cancer treatment that required appropriate photothermal agents (PTA) which converts electromagnetic radiation, actually NIR light, into heat energy.21–23 The heat energy increases body temperature of irradiated area of a tumor above normal so that it destroys the malignant tumors. Cancer cell death without causing serious injury to the nearby tissues can be achieved in the temperature range of 41–45 °C.24
Several PTA and PS such as metal nanoparticles,25 organic materials,26,27 carbon complex28 and semiconductors were widely investigated so far. However, few layers black phosphorus (BP) is a recently emerged (in 2014, 100 years after the first synthesize of bulk phosphorus)29,30 semiconducting material that has got considerable attention for biomedical application such as PTT, PDT and drug delivery because of its unique properties. It has layer dependent tunable direct band gap ranging from 0.3 eV (for bulk) to 2.0 eV (for monolayer) that allows broad absorption band from ultraviolet to near infrared.31,32 Besides these excellent optical merits, BP has several unique properties such as weak interlayer van der Waals force so that it can be easily exfoliated into monolayer or few layers,33 high charge carrier mobility (∼1000 cm2 V−1 s−1),34,35 high in-plane anisotropy.30,36 The degradation of small sized BP nanosheet in aqueous solution produces phosphate and phosphonate that have no long-term toxicity as compared to metal nanoparticles and quantum dots. These are some of essential values that make black phosphorus most preferred candidates over other two-dimensional (2D) materials for biomedical and other electronic applications. However, very few works have been reported about the application of black phosphorus based nanomaterials for cancer therapy. For instance, Sun et al. recently reported good performance of black phosphorus quantum dot (BPQD) for PTT application37 and they also confirmed the biocompatibility of BP by examining cytotoxicity of the BPQD to different types of cancer cells. According to a very recent report, BP nanosheets can be utilized for PDT and drug delivery.38,39 Yang and Lin et al. also combined Au-nanoparticles with black phosphorus nanosheets for synergistic PTT/PDT application,40 and they utilized BP nanosheets as PS to generate ROS. Moreover, great potential of BP nanosheets as neuroprotective nanomedicine for neurodegenerative disorder therapy was also documented.41
Though black phosphorous possesses attractive optical and electronic properties, utilization of this smart element for theranostic nanomedicines has been largely unexplored. Herein we proposed multifunctional theranostic nanocomposite from UCNP and black phosphorus nanosheets (BPNS) for synergistic photothermal and photodynamic therapies and dual modal imaging. We successfully synthesized BPNS using liquid exfoliation method,42 and NaYF4:Yb,Er@NaGdF4 core–shell (UCNP) with high upconversion luminescence intensity using solvo-thermal method. Our final nanocomposite denoted as UCNP–BPNS was obtained by combining methoxypolyethylene glycol amine (PEG-NH2) modified BPNS and polyacrylicacid (PAA) modified UCNPs via covalent bond formed between the carboxyl group of PAA and amine group of PEG-NH2. The modification of BPNS with PEG-NH2 was not only used for covalent conjugation but also reducing the instability of BPNS in physiological environment. We utilized all advantages offered by the shell (NaGdF4) of UCNPs, such as the T1 weighted magnetic resonance (MR) imaging due to paramagnetic Gd3+ dopant ion, and enhancement of the upconversion luminescence intensity under 980 nm excitation due to the reduced surface quenching of UCNP core. Under 808 nm NIR laser irradiation of UCNP–BPNS, the BPNS can convert light energy obtained from the laser directly to heat energy exhibiting the PTT, whereas under 980 nm NIR laser irradiation, UCNP converts the laser energy into high energy luminescence in visible ranges and denotes some energy to BPNS via Förster resonance energy transfer (FRET) and hence ROS is generated to kill cancer cells by the PDT effect. Furthermore, the enhanced upconversion luminescence of UCNP in the visible regions (green and red) which was not transferred to BPNS can be used for upconversion luminescence (UCL) imaging. Altogether, our BP based multifunctional nanocomposite effectively combines therapy with diagnosis in a single nanoplatform via synergistic PDT/PTT and dual modal imaging (MR and UCL) under NIR laser excitation.
2 Experimental section
2.1 Materials
The chemical reagents used in the experiment were of analytical grade and used without further purification. YCl3·6H2O (99.99%), YbCl3·6H2O (99.99%), ErCl3·6H2O (99.99%), GdCl3·6H2O (99.99%), oleic acid (OA, 90%), 1-octadecene (ODE, 90%), sodium hydroxide (NaOH), ammonium fluoride (NH4F), black phosphorus (BP) crystal, and ethanol (EtOH) were purchased from Sigma-Aldrich Co. Ltd. Methyl-2-pyrrolidinone (NMP), methoxypolyethylene glycol amine (H2NCH2CH2(OCH2CH2)nOCH3, PEG-NH2, 2000 MW), polyacrylicacid ((C3H4O2)n, PAA, 1800 MW), 1-[3-(dimethylamino)propyl]-3-ethylcarbodiimide hydrochloride (EDC), N-hydroxysuccinimide (NHS), diethylene glycol (DEG), and 1,3-diphenylisobenzofuran (DPBF) were purchased from Aladdin industrial corporation. WST-8 cell counting kit (CCK-8), D-hanks solution and live/dead identifying kit were obtained from Dojindo Molecular Technologies, Gibco Inc. and Invitrogen respectively. Deionized water was used wherever water is needed.2.2 Synthesis of PAA modified upconversion nanoparticles (UCNP-PAA)
The core upconversion nanoparticles (NaYF4:Yb,Er) were first synthesized according to the previous methods with some modifications.43,44 The synthesized nanoparticles was precipitated with acetone and washed with ethanol twice using centrifugation, and re-dispersed in 20 mL cyclohexane. The core–shell nanoparticles (NaYF4:Yb,Er@NaGdF4) was also synthesized according to the previous methods.45,46 The resulting nanoparticles, denoted as UCNP, were precipitated by acetone and washed with ethanol twice via centrifugation, and then re-dispersed in 10 mL cyclohexane. The surface of these OA-capped core–shell nanoparticles (UCNP) was then modified by hydrophilic PAA using a general ligand exchange method reported before with some modification.47,48 Briefly, 600 mg PAA and 30 mL DEG were mixed in 100 mL round bottom flask and then heated to 110 °C with vigorous stirring under argon environment. At this 110 °C, 8 mL of OA-capped NaYF4:Yb,Er@NaGdF4 was injected to the solution and further heated to 240 °C for 6 h. After it was cooled to room temperature, the PAA modified core–shell nanoparticles denoted as UCNP-PAA were precipitated by ethanol. The precipitates were collected through centrifugation and washed three times with ethanol and ultrapure water, and then dispersed in ultrapure water for future use.2.3 Synthesis of black phosphorus nanosheets (BPNS)
The black phosphorus nanosheets, denoted as BPNS, were synthesized using a simple liquid exfoliation method according to previously reported protocol with little modification.39,42,49 Typically, bulk black phosphorus was grinded and then 30 mg of the powder was dispersed in 30 mL of NMP. The mixture was sonicated with a sonic tip for 2 h. The resulting solution was further sonicated in ultrasonic ice/water bath for 8 h at the power of 300 W. After the solution was centrifuged for 10 min at 8000 rpm, the supernatant was decanted gently and further centrifuged at 12![[thin space (1/6-em)]](https://www.rsc.org/images/entities/char_2009.gif) 000 rpm for 20 min to obtain the precipitate. The precipitate was dispersed in ultrapure water for immediate modification of PEG.
000 rpm for 20 min to obtain the precipitate. The precipitate was dispersed in ultrapure water for immediate modification of PEG.
2.4 Synthesis of PEG modified black phosphorus nanosheets (BPNS-NH2)
The surface of negatively charged BPNS was modified with positively charged PEG-NH2 via electrostatic force using previously reported procedures with some modification.39 Briefly, as prepared BPNS dispersed in deionized water was mixed with 20 mg of PEG-NH2 and then ultrasonicated for 30 min followed by stirring for 4 h under ice/water bath. After excess PEG-NH2 was removed by three times centrifugation at 12![[thin space (1/6-em)]](https://www.rsc.org/images/entities/char_2009.gif) 000 rpm for 10 min, then resulting in the PEG modified BPNS, named as BPNS-NH2 was dispersed in deionized water for further use.
000 rpm for 10 min, then resulting in the PEG modified BPNS, named as BPNS-NH2 was dispersed in deionized water for further use.
2.5 Combination of UCNP-PAA with BPNS-NH2 (denoted as UCNP–BPNS)
PAA modified UCNP and PEG modified BPNS were covalently conjugated via the reaction between the carboxyl group (–COOH) of the PAA ligand in UCNP-PAA and the –NH2 of PEG in BPNS-NH2. Typically, as synthesized PAA modified UCNP in 30 mL of deionized water were mixed with 10 mg of EDC and 6 mg of NHS and then stirred for 12 h to activate the PAA. After that, the BPNS-NH2 in deionized water was added and further stirred for 6 h. Finally the UCNP–BPNS were obtained through centrifugation and dispersed in deionized water for the next use.2.6 Instruments and devices used for characterizations
Transmissions electron microscopy (TEM) and high resolutions transmission electron microscopy (HRTEM) images of NaYF4:Yb,Er, UCNP, UCNP-PAA, BPNS, and UCNP–BPNS were taken using JEM-2100F normal and high resolution transmission electron microscope operated at 120 kV. Thermo Nicolet 6700 spectrometer with KBr pellet was used to obtain Fourier transform infrared spectra (FT-IR) for different wavenumbers, ranging from 4000 to 400 cm−1. Edinburgh FS5 fluorescence spectrometer operated at CW laser 980 nm was used to get UCL spectra of the corresponding nanocomposite. Shimadzu UV-2500PC ultraviolet-visible spectrometer was utilized to get UV-vis spectra. Potentiometric Analyzer Zetasizer 3000HS interfaced with computer was used to obtain zeta potential. For investigation of photothermal effect, 808 nm CW laser that has 5 mm laser component with controllable power was utilized. Inductively coupled plasma atomic emission spectroscopy (ICP-AES) was utilized to know the concentrations of Gd3+. A microplate reader was used to investigate viability of the HeLa cells via measurement of optical density (OD) of all the 96-wells used in the experiment at wavelength of 450 nm. Fluorescence microscope, DMI3000, was used to identify the live and dead cells. A Nikon multiple charge-coupled device (CCD) was used to detect UCL images of the HeLa cells via confocal laser scanning microscope (CLSM).2.7 Laser-induced photothermal therapy (PTT) effects
To evaluate PTT effect of our samples, 1 mL aqueous solution of UCNP–BPNS sample with different concentrations (100, 200, and 400 μg mL−1) were irradiated by 808 nm continuous wave laser with power density of 1.5 W cm−2, and the temperature changes of the aqueous solution of the sample for each of the selected concentrations were recorded every 20 seconds using a digital thermometer.2.8 Singlet oxygen detection
To investigate singlet oxygen generation efficiency of our samples (UCNP–BPNS), we used DPBF which can be oxidized in the presence of singlet oxygen, and hence reduce its absorption peak at around 410 nm.3,50 In brief, 30 μL of ethanol solution of DPBF (10 mM) was added to 2 mL of UCNP–BPNS solution and then irradiated with 980 nm laser at power density of 0.5 W cm−2 in dark. Finally the UV-vis absorption spectra of the resulting solutions (UCNP–BPNS mixed with DPBF) were taken for different irradiation time. The intracellular singlet oxygen level was detected using 2′,7′-dichlorofluorescin diacetate (DCFH-DA) according to the previous report.51 Briefly, HeLa cells were plated in 6-well plates (1.5 × 10⁵ cells per well) and cultured overnight. After the cells were exposed to UCNP–BPNS (1 mg mL−1) for 4 h, they were washed with D-Hanks solution and 10 μM DCFH-DA was added to 1 mL new culture medium and incubated for 30 min then rinsed three times with D-Hanks solution. After that, the cells were irradiated with 980 nm NIR lasers for 6 min with the pump power of 0.5 W cm−2. The blank well without irradiation was also detected as the control. The fluorescence images were recorded at an irradiation wavelength of 488 nm.2.9 In vitro cytotoxicity assay
In order to confirm the biocompatibility of our sample, cytotoxicity assay was performed to investigate the viability of HeLa cells incubated with different concentrations of UCNP–BPNS. The HeLa cells were maintained in high glucose Dulbecco's Modified Eagle's medium (DMEM, 4.5 g L−1 glucose) supplemented with 10% FBS and 1% penicillin/streptomycin at 37 °C in an atmosphere of 5% CO2/95% air. Briefly, HeLa cells in 100 μL culture medium were seeded into 96-well plates at density of 5000 cells per well and grown overnight. Then, the medium was removed and 200 μL of fresh culture medium containing UCNP–BPNS nanocomposite at different concentrations (0, 50, 100, 200, 400, 800 μg mL−1) was introduced to the cells for 24 h at 37 °C under 5% CO2/95% air. After removing the culture medium, CCK-8 solution (100 μL, containing 10% CCK-8) was added to each well and incubated for 1.5 h. The viability of the HeLa cells was measured by a microplate reader at the wavelength of 450 nm. The cell viability (% of control) is expressed as the percentage of (ODtest − Oblank)/(ODcontrol − ODblank), where ODtest is the OD of the cells exposed to UCNP–BPNS, ODcontrol is the OD of the control, and ODblank is the OD of the well without cells. All of the tests were independently performed six times. After confirmation of the biocompatibility of the sample, the cells incubated with different concentration (100, 200, 400 μg mL−1) of UCNP–BPNS for 4 h were irradiated with 808 nm laser at a power density of 1.5 W cm−2 for 30 min (10 min break after each 10 min irradiation), 980 nm laser at a power density of 0.5 W cm−2 for 6 min (2 min break after each 2 min irradiation) and simultaneously irradiated with both 808 nm and 980 nm laser to investigate PTT, PDT, and synergistic PTT/PDT effect of UCNP–BPNS, respectively. For comparison, the control group (HeLa cells without UCNP–BPNS) was also irradiated with 808 nm laser at power density of 1.5 W cm−2 for 30 min (10 min break after each 10 min irradiation) plus 980 nm laser at power density of 0.5 W cm−2 for 6 min (2 min break after each 2 min irradiation). After the laser treatment, the cells in each group were further incubated for 24 h. After that, the culture medium was removed, and CCK-8 solution (100 μL, containing 10% WST-8) was added to each well. After incubation of the cells for additional 1.5 h, the optical density of wells was measured by a microplate reader at the wavelength of 450 nm. Finally, the cell viability (% of control) of each experimental group treated with NIR laser, as discussed above, was obtained.2.10 Live/dead staining of HeLa cells after exposure to UCNP–BPNS nanocomposite
A live/dead cell assay was performed to image cells treated with the 400 μg mL−1 of UCNP–BPNS nanocomposite by staining the live and dead cells with the mixture of calceinacetoxymethyl (calcein AM) and propidium iodide (PI), which can differentiate live (green, excitation wavelength: 495 nm; emission: 515 nm) cells from dead (red, excitation wavelength: 535 nm; emission: 617 nm) cells. Cells were treated with different protocols as described in Section 2.9 above. After 24 h of incubation, the culture medium was removed and the cells were washed with D-hanks. Then, the cells were incubated with the mixture of dyes dissolved in D-hanks for 30 min at room temperature in the dark. Later, the excess dye was removed and the cells were washed carefully with D-hanks. Finally, 100 μL of D-hanks solution was added to each well, and the cells were investigated under a fluorescence microscope.2.11 Upconversion luminescence imaging in vitro
Upconversion luminescence imaging of HeLa cells was performed using confocal laser scanning microscopy (CLSM). Briefly, HeLa cells were planted in Petri dishes overnight. After washing the cells three times with PBS buffer, the cells were incubated in a serum-free medium with 400 μg mL−1 UCNP–BPNS solution for 4 h at 37 °C under 5% CO2. After that, the cells were washed with PBS to remove excess nanoparticles. Finally, CLSM imaging of the HeLa cells was taken under 980 nm laser irradiation with power of 500 mW. The upconversion luminescence (UCL) emissions of green and red luminescence from UCNP–BPNS were collected at 500–600 nm and 600–700 nm channels, respectively.2.12 Magnetic resonance (MR) imaging
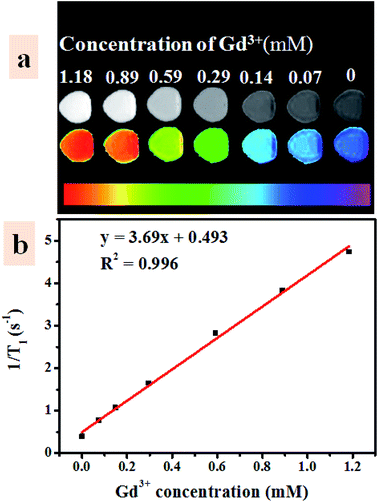
To measure T1-weighted MR imaging obtained from Gd3+ dopant ion, 1 mL aqueous solution of UCNP–BPNS with different concentration of Gd3+ was added to 2 mL plastic centrifuge tube, and then longitudinal relaxation time T1 of the sample at various concentration of Gd3+ was measured using MR imaging instrument with 3.0T magnetic fields. Longitudinal relaxivity (r1) was determined by fitting the inverse of relaxation time (1/T1) versus the concentrations of Gd3+ graph.3 Result and discussion
3.1 Synthesis and characterizations of UCNP–BPNS
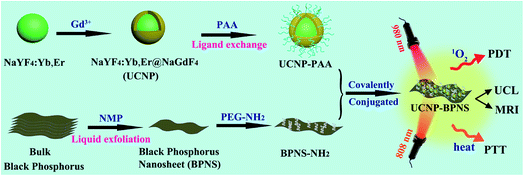
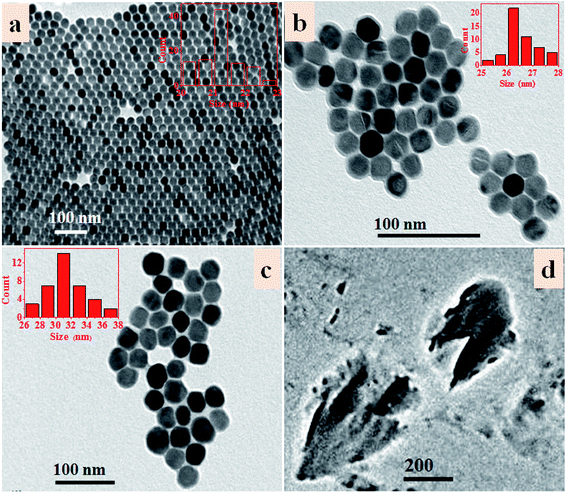
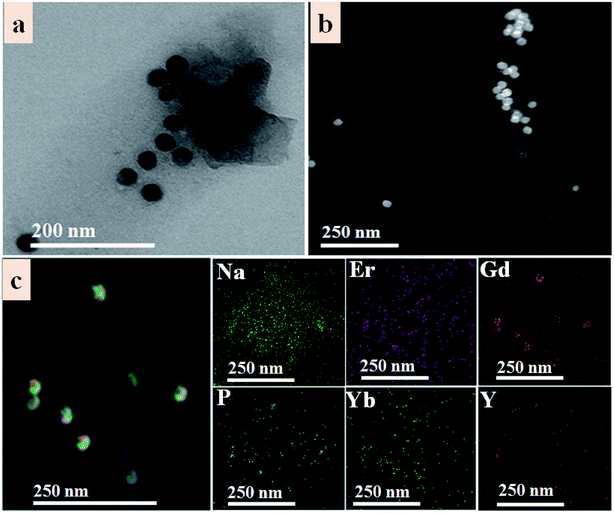
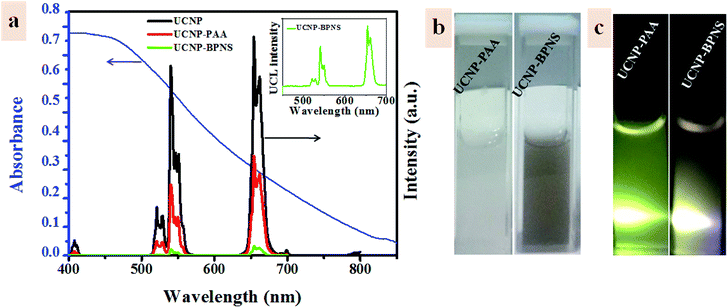
Scheme 1 is an illustration of the synthesis of PAA modified upconversion nanoparticles (UCNP-PAA), PEG-NH2 modified black phosphorus nanosheets (BPNS-NH2), and their covalent combination to obtain the final UCNP–BPNS nanocomposite. Transmission electron microscope (TEM) images of as synthesized upconversion nanoparticles, PEG-NH2 modified BPNS, and UCNP–BPNS nanocomposite were measured. Fig. 1a and b show the TEM images of OA-capped core (NaYF4:Yb,Er) and core–shell nanoparticles (NaYF4:Yb,Er@NaGdF4, denoted as UCNP) dispersed in cyclohexane, respectively. The lattice fringes of UCNP shown by HRTEM in Fig. S1† indicate that the core–shell nanoparticles have hexagonal crystal structure. The surface of the hydrophobic core–shell (UCNP) were modified by PAA using ligand exchange method to obtain hydrophilic nanoparticles denoted as UCNP-PAA, as depicted in Fig. 1c. The TEM images and the corresponding insets of as synthesized nanoparticles illustrated that the core, core–shell, and UCNP-PAA, are highly monodispersed and spherically shaped with diameters of around 21 nm, 26 nm, and 31 nm, respectively. The 5 nm difference between the diameter of the core and core–shell nanoparticles displays the successful growth of NaGdF4 shell. The TEM image of PEG-NH2 modified BPNS shown in Fig. 1d clearly reveals that free stand BPNS was synthesized successfully via liquid exfoliation method.The TEM image displayed in Fig. 2a and scanning transmission electron microscope (STEM) in Fig. 2b of UCNP–BPNS nanocomposite clearly show the successful combination of BPNS-NH2 and UCNP-PAA via covalent bond formed between the carboxyl group of PAA and amine group of PEG-NH2. Furthermore, the TEM and STEM images of UCNP–BPNS demonstrated that the average size of the nanocomposite is around 170 nm that can be used for further in vitro experiment. Besides, the dynamic light scattering (DLS) measurement shown in Fig. S2† indicates that the size of UCNP–BPNS is around 289.5 nm. To know about the size of nanocomposite in biological media, we measured the DLS size of UCNP–BPNS dispersed in phosphate buffer saline (PBS). As shown in Fig S3,† the DLS size of the nanocomposite is around 360 nm in PBS. Elemental mapping of UCNP–BPNS shown in Fig. 2c and Fourier transform-infrared (FT-IR) spectra of UCNP, UCNP-PAA, and UCNP–BPNS displayed in Fig. S3† further confirm the successful combination of UCNP and BPNS. The 2930 cm−1 and 2861 cm−1 peaks in UCNP curve represent the symmetric and asymmetric stretching vibration of methylene (–CH2) in the long alkyl chain of OA ligand found on the surface of UCNP, and the other two peaks indicated in the curve, 1568 cm−1 and 1461 cm−1, are associated to the symmetric and asymmetric stretching vibration of carboxyl group (–COOH) of the OA, respectively. However, after surface modification with PAA relatively stronger peaks associated to symmetric and asymmetric stretching vibration of carboxylic group are formed at 1724 cm−1 and 1564 cm−1 as displayed in UCNP-PAA curve. Besides, the peak at 2861 cm−1 associated to asymmetric stretching vibration of CH2 is almost disappeared after PAA modification. In addition, the reduction of UCL spectrum of UCNP after PAA modification shown in Fig. 3a also suggests the modification of UCNP with PAA. Based on these result, it can be deduced that the UCNPs are successfully modified with PAA. In Fig. S4,† the appearance of peak at 1400 cm−1 in curve of UCNP–BPNS that corresponds to the –NH2 group shows that the successful modification of BPNS with PEG-NH2, yet not all the –NH2 group on the BPNS were combined with the –COOH group of UCNP-PAA. However, the peak at 809 cm−1 attributed to –CO–NH– group bears out the combination of BPNS-NH2 with UCNP-PAA, demonstrating the successful synthesis of final UCNP–BPNS nanocomposite.39 Besides, the changes of zeta potential of UCNP-PAA (−14 mV), BPNS-NH2 (−2 mV), and UCNP–BPNS (−9 mV) shown in Fig. S5† further confirm the formation of the final nanocomposite. Furthermore, the stabilities of PEG-NH2 modified BPNS (BPNS-NH2) and UCNP–BPNS were also investigated by dispersing BPNS-NH2 and UCNP–BPNS in water for different time (up to 14 days) in ambient environment and taking the corresponding UV-vis absorption spectra. As depicted in the UV-vis absorption spectra of BPNS-NH2 (Fig. S6a†) and the nanocomposite (Fig. S6b†) in water during two weeks, the BPNS-NH2 and nanocomposite exhibit good stability. This is mainly because BPNS was modified by using PEG-NH2, which helps to reduce the degradability of BPNS and affords the good stability of UCNP–BPNS nanocomposite.
Fig. 3a shows the upconversion luminescence spectra of UCNP, UCNP-PAA, and UCNP–BPNS under excitation of 980 nm continuous wave (CW) laser and visible absorption spectrum of BPNS in water. The three characteristics band at 521 nm, 540 nm, and 654 nm are attributed to 2H11/2 → 4I15/2, 4S3/2 → 4I15/2 and 4F9/2 → 4I15/2 transitions of Er3+ ion, respectively. Reduction of upconversion luminescence of all the three bands exhibited in UCNP–BPNS sample is related to the FRET from UCNPs to BPNS that can be used to excite the photosensitizer (BPNS) for the generation of singlet oxygen (1O2) that is served for PDT effect. This is due to the good absorption of BPNS in the visible spectral range that overlaps with the green and red emission of UCNP, as shown in Fig. 3a. Even though the luminescence intensity of UCNP–BPNS decreased after the combination of UCNP and BPNS due to the FRET, the magnified UCL spectrum of UCNP–BPNS depicted in the inset of Fig. 3a reveals that there is still upconversion luminescence in the visible range (green and red), endorsing the potential of the nanocomposite for UCL-imaging. The bright field photographs of UCNP-PAA and UCNP–BPNS dispersed in water (Fig. 3b, from left to right) and their corresponding photographs under 980 nm laser irradiation (Fig. 3c) show that after the formation of nanocomposite, the UCNP–BPNS with deep colour still display UCL.
3.2 Photothermal therapy (PTT) effect
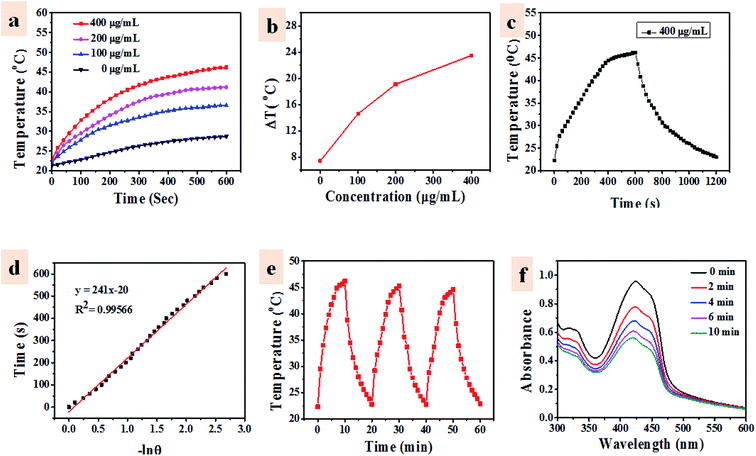
The PTT effect of UCNP–BPNS was investigated by measuring temperature elevation of aqueous solution of UCNP–BPNS at different concentration under continuous 808 nm laser irradiation with power density of 1.5 W cm−2 for 30 min (10 min break after every 10 min irradiation). As depicted in Fig. 4a, the temperature elevation profile is concentration dependent. This concentration dependent temperature enhancement is displayed in Fig. 4b using temperature increment (ΔT) versus concentration curve. ΔT monitored for 100, 200, and 400 μg mL−1 concentrations were 14.6 °C, 19.1 °C, and 23.5 °C after 10 min irradiation, respectively. However, no apparent temperature change was observed in pure water. In addition, the infrared thermal images shown in Fig. S7† give visual confirmation of concentration dependent photo-induced hyperthermia of the nanocomposite. Nearly stable and highest temperature was obtained when the highest concentration of UCNP–BPNS (400 μg mL−1) irradiated with 808 nm laser (1.5 W cm−2) for 10 min, confirming the result described in Fig. 4a. Photothermal conversion efficiency (η) of UCNP–BPNS was calculated according to previously reported method using the following equation52where h is the coefficient of heat transfer, A is surface area of the container, ΔTmax is the maximum temperature change of UCNP–BPNS dispersed in 1 mL of water at concentration of 400 μg mL−1. I is the power density of the laser, A808 is the absorbance of UCNP–BPNS dispersed in water at 808 nm, and QL is the heat lost due to light absorbance of the water.
Linear fit of cooling time data (after 600 s) verses negative natural logarithm of driving force temperature (−ln![[thin space (1/6-em)]](https://www.rsc.org/images/entities/char_2009.gif) θ) shown in Fig. 4d was obtained from the data in Fig. 4c hA was determined using the time constant for the heat transfer of our nanocomposite which is the slope of the liner fit of the cooling period vs. −ln
θ) shown in Fig. 4d was obtained from the data in Fig. 4c hA was determined using the time constant for the heat transfer of our nanocomposite which is the slope of the liner fit of the cooling period vs. −ln![[thin space (1/6-em)]](https://www.rsc.org/images/entities/char_2009.gif) θ shown in Fig. 4d. Accordingly, the photothermal conversion efficiency of the nanocomposite (UCNP–BPNS) calculated using eqn (1) is 29.1%.
θ shown in Fig. 4d. Accordingly, the photothermal conversion efficiency of the nanocomposite (UCNP–BPNS) calculated using eqn (1) is 29.1%.
Based on these results, 400 μg mL−1 concentrations of UCNP–BPNS and 10 min laser irradiation time were chosen for the next cytotoxicity assessment. Furthermore, the photothermal stability was investigated by naturally cooling aqueous solution of the nanocomposite (UCNP–BPNS) at the highest concentration (400 μg mL−1) for 10 min after every 10 min continuous 808 nm laser irradiation. Almost similar maximum temperatures were maintained in all three cycles of ON and OFF (heating and cooling) process as shown in Fig. 4e, suggesting excellent photothermal stability of UCNP–BPNS.
3.3 Photodynamic therapy (PDT) effect
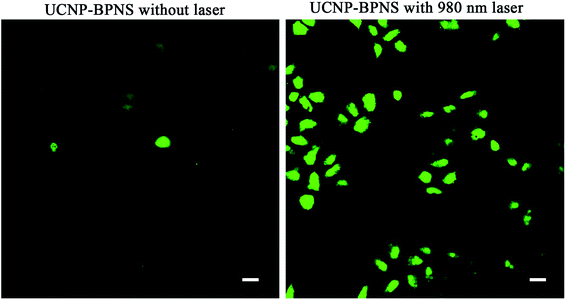
PDT effect is directly related to generation of reactive oxygen species (ROS) such as singlet oxygen (1O2), which is cytotoxic to cells.53 In this case, DPBF was used as fluorescent reagent to detect singlet oxygen (1O2) generation of UCNP–BPNS. Under irradiation of 980 nm laser, the upconverted energy of UCNP was transferred to BPNS via FRET, hence 1O2 that oxidized DPBF was generated. This was confirmed by irradiating 2 mL of aqueous solution of UCNP–BPNS mixed with 30 μL of ethanol solution of DPBF (10 mM) under CW 980 nm laser irradiation for different irradiation time (0–10 min) in dark. As illustrated in Fig. 4f, UV-vis absorption band of DPBF at the wavelength of 410 nm decreases with irradiation time prolonging. The result demonstrates that the generation of 1O2 that degrades the DPBF was enhanced with the increased irradiation time. The intercellular singlet oxygen generation were also investigated using DCFH-DA. As compared to HeLa cells treated with only the nanocomposite (UCNP–BPNS) and DCFH-DA without laser, the HeLa cells treated with UCNP–BPNS and DCFH-DA with 980 nm laser irradiation for 6 min shows bright green luminescence, which is attributed to oxidization of DCFH-DA to dichlorofluorescein (DCF) due to the intercellular singlet oxygen generation, as depicted in Fig. 5. It can be deduced that the nanocomposite has excellent potential of generating singlet oxygen for PDT effect.3.4 Cytotoxicity in vitro
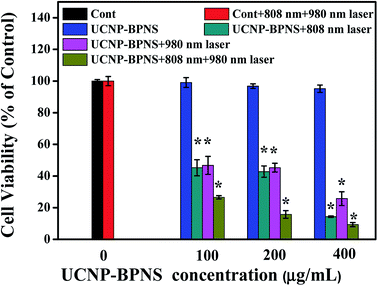
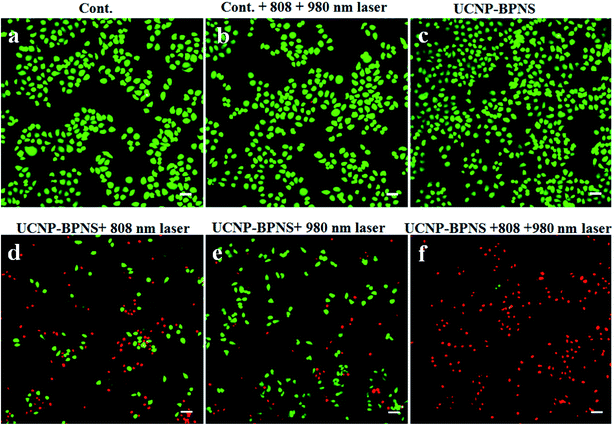
Encouraged by good PTT and PDT effect of the nanocomposite in aqueous solution mentioned above, the cytotoxicity assessment in vitro was performed using HeLa cells. First, the biocompatibility of the nanocomposite (UCNP–BPNS) was confirmed by investigating viability of HeLa cells exposed to UCNP–BPNS solution at concentrations of 50, 100, 200, 400, and 800 μg mL−1. As exhibited in Fig. S8,† the viabilities of HeLa cells incubated with even highest concentration (800 μg mL−1) of UCNP–BPNS for 24 h were almost 100%, indicating the high biocompatibility of UCNP–BPNS. In addition, to investigate the heating effect of 980 nm laser in this case, the viabilities of HeLa cells with 980 nm laser irradiation (power density of 0.5 W cm−2 for 6 min, 2 min breaks after every 2 min irradiation) and control group without laser irradiation were measured. There is no significant difference of cytotoxicity of HeLa cells between with 980 nm laser irradiation and without as shown in Fig. S9.† This is indicating that there is no heating effect of 980 nm laser in this case. Then five groups of HeLa cells were seeded in a 96-well plate with density of 5000 cells per well and cultured in 5% CO2/95% air at 37 °C for 24 h. As illustrated in Fig. 6, the HeLa cells in the first group were kept untreated as a control group. The cells in the second group were irradiated with 808 nm laser with power density 1.5 W cm−2 for 30 min (10 min breaks after every 10 min irradiations) plus 980 nm laser with power density of 0.5 W cm−2 for 6 min (2 min breaks after every 2 min irradiation to minimize heating effect). Cells in the third group were exposed to UCNP–BPNS with different concentration (100, 200, and 400 μg mL−1) for 4 h and irradiated with only 808 nm laser with 1.5 W cm−2 power density for 30 min (10 min breaks after every 10 min irradiations) to investigate the PTT effect of our nanocomposite. Cells in the fourth group were also exposed with similar concentration of UCNP–BPNS for 4 h and irradiated with only 980 nm laser with power density of 0.5 W cm−2 for 6 min (2 min breaks after every 2 min irradiation) to assess the PDT effect of the nanocomposite. Cells in the fifth group were also treated with the same concentrations of UCNP–BPNS for 4 h and irradiated with 808 nm laser with 1.5 W cm−2 power density for 30 min (10 min breaks after every 10 min irradiations) plus 980 nm laser with power density of 0.5 W cm−2 for 6 min (2 min breaks after every 2 min irradiation) to examine the synergistic PTT/PDT effect of the nanocomposite. The viabilities of HeLa cells in all the five groups were summarized in Fig. 6. The result indicated that there were no obvious change of viability of HeLa cell in group two as compared to the viability of HeLa cells in the control group (group one). This reveals that the laser irradiation alone cannot affect the viability of the cells. For the cells in group three, the viability significantly decreased with increase of the concentration of UCNP–BPNS. At the highest concentration (400 μg mL−1) about 85% of the HeLa cells were killed, validating the apparent PTT effect of the nanocomposite. Similarly, viability of cells in the fourth group also reduced with the increased concentration of the nanocomposite; nearly 71% of the cells exposed to the highest concentration (400 μg mL−1) of UCNP–BPNS were killed with 980 nm laser irradiation. This damage of HeLa cells (in group four) can be associated to the toxicity of singlet oxygen generation due to the FRET from UCNPs to BPNS under 980 nm laser irradiation, endorsing the PDT effect of the nanocomposite. The lowest cells viability achieved in group five manifests that the unity of PDT and PTT were powerful strength to successfully win the battle against HeLa cells. As illustrated in Fig. 6, around 91% of the HeLa cells in this group were killed at high concentration (400 μg mL−1) of UCNP–BPNS after being irradiated with both 808 nm laser (for PTT) and 980 nm laser (for PDT). The result effectively proves that the UCNP–BPNS nanocomposite is an excellent candidate for synergistic photothermal and photodynamic therapy.Furthermore, live and dead cells were differentiated by staining the HeLa cells with calcein AM (green fluorescence) and propidium iodide (PI, red fluorescence) that shows the live cells and dead cells, respectively. As depicted in Fig. 7a and b, the control group (HeLa cells without UCNP–BPNS) and control group irradiated with 808 nm laser with power density of 1.5 W cm−2 for 30 min (10 min breaks after every 10 min irradiation) plus 980 nm laser with power density of 0.5 W cm−2 for 6 min (2 min breaks after every 2 min irradiation) show bright green emission (live cells), indicating that the 808 nm and 980 nm lasers have no effect on the viability of the cells. Similarly, in Fig. 7c, HeLa cells exposed to only UCNP–BPNS with concentration of 400 μg mL−1 (without laser) display bright green fluorescence, illustrating that UCNP–BPNS is non-toxic to the cells. However, when HeLa cells were treated with UCNP–BPNS (400 μg mL−1) plus 808 nm laser irradiation, a large number of red fluorescence was observed as indicated in Fig. 7d, suggesting that some HeLa cells were killed due to the photothermal effect. This result once more reveals that the nanocomposite is marvelous potential candidate for PTT. As compared to green fluorescence, high numbers of red fluorescence were also observed after HeLa cells treated with UCNP–BPNS (400 μg mL−1) and were irradiated with 980 nm laser, as shown in Fig. 7e, indicating that some of the cells were killed by ROS (1O2) generated as a result of FRET from UCNP to BPNS (photosensitizer) as already confirmed by UV-vis spectra of DPBF shown in Fig. 4f. When the cells, treated with UCNP–BPNS (400 μg mL−1), were irradiated with both 808 nm and 980 nm laser simultaneously, nearly all of the cells exhibited bright red fluorescence, implying that almost all the cells were killed due to the synergistic PTT and PDT effect of UCNP–BPNS, as illustrated in Fig. 7f. In a nutshell, it can be further concluded that the nanocomposite displays excellent potential for synergistic photothermal and photodynamic therapy.
3.5 In vitro UCL imaging
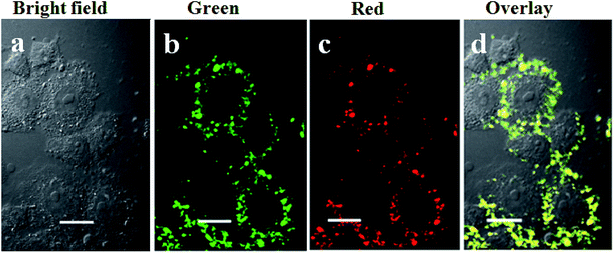
Encouraged by the good upconversion emission spectrum in the visible range (red and green) of UCNP–BPNS under 980 nm irradiation and strong emission observed in the photograph of UCNP–BPNS in aqueous solution irradiated with 980 nm laser depicted in Fig. 3, UCL imaging of HeLa cells was carried out using CLSM after incubating the cells with UCNP–BPNS at concentration of 400 μg mL−1 for 4 h. From Fig. 8 it can be observed that intense UCL images of green (500–600 nm) and red (600–700 nm) channels were detected respectively in the intracellular region of the cells, as also confirmed in three-dimensional CLSM images collected along the Z optical axis shown in Fig. S10.† The overlay of UCL images (green and red) and the bright field image shown in Fig. 8d, endorses that most of the nanocomposite localized in the cell membrane and cytosol region. To sum up, the visible and auto-fluorescence-free UCL images detected in the green, red, and merged signals suggest that the nanocomposite can be utilized as visual tracking agents.3.6 T1-Weighted magnetic resonance (MR) imaging
MR imaging is one of the widely used non-invasive bioimaging technique that basically demands contrast agent to enhance MR imaging sensitivity.54 The interaction of contrast agent and nearby water protons is deceiving factor to shorten relaxation time of the water molecules and, hence increase relaxivity of water protons. In the UCNP–BPNS nanocomposite, the core of UCNP was deliberately coated with paramagnetic Gd3+ that has large total electron angular momentum (J) consists of only electron spin angular momentum component (J = S = 7/2) to be used for T1-weighted MR imaging.55 The designed shell (NaGdF4) has at least one water molecule coordinated to the Gd3+ ion that can be rapidly exchanged with bulk water to enhance the longitudinal relaxivity (r1) which is the slope of the graph of relaxation rate (1/T1) versus concentration of Gd3+ ion. As depicted in Fig. 9a (the bright field and the color mapping images), as the concentration of Gd3+ ion increases the intensity of the T1-weighted MR imaging signal increases. From the linear fit of relaxation rate (1/T1) versus concentration of Gd3+ ion curve shown in Fig. 9b, high longitudinal relaxivity (r1) which is 3.69 mM−1 s−1 was obtained. The result reveals that the nanocomposite can be effectively used as T1-weighted MR imaging contrast agent.4 Conclusions
In summary, we proposed multifunctional theranostic nanocomposite from upconversion nanoparticles UCNP and black phosphorus nanosheets BPNS, which can be used for synergistic photothermal and photodynamic therapies and dual modal imaging (UCL and MR imaging). We successfully synthesized BPNS using liquid exfoliation method, and core–shell UCNP with strong upconversion luminescence in the visible region. The final UCNP–BPNS nanocomposite were obtained by covalently conjugating PAA modified UCNPs and PEG-NH2 modified BPNS. The PEG-NH2 modified on the surface of BPNS enhanced the stability of the nanosheets. As a result of only PTT effect of UCNP–BPNS, about 85% of HeLa cells were destroyed via direct irradiation of the nanocomposite with 808 nm CW laser, endorsing the apparent heat conversion efficacy of BPNS. Besides, under 980 nm CW laser irradiation of the nanocomposite, about 71% of the cells were killed by 1O2 generation due to FRET from UCNPs to BPNS, validating excellent potential of the nanocomposite for PDT. Upon simultaneous 808 and 980 nm laser irradiation, about 91% of the cells were killed due to the synergetic PTT and PDT effects of the nanocomposite. Moreover, UCNP–BPNS showed both UCL and MR imaging performance, endorsing apparent potential of our nanocomposite for theranostic cancer efficacy under single nanoplatform.Conflicts of interest
There are no conflicts to declare.Acknowledgements
This work was supported by the National Key R&D Program of China (No. 2016YFE0114800), the National Natural Science Foundation of China (No. 21571125 and 51672171), and the National Basic Research Program of China (No. 2016YFA0201600). We are very thankful to Prof. Haifang Wang of Institute of Nanochemistry and Nanobiology of Shanghai University for her helpful discussion and measurements. The authors also acknowledge the Instrumental Analysis & Research Center of Shanghai University and the support of China Scholarship Council.Notes and references
- S. S. Lucky, K. C. Soo and Y. Zhang, Chem. Rev., 2015, 115, 1990–2042 CrossRef CAS PubMed.
- Y. Wang, H. Wang, D. Liu, S. Song, X. Wang and H. Zhang, Biomaterials, 2013, 34, 7715–7724 CrossRef CAS PubMed.
- J. Xu, A. Gulzar, Y. Liu, H. Bi, S. Gai, B. Liu, D. Yang, F. He and P. Yang, Small, 2017, 13, 1701841 CrossRef PubMed.
- F. He, G. Yang, P. Yang, Y. Yu, R. Lv, C. Li, Y. Dai, S. Gai and J. Lin, Adv. Funct. Mater., 2015, 25, 3966–3976 CrossRef CAS.
- Q. Chen, C. Wang, L. Cheng, W. He, Z. Cheng and Z. Liu, Biomaterials, 2014, 35, 2915–2923 CrossRef CAS PubMed.
- J. Xu, W. Han, Z. Cheng, P. P. Yang, H. Bi, D. Yang, N. Niu, F. He, S. Gai and J. Lin, Chem. Sci., 2018, 9, 3233 RSC.
- X. Zhang, F. Ai, T. Sun, F. Wang and G. Zhu, Inorg. Chem., 2016, 55, 3872–3880 CrossRef CAS PubMed.
- J. Wang, L. Liu, Q. You, Y. Song, Q. Sun, Y. Wang, Y. Cheng, F. Tan and N. Li, Theranostics, 2018, 8, 955–971 CrossRef PubMed.
- W. Guo, Z. Qiu, C. Guo, D. Ding, T. Li, F. Wang, J. Sun, N. Zheng and S. Liu, ACS Appl. Mater. Interfaces, 2017, 9, 9348–9358 CrossRef CAS PubMed.
- Y. Shen, A. J. Shuhendler, D. Ye, J. J. Xua and H. Y. Chen, Chem. Soc. Rev., 2016, 45, 6725–6741 RSC.
- S. Li, K. Chang, K. Sun, Y. Tang, N. Cui, Y. Wang, W. Qin, H. Xu and C. Wu, ACS Appl. Mater. Interfaces, 2016, 8, 3624–3634 CrossRef CAS PubMed.
- F. Lu, L. Yang, Y. Ding and J. J. Zhu, Adv. Funct. Mater., 2016, 26, 4778–4785 CrossRef CAS.
- X. Zhuang, X. Ma, X. Xue, Q. Jiang, L. Song, L. Dai, C. Zhang, S. Jin, K. Yang, B. Ding, P. C. Wang and X. J. Liang, ACS Nano, 2016, 10, 3486–3495 CrossRef CAS PubMed.
- Y. Wang, G. Yang, Y. Wang, Y. Zhao, H. Jiang, Y. Han and P. Yang, Nanoscale, 2017, 9, 4759–4769 RSC.
- C. Wang, L. Cheng and Z. Liu, Theranostics, 2013, 3, 317–330 CrossRef PubMed.
- D. Wang, B. Liu, Z. Quan, C. Li, Z. Hou, B. Xing and J. Lin, J. Mater. Chem. B, 2017, 5, 2209–2230 RSC.
- X. Xie, Z. Li, Y. Zhang, S. Guo, A. I. Pendharkar, M. Lu, L. Huang, W. Huang and G. Han, Small, 2017, 13, 1602843 CrossRef PubMed.
- C. Yan, H. Zhao, D. F. Perepichka and F. Rosei, Small, 2016, 12, 3888–3907 CrossRef CAS PubMed.
- W. Fan, W. Bu and J. Shi, Adv. Mater., 2016, 28, 3987–4011 CrossRef CAS PubMed.
- M. Sun, L. Xu, W. Ma, X. Wu, H. Kuang, L. Wang and C. Xu, Adv. Mater., 2016, 28, 898–904 CrossRef CAS PubMed.
- S. H. Kim, J. E. Lee, S. M. Sharker, J. H. Jeong, I. In and S. Y. Park, Biomacromolecules, 2015, 16, 3519–3529 CrossRef CAS PubMed.
- T. Sugiura, D. Matsuki, J. Okajima, A. Komiya, S. Mori, S. Maruyama and T. Kodama, Nano Res., 2015, 8, 3842–3852 CrossRef CAS.
- B. Liu, C. Li, Z. Xie, Z. Hou, Z. Cheng, D. Jin and J. Lin, Dalton Trans., 2016, 45, 13061–13069 RSC.
- S. T. Brown and S. Fiering, Int. J. Hyperthermia, 2014, 30, 531–539 CrossRef PubMed.
- R. Wei, W. Xi, H. Wang, J. Liu, T. Mayr, L. Shi and L. N. Sun, Nanoscale, 2017, 9, 12885–12896 RSC.
- Y. Jiang, D. Cui, Y. Fang, X. Zhen, P. K. Upputuri, M. Pramanik, D. Ding and K. Pu, Biomaterials, 2017, 145, 168–177 CrossRef CAS PubMed.
- J. Li, J. Rao and K. Pu, Biomaterials, 2018, 155, 217–235 CrossRef CAS PubMed.
- M. Hassan, V. G. Gomes, A. Dehghani and S. M. Ardekan, Nano Res., 2017, 11, 1–41 CrossRef.
- A. C. Gomez, J. Phys. Chem. Lett., 2015, 6, 4280–4291 CrossRef PubMed.
- A. Khandelwal, K. Mani, M. H. Karigerasi and I. Lahiri, Mater. Sci. Eng., B, 2017, 221, 17–34 CrossRef CAS.
- C. R. Ryder, J. D. Wood, S. A. Wells, Y. Yang, D. Jariwala, T. J. Marks, G. C. Schatz and M. C. Hersam, Nat. Chem., 2016, 8, 597–602 CrossRef CAS PubMed.
- J. M. Urban, M. Baranowski, A. Surrente, D. Wlodarczyk, A. Suchocki, G. Long, Y. Wang, L. Klopotowski, N. Wang, D. K. Maudea and P. Plochocka, Nanoscale, 2017, 9, 19298–19303 RSC.
- M. Lee, A. K. Roy, S. Jo, Y. Choi, A. Chae, B. Kim, S. Y. Park and I. In, Nanotechnology, 2017, 28, 125603 CrossRef PubMed.
- X. Chen, Y. Wu, Z. Wu, Y. Han, S. Xu, L. Wang, W. Ye, T. Han, Y. He, Y. Cai and N. Wang, Nat. Commun., 2015, 6, 7315 CrossRef CAS PubMed.
- L. Li, Y. Yu, G. J. Ye, Q. Ge, X. Ou, H. Wu, D. Feng, X. H. Chen and Y. Zhang, Nat. Nanotechnol., 2014, 9, 372–377 CrossRef CAS PubMed.
- R. Gusm, Z. Sofer and M. Pumera, Angew. Chem., Int. Ed., 2016, 56, 8052–8072 CrossRef PubMed.
- Z. Sun, H. Xie, S. Tang, X. F. Yu, Z. Guo, J. Shao, H. Zhang, H. Huang, H. Wang and P. K. Chu, Angew. Chem., Int. Ed., 2015, 54, 11526–11530 CrossRef CAS PubMed.
- W. Chen, J. Ouyang, X. Yi, Y. Xu, C. Niu, W. Zhang, L. Wang, J. Sheng, L. Deng, N. Liu and S. Guo, Adv. Mater., 2017, 29, 1603864 CrossRef PubMed.
- R. Lv, D. Yang, P. Yang, J. Xu, F. He, S. Gai, C. Li, Y. Dai, G. Yang and J. Lin, Chem. Mater., 2016, 28, 4724–4734 CrossRef CAS.
- D. Yang, G. Yang, P. Yang, R. Lv, S. Gai, C. Li, F. He and J. Lin, Adv. Funct. Mater., 2017, 27, 1700371 CrossRef.
- W. Chen, J. Ouyang, X. Yi, Y. Xu, C. Niu, W. Zhang, L. Wang, J. Sheng, L. Deng, Y. N. Liu and S. Guo, Adv. Mater., 2018, 30, 1703458 CrossRef PubMed.
- P. Yasaei, B. Kumar, T. Foroozan, C. Wang, M. Asadi, D. Tuschel, J. E. Indacochea, R. F. Klie and A. S. Khojin, Adv. Mater., 2015, 27, 1887–1892 CrossRef CAS PubMed.
- X. Ge, L. Sun, B. Ma, D. Jin, L. Dong, L. Shi, N. Li, H. Chen and W. Huang, Nanoscale, 2015, 7, 13877–13887 RSC.
- Z. Wei, L. Sun, J. Liu, J. Z. Zhang, H. Yang, Y. Yang and L. Shi, Biomaterials, 2014, 35, 387–392 CrossRef CAS PubMed.
- X. Ge, L. Dong, L. Sun, Z. Song, R. Wei, L. Shia and H. Chen, Nanoscale, 2015, 7, 7206–7215 RSC.
- R. Wei, Z. Wei, L. N. Sun, J. Z. Zhang, J. Liu, X. Ge and L. Shi, ACS Appl. Mater. Interfaces, 2016, 8, 400–410 CrossRef CAS PubMed.
- P. Jiang, M. He, L. Shen, A. Shi and Z. Liu, Sens. Actuators, B, 2017, 239, 319–324 CrossRef CAS.
- X. Jia, J. Yin, D. He, X. He, K. Wang, M. Chen and Y. Li, J. Biomed. Nanotechnol., 2013, 9, 2063–2072 CrossRef CAS PubMed.
- Y. Zhao, L. Tong, Z. Li, N. Yang, H. Fu, L. Wu, H. Cui, W. Zhou, J. Wang, H. Wang, P. K. Chu and X. F. Yu, Chem. Mater., 2017, 29, 7131–7139 CrossRef CAS.
- X. Jia, J. Bai, Z. Ma and X. Jiang, J. Mater. Chem. B, 2017, 5, 269–278 RSC.
- J. Xu, P. P. Yang, M. Sun, H. Bi, B. Liu, D. Yang, S. Gai, F. He and J. Lin, ACS Nano, 2017, 11, 4133–4144 CrossRef CAS PubMed.
- W. Tao, X. Ji, X. Xu, M. A. Islam, Z. Li, S. Chen, P. E. Saw, H. Zhang, Z. Bharwani, Z. Guo, J. Shi and O. C. Farokhzad, Angew. Chem., Int. Ed., 2017, 56, 11896–11900 CrossRef CAS PubMed.
- W. Fan, W. Bu, B. Shen, Q. He, Z. Cui, Y. Liu, X. Zheng, K. Zhao and J. Shi, Adv. Mater., 2015, 27, 4155–4161 CrossRef CAS PubMed.
- Q. Xiao, X. Zheng, W. Bu, W. Ge, S. Zhang, F. Chen, H. Xing, Q. Ren, W. Fan, K. Zhao, Y. Hua and J. Shi, J. Am. Chem. Soc., 2013, 135, 13041–13048 CrossRef CAS PubMed.
- Z. Xue, Z. Yi, X. Li, Y. Li, M. Jiang, H. Liu and S. Zeng, Biomaterials, 2017, 115, 90–103 CrossRef CAS PubMed.
Footnote |
| † Electronic supplementary information (ESI) available: HRTEM image of UCNP. DLS size of UCNP–BPNS nanocomposite. FT-IR spectra of UCNP, UCNP-PAA, and UCNP–BPNS nanocomposite. Zeta potentials of UCNP-PAA, BPNS-NH2, and UCNP–BPNS nanocomposite. Absorption spectra of BPNS-NH2 and UCNP–BPNS nanocomposite during two weeks. Infrared thermal images. Cytotoxicity assays of HeLa cells incubated with UCNP–BPNS nanocomposite. Cytotoxicity assays of HeLa cells irradiated with 980 nm laser for 6 min as compared to the control. The three-dimensional CLSM images of HeLa cells after incubation with UCNP–BPNS for 4 h collected as series along the Z optical axis. See DOI: 10.1039/c8ra07441k |
| This journal is © The Royal Society of Chemistry 2018 |

