 Open Access Article
Magnetic, magnetocaloric and critical behavior investigation of La0.7Ca0.1Pb0.2Mn1−x−yAlxSnyO3 (x, y = 0.0, 0.05 and 0.075) prepared by a sol–gel method
Khadija Dhahri *a,
N. Dhahria,
J. Dhahri
 a,
K. Taibib,
E. K. Hlilc,
Hafedh Belmabroukd and
M. Zaidid
aLaboratoire de la matière condensée et des nanosciences, Département de Physique, Faculté des Sciences, Université de Monastir, Monastir 5019, Tunisia. E-mail: khadijadhahri91@yahoo.com
bDépartement SDM, FGMGP/USTHB, 16311, Algeria
cInstitut Néel, CNRS-Université J. Fourier, BP 166, Gronoble 38042, France
dDepartment of Physics, College of Science of Zulfi, Majmaah University, Al Majmaah, Saudi Arabia
First published on 7th September 2017
Abstract
A systematic study on the magnetic, magnetocaloric and critical behavior properties of polycrystalline La0.7Ca0.1Pb0.2Mn1−x−yAlxSnyO3 prepared via a sol–gel method are studied. These compounds present a single magnetic transition from a ferromagnetic (FM) to paramagnetic (PM) phase with decreasing temperature. The critical exponents are estimated using various techniques, such as a modified Arrott plot, the Kouvel–Fisher method and critical isotherm analysis based on the data of static magnetic measurements recorded around the Curie temperature, TC. The estimated critical exponent values are found to be consistent and comparable to those predicted by the 3D-Ising model for x, y = 0.0 and by the mean field model for x, y = 0.05 and 0.075. We have confirmed the obtained critical exponents with the single scaling equation: M(μ0H,ε) = εβf ± (μ0H/εβ+γ), where ε = (T − TC)/TC is the reduced temperature. We have investigated the validity and usefulness of theoretical modeling in our compound La0.7Ca0.1Pb0.2Mn1−x−yAlxSnyO3 based on the mean-field analysis of the magnetic entropy change (−ΔSM) versus the magnetization data. For comparison, the MSp has been also deduced from the classical extrapolation of the Arrott plot. We obtain an excellent agreement between the spontaneous magnetization determined from the entropy change (−ΔSM vs. M2) and the Arrot curves (μ0H/M vs. M2), confirming the validity of the magnetic entropy change approach in order to estimate the spontaneous magnetization MSp in a ferromagnetic system.
1. Introduction
In the last few decades, magnetic refrigeration in the room-temperature range has attracted global interest owing to its energy-efficient and environment-friendly advantages over the gas compression–expansion refrigeration techniques.1,2 It is based on the magnetocaloric effect (MCE), which is the thermal response (heating or cooling) of a magnetic substance when a magnetic field is applied or removed. Recently, much research in this area has been to develop materials that are cost effective and exhibit large MCE (large isothermal magnetic entropy change ΔSM) over a wide temperature range. Among them, lanthanum manganites with the general formula La1−xAxMnO3, where A is a divalent element (A = Ca, Sr, Ba…), have drawn the attention of the solid-state physics community because of their important electrical and magnetic properties, such as the discovery of their colossal magnetoresistance (CMR)3–7 and the magnetocaloric effect (MCE).8–13 These materials exhibit a rich variety of physical properties. The most accepted interpretations for the cause of these properties are the double exchange model14 and Jahn–Teller effect.15,16 Both of these mechanisms are used to identify the magnetic phase transition (FM–PM).17 To understand better the metal–semiconductor transition and the CMR, it is important to fully understand the nature of the PM–FM transition. Therefore, to make these issues clear, it will be essential to cross over on the critical exponents at the region of the paramagnetic (PM)–ferromagnetic (FM) transition in order to unveil the nature of the magnetic system transition. Up to date, a great number of reports on the critical behaviors around the Curie temperature have been predicted that the critical exponents play important roles in elucidating interactions mechanisms near TC. Most attention has been focused on the study of the critical phenomena of La-based manganites.18–30 On the one side, in an earlier theoretical work, the critical behavior in the DE model was first described with long range mean-field theory.31 On the other side, some researchers have reported that the critical exponents in manganites are in agreement with a short-range exchange-interaction model32 with the estimated critical exponent values related to either 3D-Heisenberg33 or 3D-Ising34 model. Several studies35–38 have been carried out on the vicinity of the magnetic phase transition by using a variety of techniques have yielded a wide range of values for the critical parameters β. For example the β value reported by Ghosh et al.39 is equal to 0.37 for the ferromagnet manganite La0.7Sr0.3MnO3. However, Amaral et al.40 reported that the values of the critical exponents for La0.665Eu0.035Sr0.3MnO3 are in good agreement with that predicted by the mean-field theory. Meanwhile, in the series of compounds La1−xCaxMnO3, there exists a tricritical point at x = 0.4 that sets a boundary between first-order (x < 0.4) and second-order (x > 0.4) FM phase transition in the FM range (0.2 < x < 0.5).41 Up to now, in view of the various critical exponents β from 0.1 to 0.5, four kinds of different theoretical models, which are mean-field theory(β = 0.5, γ = 1.0 and δ = 3.0), 3D-Ising model (β = 0.325, γ = 1.241 and δ = 4.82) 3D-Heisenberg model (β = 0.365, γ = 1.336 and δ = 4.8) and tricritical mean field theory (β = 0.25, γ = 1.0 and δ = 5.0), were used to discuss the critical properties in manganites.In the present work, a detailed investigation is conducted on magnetic, magnetocaloric properties and the critical behaviors in the polycrystalline La0.7Ca0.1Pb0.2Mn1−x−yAlxSnyO3 (x, y = 0.0, 0.05 and 0.075) by using various techniques through modified Arrot plot, Widom scaling and Kouvel–Fisher methods. We demonstrate that the critical phenomena near PM–FM Curie temperature transition is described by mean-field model and 3D-Ising model rather than by the two others models. Consequently, from the magnetic entropy change determined from magnetic measurements (−ΔSM vs. M2), we have estimated the spontaneous magnetization (MSp) and the results of this approach are compared with the classical extrapolation of the Arrott curves (μ0H/M vs. M2).
2. Experimental details
La0.7Ca0.1Pb0.2Mn1−x−yAlxSnyO3 (x, y = 0.0, 0.05 and 0.075) compounds were prepared using a conventional sol–gel method that details was described in our previous work.42 The magnetization measurements were carried out using a vibrating sample magnetometer developed in Louis Néel Laboratory at Grenoble, where we measured the magnetization versus applied magnetic field in a temperature range near TC. To extract the critical exponent of the samples accurately, isothermal magnetization data as function of magnetic field were performed in the range of 0–5 T, in the vicinity of the PM to FM phase transition. These isothermals are corrected by a demagnetization factor D that has been determined by a standard procedure from low-field dc magnetization measurement at low temperatures (μ0H = μ0Happ − DM).3. Scaling analysis
The scaling hypothesis suggests the following power-law relation near the critical region defined by:| MS(T) = M0(−ε)β, ε < 0 | (1) |
| χ0−1(T) = (h0/M0)εγ, ε > 0 | (2) |
| M = DH1/δ, ε = 0 | (3) |
| M(μ0H,ε) = εβf ± (μ0H/εβ+γ) | (4) |
4. Results and discussion
4.1. Magnetic and magnetocaloric properties
The magnetization of La0.7Ca0.1Pb0.2Mn1−x−yAlxSnyO3 (x, y = 0.0, 0.05, and 0.075) as a function of temperature in a 0.05 T magnetic field in both zero-field-cooled (ZFC) and field-cooled (FC) processes of all the samples has been undertaken and their behavior is shown in Fig. 1. Based on these results, it appears that with decreasing temperature, the samples exhibit a magnetic transition from a paramagnetic (PM) to a ferromagnetic (FM) state, at the same time, TC slightly decreases with small (Al, Sn) concentration, then this transition shifts towards room temperature on adding more (Al, Sn) content. Consequently, the Curie temperature for each sample, obtained from the inflection points of the derivative dM/dT, was found to be 310 K, 295 K and 290 K for x, y = 0.0, 0.05 and 0.075, respectively. These values deduced are very close to room temperature, which are quite suitable for magnetic refrigeration technology. Obviously, below the Curie temperature one may distinguish the pronounced split between the field-cooled (FC) and zero-field-cooled (ZFC) for all samples. This prominent divergence has been attributed to the magnetic frustration arising from a coexistence of insulating antiferromagnetic and metallic ferromagnetic phases, or from the competition between antiferromagnetic and ferromagnetic interactions. The gradual decrease of TC as well as the saturation magnetization (MS) with increase of (Al, Sn) content indicates weakening of the double exchange ferromagnetic interactions associated with the itinerancy. The TC reduction in La0.7Ca0.1Pb0.2Mn1−x−yAlxSnyO3 samples with increasing (Al, Sn)-doping is in good agreement with the results reported by.45,46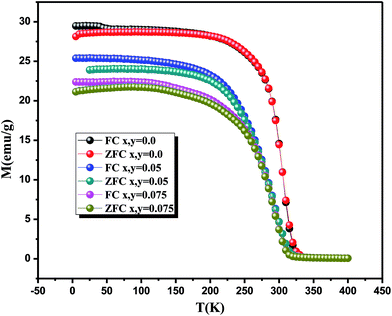 | ||
| Fig. 1 Temperature dependences of ZFC and FC magnetization for La0.7Ca0.1Pb0.2Mn1−x−yAlxSnyO3 (x, y = 0.0, 0.05 and 0.075) compounds under a magnetic field of 0.05 T. | ||
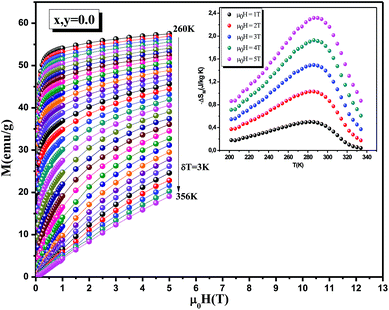
Together with the M(T) investigations, we have measured magnetic-field dependences of the initial magnetization, M(μ0H), of the samples La0.7Ca0.1Pb0.2Mn1−x−yAlxSnyO3 around their FM–PM phase transition. In Fig. 2, the isothermal magnetization versus applied field, with temperature increments of 3 K, is shown for La0.7Ca0.1Pb0.2MnO3 under magnetic field μ0H ranging between 0 and 5 T. Below TC, the magnetization saturates rapidly due to an easy orientation of the spins under the action of the applied field, which confirms the ferromagnetic behavior of our compounds at low temperatures. On the other site, for T > TC and above μ0H = 1 T, the mean value of the moment orientation is modified and an induced magnetization parallel to the field appears. This magnetization is all the smaller as the temperature is high, which means that the thermal agitation is important. Gradually as the temperature increases the variations of the magnetization as a function of the field become more and more linear reflecting a paramagnetic behavior.47
In order to enquire the efficiency of our sample in the magnetic refrigeration systems, the magnetic entropy change due to the application of a magnetic field H can be calculated from a family of isothermal M–μ0H curves, using a numerical approximation as follows:
 | (5) |
The magnetic entropy change between 0 and μ0H magnetic applied field, can be basically obtained by:
 | (6) |
The temperature dependence of the magnetic entropy change (−ΔSM) taken at various magnetic fields ranging from 1 to 5 T for x, y = 0.05 sample is shown in the inset of Fig. 2. One can see that, at a given temperature, the overall value of entropy change is found to increase with increasing field, and exhibited a maximum value around TC. The magnetic entropy change (−ΔSM) reaches a maximum values of 3.7 J kg−1 K−1, 2.3 J kg−1 K−1 and 2 J kg−1 K−1 obtained at corresponding temperatures 310 K, 295 K and 290 K for x, y = 0.0, 0.05 and 0.075, respectively, under a magnetic field of 5 T. From the application point view, the relative cooling power (RCP) can be, in simple cases, evaluated by considering the magnitude of |ΔSmaxM| and its full width at half maximum (δTFWHM). We can see that these results are interesting compared with other compounds reported in the literature, so we can estimate that our materials are a potential candidate to be used in an ideal Ericsson refrigeration cycle. To further investigate the reliability of these values, we gathered in Table 1 the values of −ΔSmaxM and RCP for all the samples under a magnetic applied field of 5 T as well as some results found in previous works48,55 in order to compare them with ours.
| Sample | TC (K) | ΔH (T) | −ΔSmaxM (J kg−1 K−1) | RCP (J kg−1) | References |
|---|---|---|---|---|---|
| Gd | 293 | 5 | 9.5 | 410 | 48 |
| Gd5Si2Ge2 | 275 | 5 | 18.5 | 535 | 49 |
| La0.67Ba0.33MnO3 | 292 | 5 | 1.48 | 161 | 50 |
| La0.7Sr0.3Mn0.9Al0.1O3 | 310 | 5 | 2.6 | 109 | 51 |
| La0.67Ca0.33MnO3 | 252 | 5 | 2.06 | 175 | 52 |
| La2/3(Ca,Pb)1/3MnO3 | 290 | 7 | 7.5 | 375 | 53 |
| La0.65Ca0.35Ti0.4Mn0.6O3 | 42 | 3 | 0.6 | 55 | 54 |
| La0.7Pb0.3MnO3 | 358 | 1.35 | 1.53 | 53 | 55 |
| La0.7Ca0.1Pb0.2MnO3 | 310 | 5 | 3.7 | 145 | This work |
| La0.7Ca0.1Pb0.2Mn0.9Al0.05Sn0.05O3 | 295 | 5 | 2.3 | 135 | This work |
| La0.7Ca0.1Pb0.2Mn0.85Al0.075Sn0.075O3 | 290 | 5 | 2 | 176 | This work |
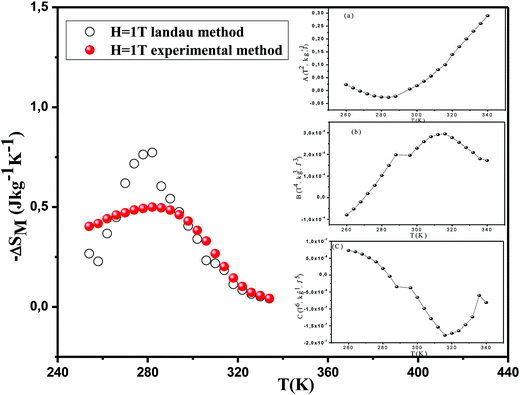
In order to understand the origin of the magnetocaloric effect described by the spin fluctuations, Amaral et al.56,57 have proposed a successful model based on Landau's theory of phase transition, with a contribution from magnetoelastic and electron interaction in manganites. Using the Landau power expansion of the magnetization M, by neglecting higher-order parts, the Gibbs free energy versus magnetization and temperature can be expressed in the following form:
 | (7) |
 , the magnetic equation of state is obtained as:
| μ0H/M = A(T) + B(T)M2 + C(T)M4 | (8) |
In addition, the applied magnetic field μ0H can be deduced from eqn (8) as:
| μ0H = A(T)M + B(T)M3 + C(T)M5 | (9) |
According to this equation, the values of A(T), B(T) and C(T) can be determined from the fitting of magnetization isothermal data. It can be seen from the inset of Fig. 3 that the parameter A(T) varies from negative to positive values around the transition point TC, and the temperature just corresponding to the zero value of parameter A is consistent with the TC. In addition, the landau parameter B(T) is observed to be negative below TC and positive above TC. This change from negative to positive suggests that the phase transition in the sample is of second order.58
In the frame of the Landau theory, the magnetic entropy is obtained from differentiation of the free energy with respect to temperature as:59
 | (10) |
The change of specific heat (ΔCp) associated with a magnetic field from 0 to μ0H is given by
 | (11) |
We have plotted ΔCp(T,μ0H) versus temperature for x, y = 0.05 sample at different magnetic field in Fig. 4 calculated from the (−ΔSM) by using eqn (11). It shows the presence of anomalies in all curves around TC due to the magnetic phase transition. In fact, the value of ΔCp undergoes a sudden change from negative to positive around the Curie point with a negative value below TC and a positive value above TC. Furthermore, the maximum/minimum values of ΔCp increases with the applied magnetic field. The sum of the two parts is the magnetic contribution to the total specific heat which affects the heating or cooling power of the magnetic refrigerator.64 Moreover, other structural, magnetic and magnetocaloric properties are previously studied.42
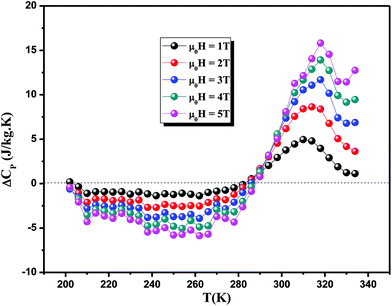 | ||
| Fig. 4 Change of specific heat of the sample as a function of temperature at different magnetic fields for x = 0.05. | ||
4.2. Critical behavior
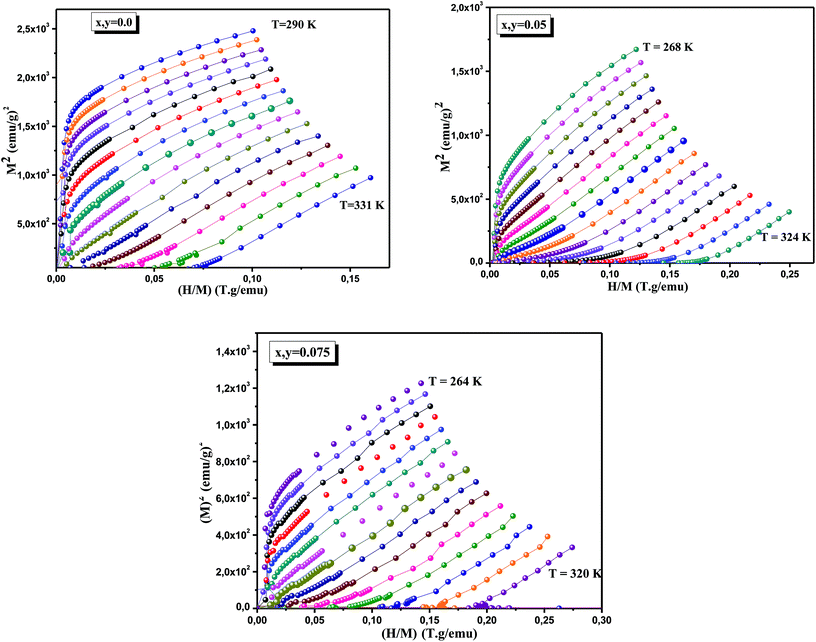
Nowadays, there is a need to design new magnetic systems with a second order transition, low hysteresis losses and attractive RCP values to be compatible for the magnetic freezers. In order to determine the type of magnetic phase transition (first or second order) for our samples in vicinity of Curie temperature, the regular Arrott plot displayed as M1/β with respect to (μ0H/M)1/γ, β and γ are the mean field exponents of (β = 0.5, γ = 1), are constructed (Fig. 5). A rough determination of the order of magnetic phase transitions is possible by applying the Banerjee criterion, in which the sign of the isotherms slope of M2 versus μ0H/M will give the nature of the phase transition: positive slope in the high field region indicates absolutely a second order transition, but a negative slope of M2 vs. μ0H/M reflects that the magnetic system exhibits a first order transition.65–67 In the present case, all the M2 vs. μ0H/M curves exhibit a positive slope indicating that the transition between the ferromagnetic and paramagnetic phases is of the second order, according to the criterion proposed by Banerjee.68 We believe that the substitution of Al3+ and Sn4+ (nonmagnetic ions) into the Mn site changes structural parameters, such as the bond length 〈Mn–O〉 and bond angle 〈Mn–O–Mn〉, and dilute the FM lattice. Along these lines, the variation of these factors acts as a fluctuation, and thus influences the FM-interaction strength of DE Mn3+–Mn4+ pairs as well as the phase-transition type. The appearance of the second-order magnetic phase transition in LCPMAlSnO is thus understandable. According to mean-field theory, near TC these curves should show a series of straight lines for different temperatures and the line T = TC should cross the origin.69 In present study, it is evident in Fig. 5 that these conditions are more accurate for x, y = 0.05 and 0.075 samples. In particular, the line of M2 vs. μ0H/M crosses the origin at TC = 295 K and 290 K vs. (μ0H/M). This indicates that the mean field model is the best one for the critical analysis of these compounds. As against, for x, y = 0.0 sample, the curves in the Arrott plot are nonlinear and show a downward curvature even at a high field region indicating that the exponents with β = 0.5 and γ = 1 cannot be used to describe the critical behavior in these samples. In order to analyze more carefully the nature of the magnetic phase transition in La0.7Ca0.1Pb0.2Mn1−x−yAlxSnyO3 (x, y = 0.0, 0.05 and 0.075) samples, we realized the studies of the critical behavior near TC.The analysis of Arrott plots show that x, y = 0.05 and 0.075 samples may be described by the mean field model with β = 0.5 and γ = 1. Therefore, to better obtain the right values of β and γ exponents, the data was analyzed using a modified Arrott-plot expression, based on the Arrott–Noakes equation of state:70
| (μ0H/M)1/γ = a(T − TC)/T + bM1/β | (12) |
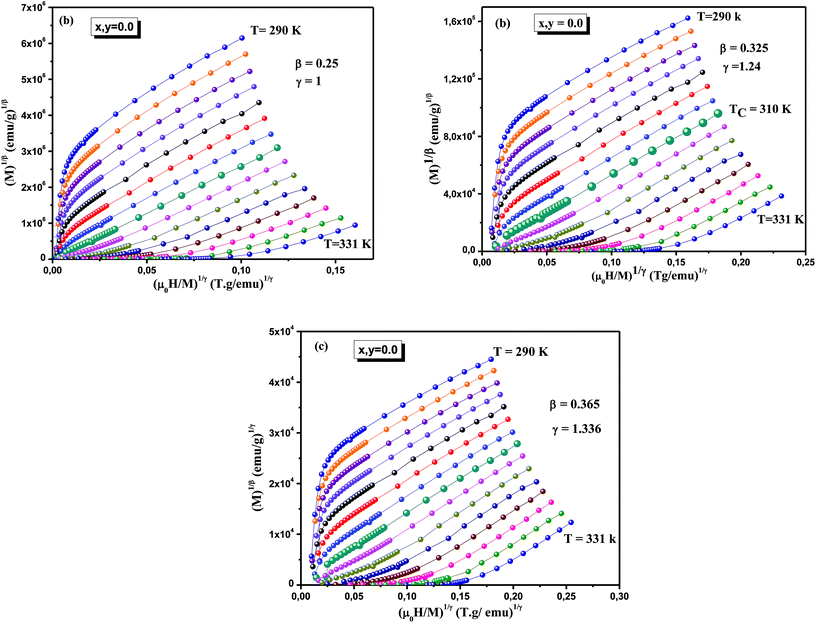
Fig. 6 shows the plot of M1/β versus (μ0H/M)1/γ at several temperature by using different models of critical exponents for La0.7Ca0.1Pb0.2Mn1−x−yAlxSnyO3 (x, y = 0.0) sample: Fig. 6(a) tricritical mean-Field model (β = 0.25 and γ = 1). Fig. 6(b) 3D-Ising model (β = 0.325 and γ = 1.24) and Fig. 6(c) 3D-Heisenberg model (β = 0.365 and γ = 1.336).
Due to the resemblance of quasi straight lines in the high-field region for each corresponding curve models cited earlier, it seems difficult to fix on which model is the most proper to find out the critical exponents. In order to distinguish which the best model that describes our system, it is necessary to take into account a new indicator for selection. Thus, to confirm the better model to fit our experimental data, their relative slopes (RS) were calculated at the critical point, defined as:
| RS = S(T)/S(TC) |
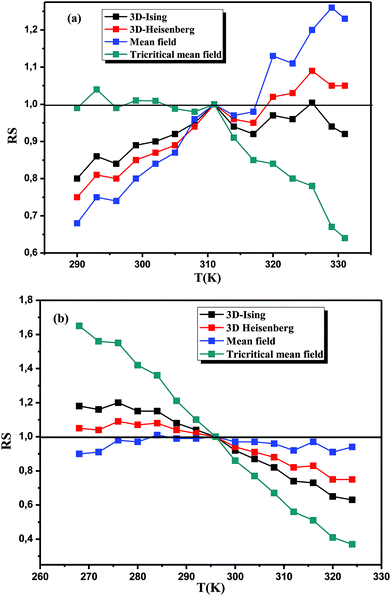 | ||
| Fig. 7 Relative slope (RS) as a function of temperature of La0.7Ca0.1Pb0.2Mn0.9Al0.05Sn0.05O3, (a) for x, y = 0.0 and (b) for x, y = 0.05. | ||
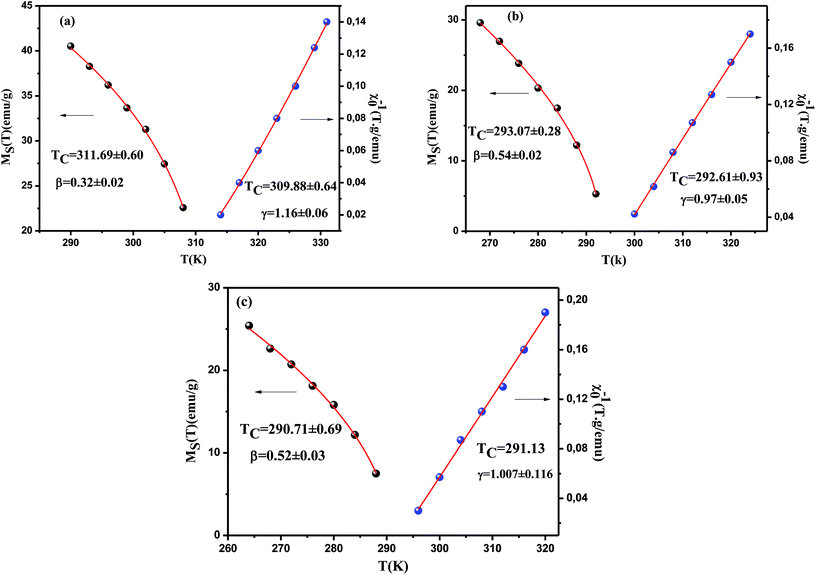
According to the modified Arrott plots, we could calculate the values of the spontaneous magnetization MS(T) and the inverse of susceptibility χ0−1(T). Therefore, the linear extrapolation of the high-field straight-line portion of the isotherm provides the values of MS and χ0−1 as an intercept on the M1/β and the (μ0H/M)1/γ axis, respectively. Temperature dependence of the spontaneous magnetization MS(T) and the inverse susceptibility χ0−1(T) for all compounds obtained from the MAP are shown in Fig. 8. The continuous curves denote the power-law fitting of MS(T,0) and χ0−1(T,0) according to eqn (1) and (2), respectively. Thus, new values of the critical exponents and the Curie temperature associated are also mentioned in the same figure and reported in Table 2 for all samples.
| Samples | Techniques | TC (K) | β | γ | δ | Ref. |
|---|---|---|---|---|---|---|
| La0.7Ca0.1Pb0.2MnO3 | MAP | 311.69 ± 0.60 | 0.32 ± 0.02 | 1.16 ± 0.06 | 4.63 | This work |
| KF | 312.25 ± 0.82 | 0.33 ± 0.02 | 1.20 ± 0.05 | |||
| La0.7Ca0.1Pb0.2Mn0.9Al0.05Sn0.05O3 | MAP | 293.07 ± 0.28 | 0.54 ± 0.02 | 0.97 ± 0.05 | 2.66 | This work |
| KF | 293.46 ± 0.61 | 0.57 ± 0.02 | 0.95 ± 0.04 | |||
| La0.7Ca0.1Pb0.2Mn0.85Al0.075Sn0.075O3 | MAP | 290.71 ± 0.69 | 0.52 ± 0.03 | 1.007 ± 0.116 | 3.3 | This work |
| KF | 290.76 ± 0.55 | 0.50 ± 0.02 | 1.15 ± 0.14 | |||
| Mean field model | Theory | — | 0.5 | 1 | 3 | 81 |
| 3D-Ising mode | Theory | — | 0.325 | 1.24 | 4.82 | 81 |
| Tricritical mean field model | Theory | — | 0.25 | 1 | 5 | 82 |
| 3D-Heseinberg model | Theory | — | 0.365 | 1.336 | 4.8 | 32 |
| Pr0.67Ba0.33Mn0.95Fe0.05O3 | 128 | 0.5 ± 0.026 | 1.007 ± 0.002 | 2.920 | 74 | |
| La0.7Ca0.2Sr0.1MnO3 | 289 | 0.26 | 1.06 | 5.1 | 75 | |
| La0.67Pb0.33MnO3 | 360.41 | 0.367 | 1.22 | 4.29 | 76 | |
| LaMn0.9Ti0.1O3 | 145.3 ± 0.1 | 0.375 ± 0.00 | 1.25 ± 0.02 | 4.11 | 77 | |
| Nd0.7Pb0.3MnO3 | 148 | 0.361 ± 0.001 | 1.325 ± 0.001 | 4.62 | 78 | |
| TbCo1.9Fe0.1 | 303 | 0.541 ± 0.001 | 1.023 ± 0.002 | 2.75 | 79 | |
| La0.7Sr0.3MnO3 | 360 | 0.45 ± 0.02 | 1.08 ± 0.04 | 3.04 | 80 |
Alternatively, a more accurate method to determine the critical exponents β and γ are estimated by the Kouvel–Fisher (KF) method.71 The K–F method is based on the following equations:
 | (13) |
 | (14) |
According to this method, the quantities MS(T)(dMS(T)/dT)−1 and χ0−1(T)(dχ0−1(T)/dT)−1 plotted against temperature in Fig. 9, yield straight lines with slopes 1/β and 1/γ, respectively, and the intercepts on the T axis of the extrapolation of these straight lines to the ordinate equal to zero gives the values of TC. From the linear fit to the plots following the KF method, we have obtained the critical exponents.
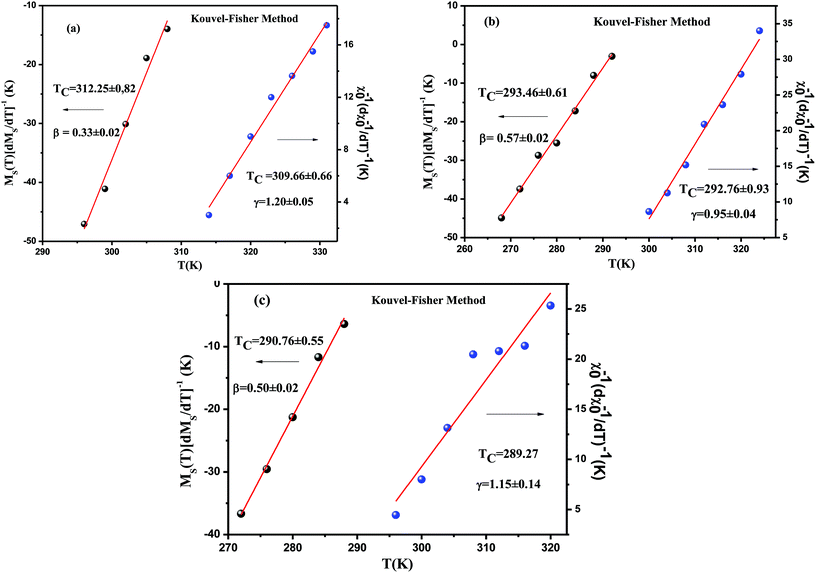 | ||
| Fig. 9 Kouvel–Fisher plots for the spontaneous magnetization MS(T) and the inverse initial susceptibility χ0−1(T) for La0.7Ca0.1Pb0.2MnO3 (a), La0.7Ca0.1Pb0.2Mn0.9Al0.05Sn0.05O3 (b) and La0.7Ca0.1Pb0.2Mn0.9Al0.075Sn0.075O3 (c). Solid lines correspond to the linear fit of MS(T) and χ0−1(T) curves with eqn (14) and (15), respectively. | ||
For x, y = 0.0 sample,
For x, y = 0.05 sample,
For x, y = 0.075 sample,
Obviously, it is clearly remarked that these values are also in agreement with those obtained from modified Arrot plots (MAP). This confirms that the estimated values of the critical exponents are self-consistent and unambiguous. Besides, concerning the final parameter δ, it can be determined directly using the isothermal magnetization M(μ0H) at TC (see in Fig. 10). The inset of the same figure shows the M(μ0H) curve on a log–log scale. According to eqn (3), the value of critical exponent δ can be determined directly from the fitting of the high field region of critical isotherm M(TC,μ0H) on log–log scale as reported in Fig. 10. The obtained value for the currently investigated sample are 4.54, 2.85 and 2.7 for x, y = 0.0, 0.05 and 0.075, respectively.
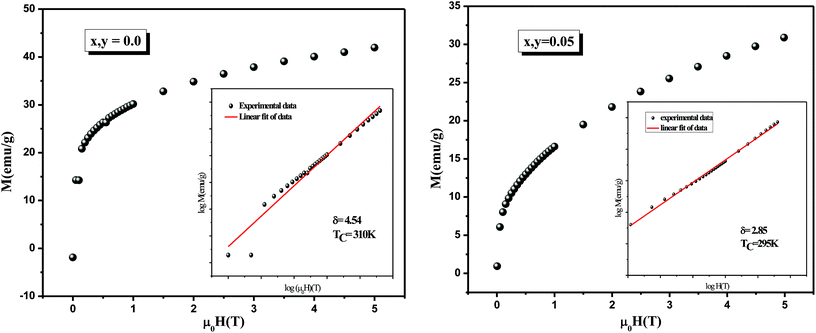 | ||
| Fig. 10 Critical isotherms of M versus μ0H for La0.7Ca0.1Pb0.2Mn1−x−yAlxSnyO3 (x, y = 0.0 and 0.05). The inset: shows the log–log scale for M versus μ0H. | ||
Furthermore, according to the statistical theory, these critical exponents are interrelated and fulfill the Widom scaling law which critical exponents β, γ, and δ are related in following way:72
 | (15) |
The replacement of β and γ determined by Kouvel–Fisher method in eqn (15) donates 4.63, 2.66 and 3.3 as a value of delta for x, y = 0.0, 0.05 and 0.075, respectively, which are so close to those determined by the critical isotherm. This relationship has been tested by plotting M(T = TC) versus μ0Hβ/(β+γ) = μ0H1/δ and checking the linearity of the curve as shown in Fig. 11. Hence, we can conclude that the values of different critical exponents and TC determined for our compounds obey the Widom scaling relation, implying that the obtained β and γ values are auspicious.
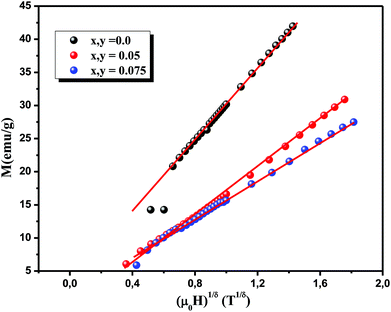 | ||
| Fig. 11 The linearity of the M(T = TC) versus μ0Hβ/(β+γ) = μ0H1/δ curves validates the value of δ calculated using the Widom relationship with the experimental data. | ||
One can notice that the critical exponents of La0.7Ca0.1Pb0.2Mn1−x−yAlxSnyO3 (x, y = 0.0) and La0.7Ca0.1Pb0.2Mn1−x−yAlxSnyO3 (x, y = 0.05 and 0.075) samples match well with those of the 3D-Ising and mean-field model respectively. Therefore, it is important to check if these critical exponents can generate the scaling equation of state for these systems.
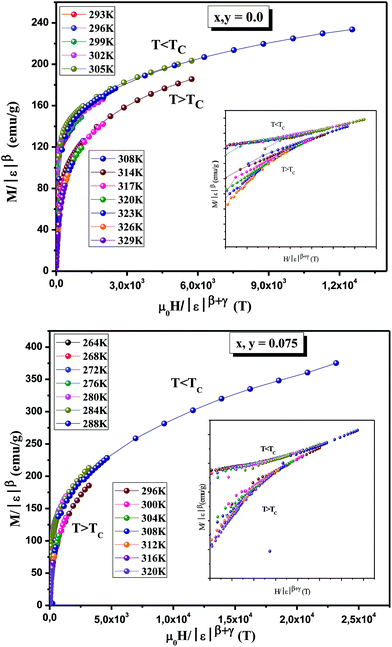
Using the values of β and γ given by the Kouvel Fisher technique (KF), the scaled data are plotted in Fig. 12. For a more convenient visualization of the results, we represent in the inset the same data in a log–log scale. It is clear that all the magnetization data fall on two individual branches, one for T < TC and the other for T > TC. This clearly suggests that the values of the exponents and TC for these samples are reasonably accurate and consistent with the scaling hypothesis. Consequently, the La0.7Ca0.1Pb0.2Mn1−x−yAlxSnyO3 samples undergo the second-order magnetic phase transition. Moreover, the reliability of β, δ and TC can be ascertained by checking the scaling of the magnetization curves. In fact, for magnetic systems, the scaling equation of state takes the form:69
 | (16) |
 vs.
vs.  (Δ = β + γ), should correspond to a universal curve onto which all experimental data points collapse.73
The scaled data are plotted in Fig. 13, using the values of β, γ and TC obtained from the K–F method, for the x, y = 0.05 sample. The excellent overlap of the experimental data points clearly indicates that the critical parameters obtained for these compounds are in agreement with the scaling hypothesis, which further corroborates the reliability of the obtained critical exponents near magnetic transition.
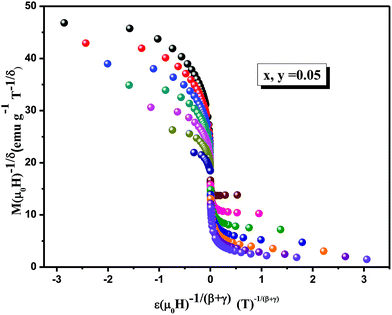 | ||
| Fig. 13 Normalized isotherms of La0.7Ca0.1Pb0.2Mn0.9Al0.05Sn0.05O3 below and above the Curie temperature using the values of β and Δ determined by the K–F method. | ||
This shows that the critical parameters determined are in good agreement with the scaling hypothesis, which further corroborates the reliability of the obtained critical exponents.
To put our obtained results in the context of previous works, the values of the critical exponents for our samples derived from various methods and some other manganites reported in literature,74,80 as well as the theoretical values based on various models,81,82 are summarized in Table 2 for comparison. Clearly, the data in this table support the conclusion that the critical exponents of La0.7Ca0.1Pb0.2MnO3 and La0.7Ca0.1Pb0.2Mn1−x−yAlxSnyO3 (x, y = 0.05 and 0.075) are completely agree with those of the 3D-Ising model and the mean field model, respectively. Therefore, it is important to check if these critical exponents can generate the scaling equation of state for these systems.
In order to demonstrate the influence of the critical exponents on the MCE, we analyzed the dependence of the entropy change on the field. According to Oesterreicher et al., for a material displaying a second order phase transition, the field dependence of ΔSM can be expressed as follows:
| ΔSM = a(μ0H)n | (17) |
 | (18) |
The obtained largest values of n approaching to 2 in the paramagnetic range for T > TC, n = 1 for T < TC,42 and at the peak temperatures TC, the exponent n becomes field independent and is expressed as:83
 | (19) |
 | (20) |
In the following section, we will use the mean-field theory to study the spontaneous magnetization (Mspont) in our samples (x, y = 0.05 and 0.075). A general result issued from a mean-field theory reveals the dependence of the magnetic entropy on the relative magnetization can be described as:86
 | (21) |
 | (22) |
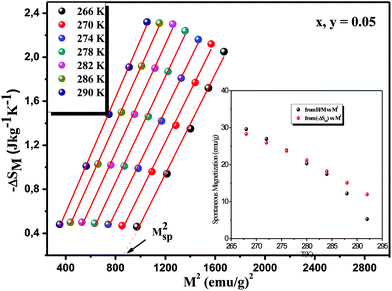
However, in ferromagnetic state (bellow TC) the system has a spontaneous magnetization where σ = 0 state is never attained. After restriction the first term of eqn (22), the magnetic entropy change can be donated by this equation:
 | (23) |
Fig. 14 shows the isothermal −ΔS vs. M2 curves in the ferromagnetic region (T < TC). The isothermal -−ΔSM vs. M2 plots in the ferromagnetic region, shows an horizontal drift from the origin corresponding to the value of MSp2(T), whereas the −ΔSM vs. M2 plots begin at a null M value for T > TC.59 The linear dependence of −ΔSM on M2 is clearly shown in Fig. 14 with an approximately constant slope throughout the FM region. In addition, by linearly extending the −ΔS vs. M2 curves to −ΔS = 0, the values of the spontaneous magnetization MSp at several temperature have been evaluated. We have compared these results of MS with the results obtained from the modified Arrott plot as shown in the inset of Fig. 14. As one can see clearly, an excellent agreement between the two methods indicates the validity of this process to estimate the spontaneous magnetization using a mean-field analysis of the magnetic entropy change in La0.7Ca0.1Pb0.2Mn1−x−yAlxSnyO3 (x, y = 0.05 and 0.075) system.
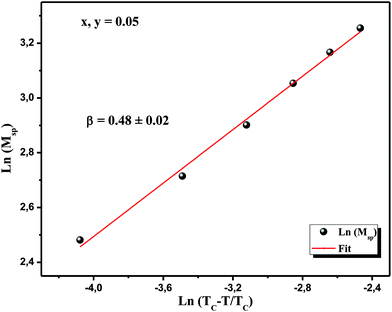
Interestingly, we can further discuss the feasibility and applicability of the mean field theory applied in the above analysis. The spontaneous magnetization can be fitted by using:
 | (24) |
To determine the value of the critical exponent β, we changed this expression to log–log scale. Fig. 15 shows ln(M) vs. ln(TC − T/TC), the linear fitting gives the value of β to be 0.48 ± 0.017 which is consistent with the standard mean field model (β = 0.5).
Here we distinguish an excellent agreement between the experimental value (β = 0.48) and the theoretical value (mean field model, β = 0.5) allows to confirm the validity of this technique to estimate the spontaneous magnetization using a mean-field procedure of the magnetic entropy change.
5. Conclusion
In the present work, we investigated the magnetic, critical exponents and magnetocaloric properties of polycrystalline La0.7Ca0.1Pb0.2Mn1−x−yAlxSnyO3 synthesized by sol–gel method. The values of critical exponents for all samples specimens corresponding to the PM to FM phase transition were extracted using the modified Arrott plot method, Kouvel–Fisher method and critical isotherm analysis. Interestingly, the exponent values founded are so close to values expected for the universality class of 3D-Ising model and mean field model for x = 0.0, 0.05 and 0.075 respectively. The validity of the obtained critical exponents using various methods has been confirmed by the Widom scaling relation and universal scaling hypothesis. We can note that the change in the universality class is due to the relevant disorder introduced by the (Al, Sn) doping.Furthermore, the methodology based on the analysis of the magnetic entropy change (ΔSM) vs. M2, compared with the classical extrapolation of the Arrott curves (μ0H/M vs. M2), confirms that the magnetic entropy change is a valid method to determine the spontaneous magnetization of the La0.7Ca0.1Pb0.2Mn1−x−yAlxSnyO3 system. These exceptional results have a role to get fruitful investigations and we can confirm that the insight gained from the use of different methodologies for a given magnetic system is very interesting.
Conflicts of interest
There are no conflicts to declare.References
- K. A. Gschneidner Jr, V. K. Pecharsky and A. O. Tsokol, Rep. Prog. Phys., 2005, 68, 1479 CrossRef
.
- N. A. de Oliveira and P. J. vonRanke, Phys. Rep., 2010, 489, 89 CrossRef CAS
.
- J. Mira, J. Rivas, F. Rivadulla, C. VaHzquez-vaHzquez and M. A. LoHpez-Quintela, Phys. Rev. B: Condens. Matter Mater. Phys., 1999, 60, 2929 CrossRef
.
- K. Chahara, T. Ohno, M. Kasai and Y. Kosono, Appl. Phys. Lett., 1993, 63, 1990 CrossRef CAS
.
- R. von Helmolt, J. Weeker, B. Holzapfel, L. Schultz and K. Samwer, Phys. Rev. Lett., 1993, 71, 2331 CrossRef CAS PubMed
.
- M. M. Cormack, S. Jin, T. H. Tiefel, R. M. Fleming, J. M. Phillips and R. Ramesh, Appl. Phys. Lett., 1994, 64, 3045 CrossRef
.
- S. Jin, T. H. Tiefel, M. Mc Cormack, R. A. Fastnacht, R. Ramesh and L. H. Chen, Science, 1994, 264, 413 CAS
.
- W. J. Lu, X. Luo, C. Y. Hao, W. H. Song and Y. P. Sun, J. Appl. Phys., 2008, 104, 113908 CrossRef
.
- N. S. Bingham, M. H. Phan, H. Srikanth, M. A. Torija and C. Leighton, J. Appl. Phys., 2009, 106, 023909 CrossRef
.
- A. N. Ulyanov, J. S. Kim, G. M. Shin, Y. M. Kang and S. I. Yoo, J. Phys. D: Appl. Phys., 2007, 40, 123 CrossRef CAS
.
- P. Nisha, S. S. Pillai, A. Darbandi, A. Misra, K. G. Suresh, M. R. Varma and H. Hahn, J. Phys. D: Appl. Phys., 2010, 43, 135001 CrossRef
.
- W. Tang, W. Lu, X. Luo, B. Wang, X. Zhu, W. Song, Z. Yang and Y. Sun, J. Magn. Magn. Mater., 2010, 322, 2360 CrossRef CAS
.
- M. Khlifi, M. Bejar, O. EL Sadek, E. Dhahri, M. A. Ahmed and E. K. Hlil, J. Alloys Compd., 2011, 509, 7410 CrossRef CAS
.
- J. B. Goodenough, J. Appl. Phys., 1997, 81, 5330 CrossRef CAS
.
- A. J. Millis, B. I. Shraiman and R. Mueller, Phys. Rev. Lett., 1996, 77, 175 CrossRef CAS PubMed
.
- C. Zener, Phys. Rev., 1951, 82, 403 CrossRef CAS
.
- J. Dhahri, A. Dhahri, M. Oummezzine and E. K. Hlil, J. Magn. Magn. Mater., 2015, 378, 353–357 CrossRef CAS
.
- C. V. Mohan, M. Seeger, H. Kronmüller, P. Murugaraj and J. Maier, J. Magn. Magn. Mater., 1998, 83, 348 CrossRef
.
- S. Nair, A. Banerjee, A. V. Narlikar, D. Prabhakaran and A. T. Boothroyd, Phys. Rev. B, 2003, 68, 132404 CrossRef
.
- K. Ghosh, C. J. Lobb, R. L. Greene, S. G. Karabashev, D. A. Shulyatev, A. A. Arsenov and Y. Mukovskii, Phys. Rev. Lett., 1998, 81, 4740 CrossRef CAS
.
- N. Mautis, I. Panagiotopoulos, M. Pissas and D. Niarchos, Phys. Rev. B: Condens. Matter Mater. Phys., 1999, 59, 1129 CrossRef
.
- M. Oumezzine, O. Peña, S. Kallel and S. Zemni, Solid State Sci., 2011, 13, 1829–1834 CrossRef CAS
.
- T. L. Phan, S. G. Min, S. C. Yu and S. K. Oh, J. Magn. Magn. Mater., 2006, 304, 778 CrossRef
.
- M. Ziese, J. Phys. Condens. Matter, 2001, 13, 2919 CrossRef CAS
.
- M. H. Phan, V. Franco, N. S. Bingham, H. Srikanth, N. H. Hur and S. C. Yu, J. Alloys Compd., 2010, 508, 238 CrossRef CAS
.
- S. Roler, U. K. Roler, K. Nenkov, D. Eckert, S. M. Yusuf, K. Korr and K. H. Muller, Phys. Rev. B: Condens. Matter Mater. Phys., 2004, 70, 104417 CrossRef
.
- A. Berger, G. Camopillo, P. Vivas, J. E. Pearson, S. D. Bader, E. Baca and P. Prieto, J. Appl. Phys., 2002, 91, 8393 CrossRef CAS
.
- J. Yang and Y. P. Lee, Appl. Phys. Lett., 2007, 91, 142512 CrossRef
.
- J. Yang, Y. P. Lee and Y. Li, Phys. Rev. B: Condens. Matter Mater. Phys., 2007, 76, 054442 CrossRef
.
- R. S. Freitas, C. Haetinger, P. Pureur, J. A. Alonso and L. Ghivelder, J. Magn. Magn. Mater., 2001, 226–230, 569 CrossRef CAS
.
- M. Seeger, S. N. Kaul, H. Kronmüller and R. Reisser, Phys. Rev. B: Condens. Matter Mater. Phys., 1995, 51, 12585 CrossRef CAS
.
- J. L. Alonso, L. A. Fernández, F. Guinea, V. Laliena and V. Martín-Mayor, Nucl. Phys. B, 2001, 596, 587 CrossRef
.
- M. Kar, A. Perumal and S. Ravi, Phys. Status Solidi B, 2006, 243, 1908 CrossRef CAS
.
- A. Olega, A. Salazar, D. Prabhakaran and A. T. Boothroyd, Phys. Rev. B: Condens. Matter Mater. Phys., 2004, 70, 184402 CrossRef
.
- Ma. Oumezzine, O. Peña, S. Kallel and M. Oumezzine, J. Alloys Compd., 2012, 539, 116 CrossRef CAS
.
- Ma. Oumezzine, O. Peña, S. Kallel and S. Zemni, J. Solid State Sci., 13(2011), 1829 CAS
.
- P. Nisha, S. S. Pillai, K. G. Suresh and M. R. Varma, Solid State Sci., 2012, 14, 40–47 CrossRef CAS
.
- A. Dhahri, J. Dhahri, E. K. Hlil and E. Dhahri, J. Alloys Compd., 2012, 530, 1–5 CrossRef CAS
.
- K. Ghosh, C. J. Lobb, R. L. Greene, S. G. Karabashev, D. A. Shulyatev, A. A. Arsenov and Y. Mukovskii, Phys. Rev. Lett., 1998, 81, 4740 CrossRef CAS
.
- J. S. Amaral and V. S. Amaral, J. Magn. Magn. Mater., 2010, 322, 1552 CrossRef CAS
.
- S. Nair, A. Banerjee, A. V. Narlikar, D. Prabhakaran and A. T. Boothroyd, Phys. Rev. B: Condens. Matter Mater. Phys., 2003, 68, 132404 CrossRef
.
- K. Dhahri, N. Dhahri, J. Dhahri, K. Taibi and E. K. Hlil, J. Alloys Compd., 2017, 699, 619–626 CrossRef CAS
.
- H. E. Stanley, Rev. Mod. Phys., 1999, 71, 358 CrossRef
.
- S. N. Kaul, J. Magn. Magn. Mater., 1985, 53, 5 CrossRef CAS
.
- E. Tka, K. Cherif and J. Dhahri, Appl. Phys. A, 2014, 116, 1181–1191 CrossRef CAS
.
- E. Tka, K. Cherif, J. Dhahri and E. Dhahri, J. Alloys Compd., 2011, 509, 8047–8055 CrossRef CAS
.
- Za. Mohamed, M. Abassi, E. Tka, J. Dhahri and E. K. Hlil, J. Alloys and Compds, 2015, 646, 23–31 CrossRef CAS
.
- V. K. Pecharsky, K. A. Gschneidner and A. O. Tsokol, Reports on Progress in Physics, 2005, 68, 1479 CrossRef
.
- D. T. Morelli, A. M. Mance, J. V. Mantese and A. L. Micheli, J. Appl. Phys., 1996, 79, 373 CrossRef CAS
.
- V. K. Pecharsky and K. A. Gschneidner Jr, Phys. Rev. Lett., 1997, 78, 4494 CrossRef CAS
.
- D. N. H. Nam, N. V. Dai, L. V. Hong, N. X. Phyc, S. C. Yu, M. Tachibana and E. Takayama-Muromachi, J. Appl. Phys., 2008, 103, 043905 CrossRef
.
- D. T. Morelli, A. M. Mance, J. V. Mantese and A. L. Micheli, J. Appl. Phys., 1996, 79, 373 CrossRef CAS
.
- Y. Sun, M. B. Salamon and S. H. Chun, J. Appl. Phys., 2002, 92, 3235 CrossRef CAS
.
- X. Bohigas, J. Tejada, E. Del Barco, X. X. Zhang and M. Sales, Appl. Phys. Lett., 1998, 73, 390 CrossRef CAS
.
- N. Chau, H. N. Nhat, N. H. Luong, D. L. Minh, N. D. Tho and N. N. Chau, Phys. B, 2003, 327, 270 CrossRef CAS
.
- V. A. Amaral and J. S. Amaral, J. Magn. Magn. Mater., 2004, 272, 2104 CrossRef
.
- J. S. Amaral, M. S. Reis, V. A. Amaral, T. M. Mendonca, J. P. Araúji, M. A. Sà, P. B. Tvares and J. M. Vieira, J. Magn. Magn. Mater., 2005, 290, 686 CrossRef
.
- M. S. Anwar, S. Kumar, F. Ahmed, N. Arshi, G. W. Kim and B. H. Koo, J. Korean Phys. Soc., 2012, 60, 1587 CrossRef CAS
.
- M. S. Anwar, S. Kumar, F. Ahmed, N. Arshi, G. W. Kim and B. H. Koo, J. Korean Phys. Soc., 2012, 60, 1587 CrossRef CAS
.
- H. Yang, P. Zhang, Q. Wu, H. Ge and M. pan, J. Magn. Magn. Mater., 2012, 324, 3727 CrossRef CAS
.
- R. Venkatesh, M. Pattabiraman, K. Sethupathi, G. Rangarajan, S. Angappane and J.-G. Park, J. Appl. Phys., 2008, 103, 07B319. 17 CrossRef
.
- S. Das and T. K. Dey, J. Phys.: Condens. Matter, 2006, 18, 7629 CrossRef CAS PubMed
.
- V. S. Amaral and J. S. Amaral, J. Magn. Magn. Mater., 2004, 272–276, 2104 CrossRef CAS
.
- H. Yang, Y. H. Zhu, T. Xian and J. L. Jiang, J. Alloys Compd, 2013, 555, 150 CrossRef CAS
.
- A. V. Deshmukh, S. I. Patil, S. M. Bhagat, P. R. Sagdeo, R. J. Choudhary and D. M. Phase, J. Phys. D: Appl. Phys., 2009, 42, 185410 CrossRef
.
- P. Dey and T. K. Nath, Phys. Rev. B: Condens. Matter Mater. Phys., 2006, 73, 214425 CrossRef
.
- H. J. Blythe and V. M. Fedosyuk, J. Phys.: Condens. Matter, 1995, 7, 3461 CrossRef
.
- B. K. Banerjee, Phys. Lett., 1964, 12, 16 CrossRef
.
- H. E. Stanley, Introduction to Phase Transitions and Critical Phenomena, Oxford University Press, London, 1971 Search PubMed
.
- A. Arrott and J. E. Noakes, Phys. Rev. Lett., 1967, 19, 786 CrossRef CAS
.
- J. S. Kouvel and M. E. Fisher, Phys. Rev., 1964, 136, A1626 CrossRef
.
- B. Widom, Degree of the critical isotherm, J. Chem. Phys., 1964, 41, 1633 CrossRef
.
- R. M'nassri, N. ChnibaBoudjada and A. Cheikhrouhou, J. Alloys Compd, 2015, 640, 183 CrossRef
.
- M. Baazaoui, Sobhi Hcini, Michel Boudard, Sadok Zemni and Mohamed Oumezzine, J. Magn. Magn. Mater., 2016, 401, 323–332 CrossRef CAS
.
- M. H. Phan, V. Franco, N. S. Bingham, H. Srikanth, N. H. Hur and S. C. Yu, J. Alloy. Comp, 2010, 508, 238 CrossRef CAS
.
- N. Dhahri, J. Dhahri, E. K. Hlil and E. Dhahri, J. Magn. Magn. Mater., 2012, 324, 806 CrossRef CAS
.
- J. Yang and Y. P. Lee, Appl. Phys. Lett., 2007, 91, 142512 CrossRef
.
- N. Ghosh, S. Rößler, U. K. Rößler, K. Nenkov, S. Elizabeth, H. L. Bhat, K. Dörr and K. H. Müller, J. Phys.: Condens. Matter, 2006, 18, 557 CrossRef CAS
.
- M. Halder, S. M. Yusuf and M. D. Mukada, Phys. Rev. B: Condens. Matter Mater. Phys., 2010, 81, 174402 CrossRef
.
- M. Ziese, J. Phys.: Condens. Matter, 2001, 13, 2919 CrossRef CAS
.
- S. N. Kaul, J. Magn. Magn. Mater., 1985, 53, 5 CrossRef CAS
.
- K. Huang, Statistical Mechanics, Wiley, New York, 2nd edn, 1987 Search PubMed
.
- V. Franco, J. S. Blazquez and A. Conde, Appl. Phys. Lett., 2006, 89, 222512 CrossRef
.
- M. Pękała, J. Appl. Phys., 2010, 108, 113913 CrossRef
.
- V. Franco, J. S. Blázquez and A. Conde, J. Appl. Phys., 2008, 103, 07B316 CrossRef
.
- J. S. Amaral, N. J. O. Silva and V. S. Amaral, J. Magn. Magn. Mater., 2010, 322, 1569 CrossRef CAS
.
| This journal is © The Royal Society of Chemistry 2017 |

