 Open Access Article
Confined-space synthesis of nanostructured anatase, directed by genetically engineered living organisms for lithium-ion batteries†
Hang
Ping
a,
Hao
Xie
*b,
Mingyu
Xiang
a,
Bao-Lian
Su
c,
Yucheng
Wang
a,
Jinyong
Zhang
a,
Fan
Zhang
a and
Zhengyi
Fu
*a
aState Key Laboratory of Advanced Technology for Materials Synthesis and Processing, Wuhan University of Technology, Wuhan, 430070, China. E-mail: zyfu@whut.edu.cn
bSchool of Chemistry, Chemical Engineering, and Life Science, Wuhan University of Technology, Wuhan, 430070, China. E-mail: h.xie@whut.edu.cn
cLaboratory of Inorganic Materials Chemistry, University of Namur, Namur, B-5000, Belgium
First published on 14th July 2016
Abstract
Biomineral formation processes in nature are temporally and spatially regulated under the functions of biomolecules in a confined space. It is potentially very productive to rationally design a mineralized system by taking into account confined space as well as biomolecules. The laboratory technique of “bacterial cell surface display” is an ideal platform to host catalytically active proteins in a three-dimensionally confined space. In the present study, aiming to regulate the synthesis of nanostructured TiO2 anatase, repeating segments of silaffin were displayed on Escherichia coli surfaces through genetic manipulation. The displayed protein electrostatically interacted with a titanium source and catalyzed the hydrolysis of titanium dioxide precursors through hydrogen bonding interactions on the cell surface. In the subsequent calcination process, the genetically modified cells not only served as a framework for producing rod-shaped TiO2 assembled by nanoparticles, but also provided a carbon source in situ. The size of nanoparticles was controlled by changing the number of tandem repeats of the protein segment. The as prepared TiO2 anatase exhibited unique characteristics including nanosized anatase crystals, mesoporous structure and carbon coating. When tested as the anode electrode of a lithium-ion battery, it showed excellent lithium storage performance. The carbon coated anatase anode shows a higher specific capacity of 207 mA h g−1 after 200 cycles at a current rate of 1C and an ultra-long cycling lifetime of 5000 cycles with an outstanding retention capacity of 149 mA h g−1 at a higher rate of 10C. This bioprocess-inspired approach may help broaden the scope and impact of nanosized biominerals.
Introduction
Over billions of years of evolution, living organisms have become very efficient at synthesizing biominerals with exquisite morphology and hierarchical structure.1 The amazing structure-formation processes for biominerals can inspire a wide range of advanced techniques for fabricating new materials. Learning from the biomineral-forming process, the concept of “bioprocess-inspired fabrication” has been put forward.2,3 The natural process of biomineral formation is temporally and spatially regulated under the functions of biomolecules in a confined space.4 It is believed that soluble proteins determine the morphology, orientation and polymorph type of a biomineral within a confined space.5,6 Biomolecules and confined space are the two indispensable factors and play complementary roles in the elaborate structure and morphology of biominerals. But, only considering biomolecules may lead to low controllability of size and structure of products in vitro.7,8 Similarly, taking advantage of only artificially confined space may yield products with erratic composition and morphology.9,10 Therefore, in order to investigate the natural formation process deeply, it is necessary to choose an appropriate system that combines the two factors to direct the synthesis of materials.11–16The cell surface display technique allows the expression of desired proteins on the cell surface, which provides an ideal platform for biomolecules in a confined space. Genetically engineered cell surfaces with displayed mineral proteins can direct the growth of minerals under a range of controlled temporal and spatial variations. Furthermore, they permit a wider selection of proteins to be employed in synthesizing materials and precisely controlling size distribution through protein modification.17 An amyloid or M13 virus serves as an integrated biomolecule in a one-dimensionally confined space to induce the synthesis of wire-shaped minerals.11–14 Two-dimensional confined systems have been established by depositing the biomolecules on a proper matrix to control the monodispersity of nanoparticles.15,16 For mineralization in a one- or two-dimensionally confined space, it is not easy to realize and tune the exquisite structures that are found in biominerals. Since the cell surface supports a three-dimensionally confined space, it can be applied to synthesize materials with a three-dimensional architecture composed of nanoparticles. To date, relevant work is very limited, and the composition and structure of products both need further study.18–20
The present study aims to explore a cell surface capable of displaying a catalytically active protein to direct the synthesis of nanostructured anatase TiO2 in a three-dimensionally confined space. Titanium dioxide is one of the widely studied materials, due to its numerous potential applications, including energy conversion and storage.21–24 To improve a sample's lithium storage capacity, possible solutions are devoted to reducing particle size and adding conductive carbon, which can efficiently shorten the Li-ion diffusion pathway and enhance electron conductivity respectively.25,26 We propose that genetically engineered cells will not only serve as a framework to fabricate rod-shaped TiO2 assembled by nanoparticles, but also provide a carbon source to uniformly coat carbon onto the exposed surfaces of nanoparticles. The nanostructured anatase anode, as an anode material for lithium-ion batteries, exhibits excellent specific capacity, rate capability and ultra-long cycling lifetime.
Results and discussion
Biological activity of recombinant protein on the surface of E. coli
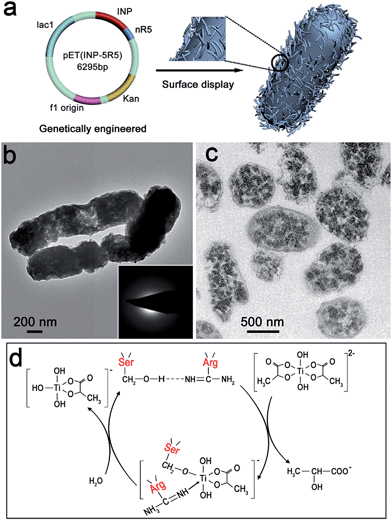
In consideration of cytocompatibility and mineral-formation activities,8,27 three artificial proteins nR5 (n = 1, 3, 5), containing different numbers of repeating segments of R5, were chosen and displayed on the surface of Escherichia coli (E. coli). Peptide R5 is the building block of silaffin and can efficiently induce the formation of TiO2.8 The artificial protein nR5 was genetically inserted downstream of an ice nucleation protein (INP) that served as an anchor for nR5 on the E. coli surface (Fig. 1a). INP is an efficient and stable carrier protein, which can transport a fused protein through the complex cell envelope structure and is resistant to attack or detachment.28 The expression and size of INP-fused nR5 (INP-nR5) was determined through gel electrophoresis analysis (Fig. S1†). Exclusive display of INP-nR5 was observed in the outer membrane of E. coli.Interactions between the genetically engineered bacterial surface and the titanium source solution were investigated by electron microscopy. When titanium(IV)bis(ammonium lactato) dihydroxide solution (TiBALDH) was mixed with INP-modified E. coli cells at 37 °C, smooth cell surfaces were observed (Fig. S2a†). When TiBALDH solution was mixed with E. coli cells with INP-5R5 on the surface at 37 °C, there was a significant change in the surface roughness of INP-5R5 modified E. coli, implying the deposition of titanium dioxide precursors on the cell surface (Fig. 1b and S2b†). Microtome TEM images clearly display the deposition of precursor under the function of 5R5 (Fig. 1c). Since 5R5 has a high positive charge due to the lysine richness of its sequence,7 it facilitates the interaction between the cell surface and a negatively charged titanium source, which results in accumulation of precursor particles on the cell surface. The amorphous nature of precursor particles was revealed by selected area electron diffraction (SAED) (Fig. 1b insets) and X-ray diffraction (XRD) (Fig. S2g†).
After continuously incubating the products at 80 °C, INP-modified cells displayed smooth surfaces (Fig. S2c and e†), whereas more curved and rougher surfaces were obtained for 5R5-modified cells (Fig. S2d and f†). A high-magnification image shows nanoparticles on the surface. The weak and broad peak at 26° implies the existence of anatase crystal nuclei (Fig. S2h†), which benefit from the enzymatically catalytic activity of 5R5, containing many serine (Ser) and arginine (Arg) amino acids (Fig. S3†).
Hydrogen bonding occurred between the hydroxyl group of serine (Ser) and the imino group nitrogen of arginine (Arg) at the carbonyl carbon (Fig. 1d), which increased the nucleophilicity of the hydroxyl oxygen. This facilitated nucleophilic attack on the substrate titanium center, leading to hydrolysis and condensation.7,29,30 Nucleophilic attack was followed by elimination of 2-hydroxy propionic acid and the formation of a Ser–O–Ti intermediate, and nitrogen donation from Arg potentially stabilized the intermediate. The reaction between the intermediate and water led to the formation of Ti–OH bonding via hydrolysis. Finally, condensation occurred between Ti–OH bonds, which formed the titanium dioxide framework, and the anatase nuclei appeared after incubation at 80 °C.
Synthesis of nanostructured anatase with controlled size
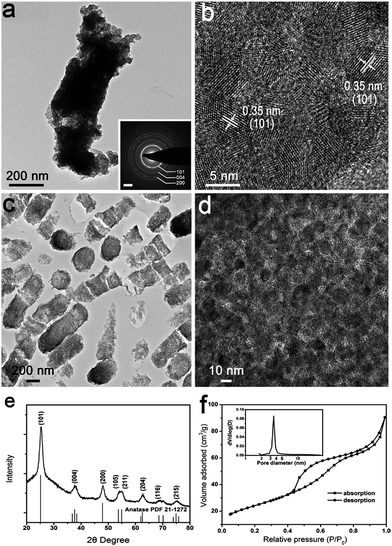
The rod-shaped structure of the precursor coated cells was retained with slight shrinkage after calcination at 600 °C for 4 h in air (denoted as 5-TiO2). The E. coli cells served as a framework or template for formation of rod-shaped TiO2 (Fig. 2a and S4a†). Nanoparticles with an average size of 5 nm are clearly observed through the tip of a representative broken rod (Fig. 2b). Polycrystallinity of the rod-shaped structure was confirmed by SAED (Fig. 2a inset). The crystallographic phase was indexed to anatase TiO2 (JCPDS no. 21-1271) by XRD analysis (Fig. 2e), and the interplanar spacing of 0.35 nm was assigned to the (101) plane of anatase (Fig. 2b). However, when INP-modified cells were subjected to calcination, tetragonal particles aggregated together, and the rod-shaped structure of the bacteria collapsed (Fig. S4b†).A nitrogen adsorption–desorption isotherm (IV type) indicates products with mesoporous structures and pore sizes mainly in the range of 3–4 nm (Fig. 2f inset). The specific surface area and pore volume were determined to be 87.8 m2 g−1 and 0.14 cm3 g−1, respectively (Fig. 2f). In order to observe the internal structure of the rod-shaped TiO2, ultramicrotomy was employed to cut specimens into ultra-thin sections (about 100 nm). The longitudinal and transverse sections of TiO2 were distinctly identified from a microtome TEM image (Fig. 2c). The central region of a transverse section exhibits a coherent mesoporous structure. The gap size between nanoparticles corresponds to the results of pore-distribution analysis (Fig. 2d).
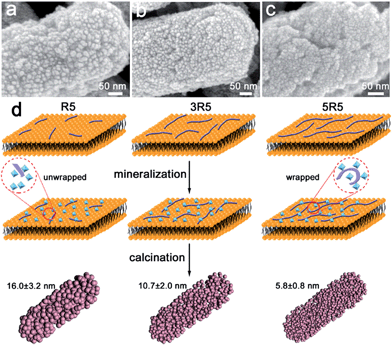
Surface-displayed protein 5R5 plays an important role in the formation of 5 nm anatase nanoparticles. Because cationic 5R5 may accumulate and hydrolyse oppositely charged TiBALDH molecules, the products of hydrolysis deposited around the protein domain and then were wrapped by proteins. The growth and aggregation of titanium dioxide nanoparticles could been prohibited by the entangled protein network.15,31,32 When the number of tandem repeats of 5R5 was reduced, the entangled network effect was weakened, resulting in increased particle size. In each sample, R5 segments with a particular number of repeated units (R5, 3R5 and 5R5) were displayed on the surface of E. coli. Hence, the anatase phase was obtained with the same number of R5 repeating segments (Fig. S5a†). However, the rod-shaped structure was assembled of nanoparticles of different sizes (denoted as 1-TiO2 and 3-TiO2, respectively) (Fig. 3). The particle size was slightly larger when the number of repeated R5 segments was lower. The specific surface areas of 1-TiO2, 3-TiO2 and 5-TiO2 were determined to be 56.2, 78.5 and 87.8 m2 g−1, respectively (Fig. S5b†).
Synthesis of carbon coated nanostructured anatase
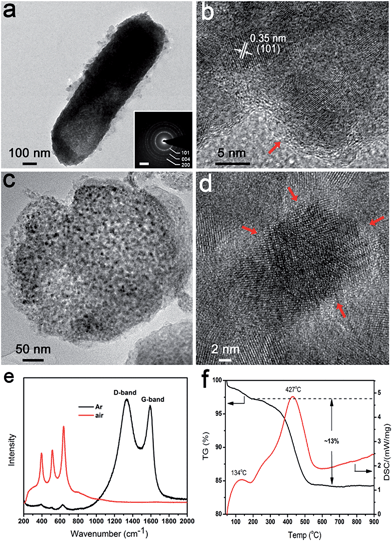
In our system, the bacteria both served as a confining framework and provided an in situ carbon source during calcination to avoid joining a second phase.33 When annealing was done at 600 °C for 4 h in Ar, the same anatase phase was obtained (denoted as carbon coated TiO2 (5-TiO2/C)) (Fig. S6†). There was no significant difference between heating treatment in air and Ar, in terms of morphology and particle size of anatase (Fig. S7†). In particular, the particle size of the exterior structure in 5-TiO2/C is the same as that of the interior. Fig. 4a shows a TEM image of a representative carbon coated rod-shaped structure, which is about 300 nm in diameter and 1 μm in length. The SAED pattern also indicates the polycrystalline nature of the products (Fig. 4a inset). As evident in Fig. 4b, a carbon layer, 1–2 nm thick, uniformly coats the surface of the nanoparticles. Energy-dispersive spectroscopy (EDS) elemental mapping images also confirm the uniform distribution of Ti, O and C (Fig. S8†). The cross-sectional TEM image of 5-TiO2/C also shows the evident mesoporous structure after carbonization (Fig. 4c). To explore the behavior of carbon coating in the interior structure, a high magnification TEM image of the central area in Fig. 4c reveals that there is amorphous carbon coating on the exposed surface of the nanoparticles (Fig. 4d). The carbon coating is marked by red arrows. The Raman spectra show two characteristic peaks at 1370 cm−1 and 1592 cm−1, which correspond to the D-band (disorder carbon) and G-band (graphitic carbon), respectively (Fig. 4e). The peaks at 397, 516 and 640 cm−1 are in accordance with the B1g, A1g, and Eg modes of the anatase phase.34 No characteristic carbon peaks are detected in 5-TiO2. The carbon content was determined by thermogravimetric (TG) analysis (Fig. 4f). The exothermic peak at 134 °C is attributed to the evaporation of absorbed water, and the weight loss below 200 °C is about 2.5 wt%. The exothermic peak at 427 °C is ascribed to the oxidation of carbon to carbon dioxide; the carbon content is about 13 wt%. The content agrees with the calculated result of a model of the exposed surface coated by carbon (Fig. S9†).The genetically engineered bacteria offer attractive advantages for the synthesis of nanostructured anatase (Fig. 5). The multifunctional protein nR5 displayed on the bacterial surface can interact with a titanium source electrostatically. The hydrolysis and condensation of precursors occur via hydrogen bond catalysis, leading to deposition of anatase nuclei on cell surfaces. The protein domains confine the growth and prohibit aggregation of anatase nanoparticles during heat treatment. The bacteria provide a three-dimensionally confined space as a template to maintain the rod structure composed of nanoparticles after calcination. The generation of coherent mesoporous structures may be from the decomposition of bioorganic compounds in bacteria. The bioorganic compounds serve as a carbon source through carbonization, so exposed nanoparticles surface coated by carbon can be achieved.
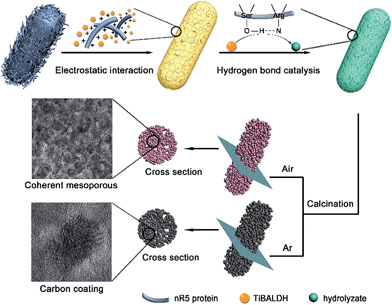 | ||
| Fig. 5 Schematic of genetically engineered design strategy toward the confined space synthesis of nanostructured anatase. | ||
Electrochemical performance of nanostructured anatase
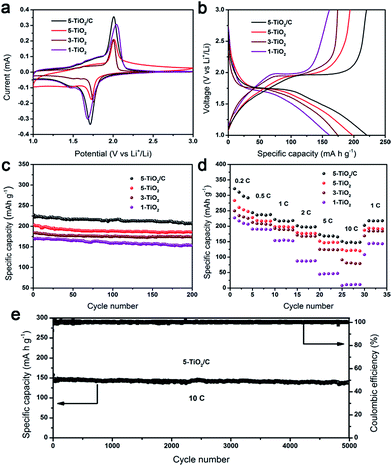
To evaluate the electrochemical characteristics of this unique structure, the products were fabricated into anodes for LIBs. Fig. 6a shows the cyclic voltammetry (CV) curves of the n-TiO2 (n = 1, 3, 5) and 5-TiO2/C electrodes at a scanning rate of 0.1 mV s−1. The two well-defined current peaks at about 1.75 V and 2.0 V are attributed respectively to the insertion and extraction of Li+ ions in anatase phase. Fig. 6b presents the charge–discharge profile voltage of electrodes at a current of 1C, showing the 5-TiO2/C electrode to have the highest specific capacity among all the electrode samples. The charge and discharge capacities of the 5-TiO2/C electrode in the first cycle are 213 mA h g−1 and 264 mA h g−1, respectively (Fig. S10†). The 19.3% irreversible capacity loss is ascribed mainly to the formation of a solid electrolyte interface (SEI) layer.35 Stable charge and discharge capacities were observed following cycling, with higher columbic efficiency and about 97% retention.The cycling behavior of electrodes was investigated at a current of 1C (Fig. 6c). Clearly, all samples possessed superior capacity retention after 200 cycles, and 5-TiO2/C showed the highest reversible capacity of 207 mA h g−1. Note that the specific capacity value was calculated using the TiO2/C composite. The reversible specific capacities of 5-TiO2, 3-TiO2, and 1-TiO2 after 200 cycles were determined to be 186, 174 and 154 mA h g−1, respectively. It was also determined that particle size substantially influences lithium storage capability, because smaller particles shorten the transport distance for Li+ ions in the crystal phase and enhance surface Li storage, due to the higher specific surface area.36 At higher current rates of 5C and 10C, specific capacities delivered by 5-TiO2/C electrodes were 165 mA h g−1 and 149 mA h g−1, respectively, after 200 cycles (Fig. S11†).
To demonstrate structural stability during cycling, post-mortem studies of 5-TiO2 and 5-TiO2/C electrodes after 200 charge–discharge cycles at the current rate of 1C were undertaken. The rod-shaped structures were found to have been retained well, and the nanoparticles remained uniformly coated on the surface (Fig. S12a–d†), which is important to maintain structural stability and reversible capacity. The elemental mapping images of 5-TiO2/C (Fig. S12e–h†) also reveal a homogeneous distribution of Ti, O and C on the rod-shaped anatase after 200 cycles, suggesting that this structure suppresses the aggregation of nanoparticles during cycling.
The rate capability of the two electrodes was examined at different rates of 0.2C, 0.5C, 1C, 2C, 5C, and 10C (Fig. 6d). It was found that the specific capacities of 5-TiO2/C (varied at 275, 234, 218, 199, 175 and 153 mA h g−1) were higher than those of 5-TiO2 (varied at 227, 217, 188, 176, 153 and 123 mA h g−1) at each testing rate. Importantly, all electrodes recovered to the initial capacity of 1C after a high rate of 10C, manifesting their high reversibility. However, compared to 5-TiO2/C and 5-TiO2 electrodes, the specific capacity of a commercial 5 nm powder electrode was the lowest, varying at 189, 178, 165, 156, 125 and 92 mA h g−1 at each testing rate. Because the commercial 5 nm powder is prone to aggregation, it hinders Li+ and electron transport and lowers the specific capacity (Fig. S13†). A similar phenomenon was seen when comparing commercial 15 nm powder and 1-TiO2 electrodes. It is interesting that the 5-TiO2/C electrode has an ultra-long cycling lifetime of 5000 cycles with an outstanding retention capacity of 149 mA h g−1 and almost no capacity loss at a rate of 10C (Fig. 6e). To the best of our knowledge, the electrochemical performance of the 5-TiO2/C electrode is one of the best among the anatase TiO2 based materials (Table S1†).
To explore the superior electrochemical performance, electrochemical impedance spectroscopy (EIS) spectra were obtained to analyze the kinetic process of intercalation materials. Nyquist plots, containing semicircular and linear Warburg regions, of 5-TiO2/C and 5-TiO2 electrodes are presented in Fig. 7a. The semicircle in the middle frequency region is related to charge transfer resistance (Rct), indicating Li+ transfer across the interface between the electrolyte and electrode.37,38 The equivalent circuit (Fig. 7a inset) and fitting results (Table S2†) suggest that the Rct value of the 5-TiO2/C electrode is much lower than that of the 5-TiO2 electrode (45.9 Ω vs. 69.6 Ω). The reduction of Rct suggests that the improved electrical conductivity is attributable to the interparticle contact with the carbon layers.39
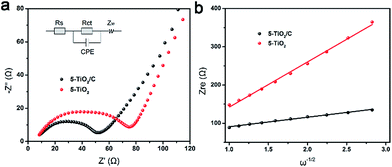 | ||
| Fig. 7 Kinetic process analysis of anatase anode. (a) Nyquist plots of 5-TiO2/C and 5-TiO2 electrodes. (b) Relationship between Zre plotted against ω−0.5. | ||
In addition to electronic conductivity, the Li+ apparent diffusion coefficient (DLi+) of the 5-TiO2/C electrode is also higher than that of 5-TiO2 electrode. The value of DLi+ was calculated from the Nyquist plots at low frequency according to ref. 37
| DLi+ = R2T2/2A2n4F4C2σ2 | (1) |
We believe that the unique nanostructure of the anatase electrode is beneficial to the high capacity and enhanced stability for several reasons. First, nanosized particles reduce the lithium ion transport distance, which improves rate capability and cycle life compared to a bulk electrode. The unique structure assembled by nanoparticles can efficiently avoid the stacking or aggregation of nanoparticles. Second, the mesoporous structure can tolerate the volume change during lithium ion insertion and extraction, provides more channels for lithium ion diffusion and prevents the collapse of the electrode. The 5-TiO2/C material not only possesses the above structural characteristics, but also has an additional carbon coating on the nanoparticle surfaces, which improves the intrinsically poor conductivity of anatase and limits the amount of SEI.40 Therefore, a bi-continuous 5-TiO2/C electrode can facilitate rapid lithium ion and electron diffusion, while exhibiting higher capacity and better rate capability than those of the 5-TiO2 electrode.
Conclusions
The cell surface display technology consolidates catalytically active proteins in a three-dimensionally confined space. It was adopted to direct the synthesis of nanostructured anatase. Briefly, an artificial protein, 5R5, was displayed on the surface of E. coli through the function of INP. The positively charged 5R5 interacted with a negatively charged titanium source through electrostatic interaction. The hydrogen bonding interaction catalysed the hydrolysis and condensation of titanium dioxide precursors on the E. coli cell surface. Upon heat treatment, E. coli cells acted as framework, to allow the transformation of titanium dioxide precursors into well-assembled 5 nm anatase TiO2 nanoparticles. Carbon coating on the assembled anatase TiO2 nanoparticles was achieved by annealing in an inert atmosphere. Furthermore, the size of nanoparticles was controlled by changing the number of tandem repeated units in R5 segments. As an anode electrode, this unique nanostructured anode – with nanosized anatase crystals, mesoporous structure and carbon coating – is superior in specific capacity, rate capability and cycling stability compared to conventional electrodes.Acknowledgements
This work was financially supported by the National Natural Science Foundation of China (51521001) and the Ministry of Science and Technology of the People’s Republic of China (2015DFR50650). We acknowledge Miss Ting-ting Luo (Center for Materials Re-search and Analysis, Wuhan University of Technology) for her help in HRTEM analysis. We are grateful to Bi-Chao Xu of the Core Facility and Technical Support, Wuhan Institute of Virology for her technical support in sample embedding.Notes and references
- C. Sanchez, H. Arribart and M. M. G. Guille, Nat. Mater., 2005, 4, 277–288 CrossRef CAS PubMed.
- J. J. Xie, H. Xie, B. L. Su, Y. B. Cheng, X. D. Du, H. Zeng, M. H. Wang, W. M. Wang, H. Wang and Z. Y. Fu, Angew. Chem., Int. Ed., 2016, 55, 3031–3035 CrossRef CAS PubMed.
- H. Ping, H. Xie, B. L. Su, Y. B. Cheng, W. M. Wang, H. Wang, Y. C. Wang, J. Y. Zhang, F. Zhang and Z. Y. Fu, J. Mater. Chem. B, 2015, 3, 4496–4502 RSC.
- J. Mahamid, B. Aichmayer, E. Shimoni, R. Ziblat, C. H. Li, S. Siegel, O. Paris, P. Fratzl, S. Weiner and L. Addadi, Proc. Natl. Acad. Sci. U. S. A., 2010, 107, 6316–6321 CrossRef CAS PubMed.
- L. B. Gower, Chem. Rev., 2008, 108, 4551–4627 CrossRef CAS PubMed.
- C. J. Stephens, S. F. Ladden, F. C. Meldrum and H. K. Christenson, Adv. Funct. Mater., 2010, 20, 2108–2115 CrossRef CAS.
- R. L. Brutchey and D. E. Morse, Chem. Rev., 2008, 108, 4915–4934 CrossRef CAS PubMed.
- N. Kroger, M. B. Dickerson, G. Ahmad, Y. Cai, M. S. Haluska, K. H. Sandhage, N. Poulsen and V. C. Sheppard, Angew. Chem., Int. Ed., 2006, 45, 7239–7243 CrossRef CAS PubMed.
- Y. Y. Kim, N. B. J. Hetherington, E. H. Noel, R. Kroger, J. M. Charnock, H. K. Christenson and F. C. Meldrum, Angew. Chem., Int. Ed., 2011, 50, 12572–12577 CrossRef CAS PubMed.
- A. S. Schenk, E. J. Albarracin, Y. Y. Kim, J. Ihli and F. C. Meldrum, Chem. Commun., 2014, 50, 4729–4732 RSC.
- S. Bolisetty, J. Adamcik, J. Heier and R. Mezzenga, Adv. Funct. Mater., 2012, 22, 3424–3428 CrossRef CAS.
- P. Y. Chen, X. N. Dang, M. T. Klug, J. F. Qi, N. M. D. Courchesne, F. J. Burpo, N. Fang, P. T. Hammond and A. M. Belcher, ACS Nano, 2013, 7, 6563–6574 CrossRef CAS PubMed.
- X. N. Dang, H. J. Yi, M. H. Ham, J. F. Qi, D. S. Yun, R. Ladewski, M. S. Strano, P. T. Hammond and A. M. Belcher, Nat. Nanotechnol., 2011, 6, 377–384 CrossRef CAS PubMed.
- Y. J. Lee, H. Yi, W. J. Kim, K. Kang, D. S. Yun, M. S. Strano, G. Ceder and A. M. Belcher, Science, 2009, 324, 1051–1055 CAS.
- E. Kharlampieva, T. Tsukruk, J. M. Slocik, H. Ko, N. Poulsen, R. R. Naik, N. Kroger and V. V. Tsukruk, Adv. Mater., 2008, 20, 3274–3279 CrossRef CAS.
- R. Andre, M. N. Tahir, H. C. C. Schroder, W. E. G. Muller and W. Tremel, Chem. Mater., 2011, 23, 5358–5365 CrossRef CAS.
- C. Rosant, B. Avalle, D. Larcher, L. Dupont, A. Friboulet and J. M. Tarascon, Energy Environ. Sci., 2012, 5, 9936–9943 CAS.
- W. E. G. Muller, S. Engel, X. H. Wang, S. E. Wolf, W. G. Tremel, N. L. Thakur, A. Krasko, M. Divekar and H. C. Schroder, Biomaterials, 2008, 29, 771–779 CrossRef PubMed.
- P. Curnow, P. H. Bessette, D. Kisailus, M. M. Murr, P. S. Daugherty and D. E. Morse, J. Am. Chem. Soc., 2005, 127, 15749–15755 CrossRef CAS PubMed.
- P. Curnow, D. Kisailus and D. E. Morse, Angew. Chem., Int. Ed., 2006, 45, 613–616 CrossRef CAS PubMed.
- J. S. Chen, Y. L. Tan, C. M. Li, Y. L. Cheah, D. Y. Luan, S. Madhavi, F. Y. C. Boey, L. A. Archer and X. W. Lou, J. Am. Chem. Soc., 2010, 132, 6124–6130 CrossRef CAS PubMed.
- W. Q. Wu, Y. F. Xu, H. S. Rao, C. Y. Su and D. B. Kuang, J. Am. Chem. Soc., 2014, 136, 6437–6445 CrossRef CAS PubMed.
- Y. X. Tang, Y. Y. Zhang, J. Y. Deng, J. Q. Wei, H. L. Tam, B. K. Chandran, Z. L. Dong, Z. Chen and X. D. Chen, Adv. Mater., 2014, 26, 6111–6118 CrossRef CAS PubMed.
- Y. X. Tang, Y. Y. Zhang, W. L. Li, B. Ma and X. D. Chen, Chem. Soc. Rev., 2015, 44, 5926–5940 RSC.
- J. Y. Shin, D. Samuelis and J. Maier, Adv. Funct. Mater., 2011, 21, 3464–3472 CrossRef CAS.
- S. H. Yu, D. J. Lee, M. Park, S. G. Kwon, H. S. Lee, A. Jin, K. S. Lee, J. E. Lee, M. H. Oh, K. Kang, Y. E. Sung and T. Hyeon, J. Am. Chem. Soc., 2015, 137, 11954–11961 CrossRef CAS PubMed.
- S. H. Yang, E. H. Ko and I. S. Choi, Langmuir, 2012, 28, 2151–2155 CrossRef CAS PubMed.
- S. Y. Lee, J. H. Choi and Z. H. Xu, Trends Biotechnol., 2003, 21, 45–52 CrossRef CAS PubMed.
- D. Kisailus, Q. Truong, Y. Amemiya, J. C. Weaver and D. E. Morse, Proc. Natl. Acad. Sci. U. S. A., 2006, 103, 5652–5657 CrossRef CAS PubMed.
- R. L. Brutchey, E. S. Yoo and D. E. Morse, J. Am. Chem. Soc., 2006, 128, 10288–10294 CrossRef CAS PubMed.
- E. Kharlampieva, C. M. Jung, V. Kozlovskaya and V. V. Tsukruk, J. Mater. Chem., 2010, 20, 5242–5250 RSC.
- E. Kharlampieva, J. M. Slocik, S. Singamaneni, N. Poulsen, N. Kroger, R. R. Naik and V. V. Tsukruk, Adv. Funct. Mater., 2009, 19, 2303–2311 CrossRef CAS.
- H. Q. Li and H. S. Zhou, Chem. Commun., 2012, 48, 1201–1217 RSC.
- Z. S. Hong, M. D. Wei, T. B. Lan, L. L. Jiang and G. Z. Cao, Energy Environ. Sci., 2012, 5, 5408–5413 CAS.
- S. H. Yu, D. E. Conte, S. Baek, D. C. Lee, S. K. Park, K. J. Lee, Y. Piao, Y. E. Sung and N. Pinna, Adv. Funct. Mater., 2013, 23, 4293–4305 CrossRef CAS.
- R. Mo, Z. Lei, K. Sun and D. Rooney, Adv. Mater., 2014, 26, 2084–2088 CrossRef CAS PubMed.
- Y. X. Tang, Y. Y. Zhang, X. H. Rui, D. P. Qi, Y. F. Luo, W. R. Leow, S. Chen, J. Guo, J. Q. Wei, W. L. Li, J. Y. Deng, Y. K. Lai, B. Ma and X. D. Chen, Adv. Mater., 2016, 28, 1567–1576 CrossRef CAS PubMed.
- Y. X. Tang, Y. Y. Zhang, J. Y. Deng, D. P. Qi, W. R. Leow, J. Q. Wei, S. Y. Yin, Z. L. Dong, R. Yazami, Z. Chen and X. D. Chen, Angew. Chem., Int. Ed., 2014, 53, 13488–13492 CrossRef CAS PubMed.
- Y. R. Zhong, M. Yang, X. L. Zhou, Y. T. Luo, J. P. Wei and Z. Zhou, Adv. Mater., 2015, 27, 806–812 CrossRef CAS PubMed.
- N. Liu, Z. D. Lu, J. Zhao, M. T. McDowell, H. W. Lee, W. T. Zhao and Y. Cui, Nat. Nanotechnol., 2014, 9, 187–192 CrossRef CAS PubMed.
Footnote |
| † Electronic supplementary information (ESI) available. See DOI: 10.1039/c6sc02311h |
| This journal is © The Royal Society of Chemistry 2016 |

