Economic analysis of CNT lithium-ion battery manufacturing†
A.
Hakimian
,
S.
Kamarthi
,
S.
Erbis
,
K. M.
Abraham
,
T. P.
Cullinane
and
J. A.
Isaacs
 *
*
Northeastern University, Department of Mechanical and Industrial Engineering, 360 Huntington Avenue, Boston, Massachusetts 02115, USA. E-mail: j.isaacs@neu.edu
First published on 4th August 2015
Abstract
Development of safe, economically competitive, and environmentally responsible nano-enabled products is desirable to avoid unintended consequences. Given the environmental health and safety uncertainties associated with nanomaterials, additional precautions for exposure prevention may be required, although not regulated. Companies working with engineered nanomaterials may want to understand decision tradeoffs for the costs associated with increased levels of occupational safety and potential environmental impacts. Recent advances in nanotechnology have resulted in the development of advanced lithium nickel manganese cobalt (NMC) oxide batteries enhanced with multiwall carbon nanotubes (MWCNT). These batteries have a much greater energy density and product life than traditional lithium-ion batteries. A stochastic process-based cost model (PBCM) is developed to investigate the cost drivers for manufacture of MWCNT NMC batteries targeted for satellite and computer applications. Various levels of occupational safety protection (low, medium and high assumed) are analyzed to determine their effect on total manufacturing cost. The results show that MWCNT cost has the highest impact on total unit cost for production of satellite batteries, whereas cycle time has the highest impact on the unit cost of computer batteries. The mixing step contributes the most to the total unit cost for both satellite and computer MWCNT NMC lithium-ion batteries due to the inclusion of MWCNT costs in the mixing step. The process-based cost model developed in this work not only offers estimation of the economic drivers associated with the MWCNT NMC battery manufacturing, but also allows consideration of strategies to reduce costs. Results contribute to safer manufacturing practices for CNT lithium-ion batteries for low and high production volume applications (satellites and portable computers, respectively).
Nano impactThere is significant promise to realize improved properties of MWCNT batteries, but only when these products are responsibly manufactured, used and disposed throughout their product lifecycle. In this study a stochastic process-based cost model was developed to investigate the cost of occupational safety alternatives for manufacture of MWCNT lithium batteries. By combining PBCM with design of experiment based analysis, the effect of uncertainties in process yield, cycle time, cost of PPE waste, cost of energy, and cost of MWCNT on manufacturing unit costs can be analyzed. This approach allows exploration of ‘what if’ scenarios on the costs of exposure avoidance and allows comparisons with user costs on an annualized basis, considering the value-added longer product lifetimes with CNTs. This study represents a first exploration of cost tradeoffs for CNT batteries over the product lifetime. |
Introduction
Emerging nanotechnologies are influencing advances in many industry sectors such as medicine, environmental science, transportation, electronics, and energy storage devices.1,2 The unique chemical properties of carbon nanotubes (CNTs) and other engineered nanomaterials can lead to phenomenal improvements in efficiency, durability, conductivity, and mechanical strength of products.3,4 The impact of nano-enabled products across the global economy has been estimated to grow at a minimum to $3.3 trillion by 2018.5 In the United States, from the start of the National Nanotechnology Initiative (NNI) in 2001 to 2016, the cumulative NNI investment is estimated to reach $21 billion.6 The cumulative investment in the environmental, health, and safety (EHS) research area is lower, nearing $1 billion in the United States since 2006.6 Given the continued uncertainty about the EHS effects of engineered nanomaterials, and especially from CNTs, assessment of nano-enabled product benefits and risks to understand potential tradeoffs of environmental and human health impacts can help to inform responsible commercialization paths.CNTs are nanoscale allotropes of carbon that have a cylindrical structure.7 Their structure, as well as their exclusive electrical, mechanical, thermal and magnetic properties place them in a special class of materials for many potential industrial and scientific applications.7,8 Produced as single-walled carbon nanotubes (SWCNTs) or multi-walled carbon nanotubes (MWCNTs), they are light-weight high-strength materials.8,9 Depending on their chirality, they can be either metallic or semiconducting.8–10 The market demand for CNTs is expected to increase considerably in the future.11,12 Global market demand for CNTs is anticipated to rise 40% to 50% in 2016 relative to 2011 (ref. 11) with demand for MWCNTs alone reaching 3728 MT by 2020 compared to 200 MT in 2011.12 Lux Research reports that the future demand of MWCNTs will result from two applications, namely, conductive polymer composites and lithium-ion battery electrodes12 (see Fig. 1).
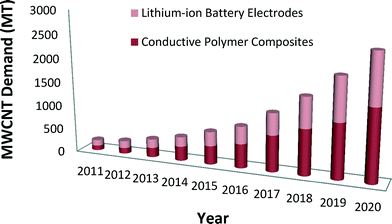 | ||
| Fig. 1 Anticipated MWCNT global market demand for use in battery and polymer composite applications.12 | ||
The growing use of CNTs has consequently raised concerns about their potential detrimental impact on human health and the environment. Depending on the application, release of CNTs could occur during their production, manufacture of nano-enabled products, their use, and/or product recycling/disposal.13–16 Although results are still under debate, existing studies indicate that CNTs have possible toxicity effects.17,18 As with other potentially hazardous materials, engineering principles can be utilized to design safer CNT manufacturing, use and disposal practices. To avoid exposures and releases during manufacture, a series of best practices has been recommended.19,20 Implementation of these additional safety measures will lead to more responsible manufacture.
That said, added safety measures incur costs. This study therefore focuses on CNT-enhanced lithium-ion batteries to estimate the changes in manufacturing costs for different levels of occupational safety. A stochastic process-based cost model (PBCM) that accounts for uncertain cost parameters is developed to investigate the cost drivers for production of MWCNT lithium nickel manganese cobalt oxide (NMC) batteries targeted for satellites and computer applications. Input parameters and assumptions for each process step (such as the amount of the raw materials, number of workers, and number of machines) are defined.21 Three scenarios are considered to analyze the effect of different occupational safety practices on total manufacturing cost. Each scenario reflects a different combination of additional protection such as ventilation, gloves, gowns, and respirators. The PBCM is built and validated with inputs from an actual process for manufacturing lithium-ion batteries (without CNTs). Manufacturing practices for MWCNT NMC batteries for both low and high production volume applications (satellites and computers, respectively) are investigated.
Overview of lithium-ion battery technology
Batteries are devices that convert chemical energy into electricity. This conversion process occurs at the battery electrodes: cathodes and anodes.22 Power density (or specific power) and energy density (or specific energy) are the two main attributes that characterize battery performance.22–24 Power density refers to the amount of power a battery can provide per unit battery volume (W L−1). On the other hand, specific power indicates the amount of current a battery can provide per unit battery mass (W kg−1). Energy density is the amount of energy stored in unit battery volume22 (W h L−1), while specific energy is the amount of energy stored in unit battery mass (W h kg−1). Nominal rate or C-rate is another measure that characterizes a battery's charge and discharge currents. At 1 C, a battery charges and discharges current on par with a battery's given A h rating; at 0.25 C the current is one fourth of Ah rating, and at 0.5 C it is one half. When it comes to charging, a 1 C rated battery charges another battery in about one hour while a 0.5 C rated battery takes approximately 2 hours. Lithium-based batteries are among the fastest growing battery systems. Lithium properties are ideal for making a battery or a storage device. Lithium is lightweight and the most electropositive element, which translates to offering the highest specific energy and power density.25 Since lithium metal holds the lowest anode potential, it is capable of creating the highest potential difference between the anode and the cathode, hence the maximum cell voltage.23 Most lithium-ion batteries are composed of a metal oxide cathode and a graphite anode.24In lithium-based batteries, the choice of a cathode results in differing properties. Common cathode materials in lithium-ion batteries include lithium cobalt oxide (LCO), lithium manganese oxide (LMO), lithium iron phosphate (LFP), lithium nickel manganese cobalt oxide (NMC), and lithium nickel cobalt aluminum oxide (NCA). The anode for most lithium-ion batteries consists of graphite.23,26,27Table 1 summarizes the characteristics of the most commonly used lithium-ion batteries with different cathode materials. In addition, all battery types require a mechanism for circuit protection and cell balancing for safety. The global market of lithium-ion batteries has been growing significantly in recent years. The market forecast of lithium-ion batteries for specific applications is listed in Table 2.28Table 3 specifies the global market for different types of lithium-ion battery technologies.28 The satellite and portable computer applications selected for investigation in the present work utilize NMC batteries, which are forecasted at the highest volume.
| Cathode composition | LiCoO2 (LCO) | LiMn2O4 (LMO) | LiFePO4 (LFP) | LiNiMnCoO2 (NMC) | LiNiCoAlO2 (NCA) |
|---|---|---|---|---|---|
| Voltage (V) | 3.6 | 3.7 | 3.3 | 3.6 | 3.6 |
| Cycle life (h) | 500–1000 | 300–700 | 1000–2000 | 1000–2000 | 500 |
| Specific energy (W h kg−1) | 150–200 | 100–150 | 90–120 | 150–220 | 200–260 |
| Charge (C-rate) | 0.7–1 C | 0.7–1 C typical, 3 C maximum | 1 C | 0.7–1 C | 0.7 C |
| Discharge (C-rate) | 1 C | 1 C recommended; 10 C possible, 30 C pulse | 1 C recommended, 20–25 C continuous | 1 C recommended; 2 C continuous possible | 1 C continuous |
| Thermal runaway | 150 °C | 250 °C | 270 °C | 210 °C | 150 °C |
| Cost | High | Moderate | Moderate | Moderate | High |
| Characteristics | Very high specific energy; limited specific power | Good to high specific energy; high power | Moderate specific energy, high specific power, long life span, | Very high specific energy; high specific power | High specific energy and power, good life span |
| Applications | Mobile phones, tablets, laptops, cameras | Power tools, medical, electric powertrain | Portable and stationary needing high load currents and endurance | E-bikes, medical devices, EVs, power tools, mobile devices | Medical devices, industrial, electric powertrain (Tesla) |
| Applications | 2015 | 2020 |
|---|---|---|
| Hybrid electric vehicles | 6.2 | 13.8 |
| Plug-in hybrid electric vehicles | 6.3 | 39.7 |
| Electric vehicles | 25.3 | 31.7 |
| Electric bikes | 0.3 | 3.2 |
| Net-books | 11.3 | 24.1 |
| Note-books | 29.4 | 42.0 |
| Mobile phones | 22 | 39.0 |
| Power tools | 5.9 | 8.8 |
| Energy storage system | 4.2 | 18.7 |
| Total | 110.9 | 220.9 |
| Battery technology | 2015 | 2020 |
|---|---|---|
| NMC | 42.9 | 78.1 |
| LMO | 18.0 | 36.3 |
| LFP | 9.2 | 40.9 |
| NCA | 7.9 | 12.8 |
| LCO | 32.9 | 52.9 |
| Total | 110.9 | 220.9 |
Battery manufacturing processes
Manufacture of a lithium-ion battery cell starts with the production of cathodes and anodes, using similar processes for both. Fig. 2 shows the process flow diagram for a battery facility. All steps in the battery manufacturing process, from mixing to final assembly, are furnished with general ventilation to create healthy working conditions. Additional protective environment (e.g., local exhaust ventilation including blowers and hoods and filters and/or personal protective equipment) is added to cell assembly, filling, and sealing & welding steps when NMC is used as active material. This protective environment is further extended to mixing, coating & drying, calendaring, and cutting steps when both MWCNTs and NMC are used as active material. To make cathodes, the active materials (NMC and MWCNT) are mixed with a binder and carbon black to make a cathode paste. The cathode paste is coated onto an aluminum foil which serves as a current collector. In contrast, to make anodes, the paste containing a binder and graphite is coated onto a copper foil current collector. The common binder for both cathodes and anodes are polyvinylidene fluoride (PVDF) dissolved in N-methyl-2-pyrrolidone (NMP). The foils are then dried and pressed to the desired thickness and density. Next the foils are cut to the proper size and inserted into the battery cell container either wound or stacked. The cells are then filled with the electrolyte and sealed. From the cutting process through sealing, fabrication of NMC batteries (either with or without CNTs) is conducted in an environmentally controlled area. For making batteries with CNTs, the proposed protected environment is extended – not for technical benefits, but rather to prevent human and environmental exposures. The sealed cells then proceed to a forming process, where they are charged and discharged 2 or 3 times. The formed cells are subjected to quality control before they are shipped.30,31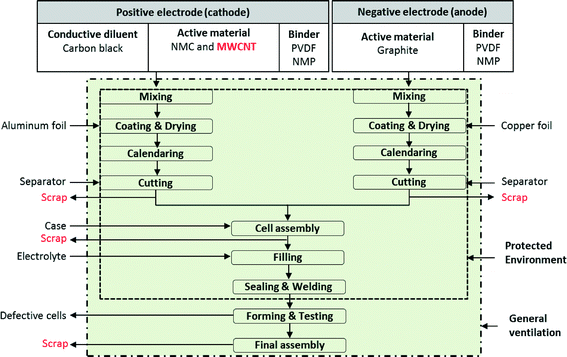 | ||
| Fig. 2 Lithium-ion NMC battery with MWCNT manufacturing steps;32 all steps in the battery manufacturing process furnished with general ventilation to create healthy working conditions. When NMC is used as an active material, the protected environment encloses: cell assembly, filling, sealing & welding steps. When both NMC and MWCNTs are used as active materials, the protected environment is extended to cover all the steps except the forming & testing and final assembly steps. | ||
Properties of lithium-ion batteries with CNTs
When added to a battery cathode, CNTs can significantly improve the lithium-ion battery performance. The main benefits include increased electronic conductivity of the cathode electrode, increased charge/discharge rate, and higher structural flexibility.33,34 Other characteristics that make CNTs desirable for use in lithium-ion batteries include high chemical resistance and low flammability.33 In direct contact with the electrolyte, CNTs in the electrode show high chemical resistance towards an extensive range of organic solvents and lithium-ion salts.33,35 CNTs may be used for different purposes in different parts of the battery cell, e.g., in cathodes or anodes.33,36,37 In research laboratories, different cathode materials are under development to create batteries with better performance, longer lifetime, lower thermal tolerance, and higher energy density.23The economic analyses presented here address scale-up production of CNT lithium-ion batteries that are currently at the research and development stage. These batteries use MWCNT lithium nickel manganese cobalt cathodes. The batteries are designed for satellite and portable computer applications. The anode is made of graphite similar to anode electrodes of traditional lithium-ion batteries.27,37–39 The materials used to make the different components of selected CNT NMC battery are listed in Table 4.
| Lithium-ion cell/battery part | Material used |
|---|---|
| Anode active material | Graphite |
| Anode substrate | Copper |
| Cathode active material | MWCNT NMC |
| Cathode substrate | Aluminum |
| Separator | Polyethylene |
| Electrolyte solvent | Organic carbonate and lithium salt |
The property improvements in the performance of lithium-ion cells with MWCNTs compared to that of the conventional lithium-ion cells in satellites and computers are listed in Table 5. The inclusion of CNTs in the battery cells improves many parameters including: nominal rate, nominal capacity, specific energy, specific power, and battery life.
The impact of CNTs on battery performance varies depending on the percentage of CNT content in the battery's active material. The main improvement occurs in the maximum power density of battery cells, which is about 800% in satellite batteries. The battery life for both satellite and computer battery cells is expected to double. Other battery cell parameters (see Table 5) are expected to improve by about 25%.40–42
| Battery cell parameter | Satellites batteries without CNTs | Satellites batteries with CNTs | Computers batteries without CNTs | Computers batteries with CNTs |
|---|---|---|---|---|
| Cell type | Prismatic | Prismatic | Cylindrical | Cylindrical |
| Cathode material | NMC | MWCNT NMC | NMC | MWCNT NMC |
| Anode material | Graphite | Graphite | Graphite | Graphite |
| Nominal rate (C-rate) | 2C | 2C | 1C | 1C |
| Nominal capacity (A h) | 25 | 30 | 1.8 | 2.5 |
| Specific energy (W h kg−1) | 105 | 120 | 190 | 220 |
| Maximum specific power (W kg−1) | 200 | 1800 | 160 | 200 |
| Battery life (years) | 2 | 4 | 3 | 6 |
In the following section, development of a process-based technical cost model is described for manufacture of NMC batteries. To construct the model, the manufacturing process steps, model inputs, physical parameters and assumptions are defined to calculate total manufacturing costs based on annual production volumes. Process data were collected from a lithium-ion battery manufacturer located in southern New England. Three occupational safety scenarios are considered. The model is designed to account for stochastic input parameters to represent an input range or distribution, which results in manufacturing cost distributions for total battery cost.
Process-based technical cost models
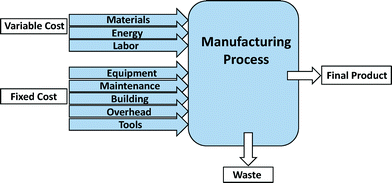
Process-based cost modeling (PBCM) is a cost estimation tool to assess the manufacturing process costs.44–47 This methodology has been used for estimating the manufacture of numerous products including SWCNTs and lithium-ion batteries for electric-drive vehicles.45,46,48–50 Application of PBCM to fabrication processes not only assesses the operational costs of the process, but also enables comparison of alternative materials and processes for manufactured products.45,47,50 After defining individual manufacturing process steps as well as other assumptions and input parameters, the model is programmed to determine cost differences resulting from changes to base case assumptions. One of the main advantages of applying the PBCM methodology is its ability to assess cost drivers for emerging technologies and to forecast engineering development costs.47 To this end, PBCMs offer a means to explore numerous scenarios. For manufacture of emerging nano-enabled products, this exploration includes consideration of other costs associated with various levels of environmental health and safety during production.The fixed and variable cost items considered for model development are shown in Fig. 3. The variable cost parameters include those cost elements that vary proportionally with production volume. Fixed costs are one-time capital investments that can be distributed across the entire production volume. Variable costs include material, energy, and labor costs, while fixed costs include the cost of equipment, maintenance, building, overhead, and tools.47,49
After entering process inputs for a specific battery application and assumptions for its annual production volume, the model calculates the required number of production lines, machines, materials, labors, and associated amount of energy. The total manufacturing cost per unit is calculated according to the following formula:
 | (1) |
 | (2) |
 | (3) |
 | (4) |
 | (5) |
Model assumptions for case studies
Process steps for MWCNT NMC lithium-ion batteries are considered comparable to commercial lithium-ion battery production, shown in Fig. 2. With the inclusion of MWCNTs in the process and uncertain risks of exposure and release, precautions to avoid exposures and releases in the manufacturing facility are recommended.19,51 These practices will require additional equipment, such as a highly controlled environment to enclose all process steps from mixing to sealing. Based on these adaptations, the manufacturing process steps of MWCNT NMC batteries and the operating data (see Tables 6 and 7) are kept consistent for the two base case applications (satellites and computers); however cell specifications and battery part weight percentages (described later) vary for each application. MWCNTs are assumed to constitute 1% of the total weight of a battery for each application. Manufacturing processes, requiring one or two workers per fabrication process line, are assumed to be semi-automated. Equipment can be dedicated or non-dedicated, producing only MWCNT NMC batteries (dedicated) or including other products (non-dedicated).| Operation data assumptions | |
|---|---|
| a Assumed as a percentage (%) of capital cost (main equipment cost). b Assumed as a percentage (%) of direct labor cost. | |
| Scheduled downtime per day | 1.5 h |
| Hours per day | 24 h |
| Days per year | 250 days |
| Building life | 30 years |
| Interest rate | 10% |
| Auxiliary equipment ratea | 10% |
| Fixed overhead rateb | 40% |
| Maintenance ratea | 5% |
| Installation equipment ratea | 2% |
| Tool ratea | 25% |
| Main cost parameter assumptions | |
|---|---|
| Direct labor cost | $25 per h |
| Indirect labor cost | $20 per h |
| Building cost | $73 per ft2 |
Operational and cost data assumptions used for calculating the total cost of MWCNT NMC batteries are provided in Tables 6 and 7. Table 6 shows the operating assumptions for battery fabrication for three work shifts.45,52Table 7 provides assumed cost parameters for: labor, energy, and building.
As in most manufacturing processes, there will be some defective cells/batteries, so the yield will not always be 100%. Based on the assumed conversion rates and the desired production volume, it is possible to calculate the total amount of scrap generated during battery manufacture. Defective units can be collected and sold to recycling companies. Battery manufacturing companies can use the scrap materials as a source of revenue and credit it against the total unit cost. The recycling companies recover metals such as aluminum, copper, and lithium. It is assumed that there is 5% scrap generated during the electrode manufacturing and cell assembly, 10% scrap during the forming process, and 2% during the final assembly. Therefore, a conservative lower limit for overall process yield is 95% × 90% × 98 = 84%.
As described earlier, there is no clear understanding regarding the impact of nanomanufacturing and engineered nanomaterials on human health and the environment.54 Hence, the National Institute for Occupational Safety and Health (NIOSH) suggests handling CNTs and nanoparticles with a hazard-based approach (e.g., avoiding exposures).19 The U.S. Environmental Protection Agency (EPA) also lists CNTs in the Toxic Substances Control Act (TSCA) inventory.20,51 In 2013, NIOSH announced the 8 hour time-weighted average (TWA) exposure limit to 1 μg m−1 (ref. 3) elemental carbon and described the strategies for controlling workplace exposures.19,55 To achieve these low levels, three different EHS scenarios are modeled to compare the costs of low, medium, and higher levels of occupational safety. The assumptions for each scenario are presented in Table 8. The low level EHS scenario is assumed to include moderate engineering controls (with general exhaust ventilation), administrative controls (monthly monitoring), and average Personal Protective Equipment (PPE) requirements (such as latex gloves, disposable respirators, and Tyvek suits). The medium EHS scenario includes local exhaust ventilation as well as general exhaust. Local exhaust ventilation includes blowers, and ductwork, with one hood and one filter assumed for each line. In this scenario, the workplace is monitored more frequently (weekly) for potential exposure to nanoparticles. For PPE, workers use nitrile gloves, disposable respirators, and Tyvek suits. For the high EHS scenario, again general and local ventilation is assumed. High EHS considers higher levels of PPE (e.g., HEPA filter masks instead of disposable respirators; with disposal of PPE considered as hazardous waste), and implements biweekly workplace monitoring and medical monitoring. In the high scenario, local ventilation is assumed to consist of one blower and two sets of hoods and filters for each line. Ventilation for the protective environment is calculated based on the air-change method, which is a product of the manufacturing space volume (ft3) and the number of total air changes per hour. The rate of air changes for the manufacturing area is assumed to be 20 changes per hour.56
| EHS instruments to avoid exposures and releases | |||
|---|---|---|---|
| Type of EHS control | Low | Medium | High |
| Engineering controls | |||
| General ventilation | General exhaust ventilation | General exhaust ventilation | General exhaust ventilation |
| Local exhaust ventilation | - Fume hood - HEPA filter | - Fume hood - HEPA filter | |
| Enclosure of processes | Extra equipment | ||
| Air monitoring | |||
| Administrative controls | Monthly monitoring | Weekly monitoring | Biweekly monitoring |
| Medical monitoring | |||
| Personal protective equipment | |||
| Gloves | Latex gloves | Nitrile gloves | Nitrile gloves |
| Respirators | Disposable respirators | Disposable respirators | HEPA filters |
| Suits | Tyvek suits | Tyvek suits | |
| Disposal of PPE hazardous waste | |||
Monte Carlo simulation and uncertain parameters
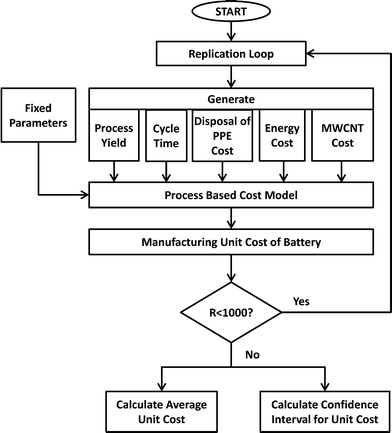
PBCM is extended to work as a Monte Carlo simulation model to account for the uncertain input parameters assumed for battery manufacturing scale-up. By using the Monte Carlo simulation flowchart depicted in Fig. 4, average cost and cost intervals for producing MWCNT NMC batteries is calculated by generating stochastic values for each uncertain parameter. Initially the model was run treating all parameters as deterministic to explore the variables. The influence of each variable on the total manufacturing cost is tested at two levels (at minimum and maximum value of the variable). The parameters that affected a relatively large change on the total manufacturing cost are considered as stochastic parameters in the subsequent analysis. Five parameters are stochastically modeled: process yield, the cycle time of the forming step, the cost of hazardous waste disposal for PPE, energy cost, and MWCNT cost. Triangular distributions are assumed for process yield ~Tri(0.8, 0.85, 0.9), the cycle time of the forming step ~Tri(24, 48, 72) and the disposal cost of PPE as hazardous waste ~Tri(0, 8, 16), while normal distributions are assumed for energy cost ~N(0.15, 0.01) and MWCNT cost ~N(600, 100).The simulation model is run (R = 1000 times) to calculate cost averages and confidence intervals. In each run, the Monte Carlo model generates numbers for the stochastic parameters by using the specified distributions above, and uses these values in the PCBM model to calculate the manufacturing unit cost of the batteries. After running the model 1000 times, the model calculates the average manufacturing unit cost and 95% confidence intervals. In the following sections, the results for the modified PBCM model are illustrated for batteries for satellite and portable computer case studies.
Case studies
In this section, manufacture of MWCNT NMC batteries used in satellites and portable computers is investigated by applying PBCM methodology. Specific assumptions for each battery system are identified, and manufacturing costs are reported.Satellite batteries
The key design features of satellite cells are summarized in Table 9. The assumptions made regarding the distribution of weights for various CNT battery components are specified in Table 10. Each satellite battery contains five modules. Each module contains 20 prismatic cells. Each battery cell weighs 0.908 kg, and the total satellite battery weighs 170 kg. As mentioned earlier, the forming and testing step takes about 24 to 72 hours depending on the desired battery cycle life. The duration of this step exceeds the duration of all steps combined. An annual production volume of 300![[thin space (1/6-em)]](https://www.rsc.org/images/entities/char_2009.gif) 000 cells (3000 batteries) is assumed. The required quantity of raw materials, number of production lines, and number of workers are recalculated when the production volume is altered.
000 cells (3000 batteries) is assumed. The required quantity of raw materials, number of production lines, and number of workers are recalculated when the production volume is altered.
| Cell specification | Value |
|---|---|
| Anode active material | Graphite |
| Anode substrate | Copper |
| Cathode active material | MWCNT NMC |
| Cathode substrate | Aluminum |
| Separator | Polyethylene |
| Electrolyte solvent | Organic carbonate & lithium salt |
| Cell number | 100 cells in 5 modules |
| Cell type | Prismatic |
| Cell dimension | 95 mm width × 140 mm ht × 28 mm thickness |
| Nominal cell weight | 0.908 kg |
| Life cycle | >800 cycles |
| Nominal cell capacity | 30 A h |
| Nominal voltage | 3.6 VDC |
| Specific energy | 125 W h kg−1 |
| Maximum specific power | 1800 W kg−1 |
| CNT Li-ion battery | Ranges for (%) part weight37,57,58 | Model input assumptions |
|---|---|---|
| Anode material | 12–18% | 15% |
| Anode current collector | 2–5% | 3% |
| Cathode material | 20–25% | 22% |
| Cathode current collector | 1–3% | 1% |
| Electrolyte | 8–12% | 10% |
| Separator | 2–4% | 2% |
| Cell container | 1–3% | 1% |
| Module container | 8–12% | 10% |
| Pack container and battery management systems | 30–40% | 36% |
The results obtained from the PBCM with Monte Carlo simulation with the low EHS scenario as a base case are presented for satellite batteries. The main cost drivers for manufacture of MWCNT NMC batteries include all stochastic parameters: process yield, the cycle time of the forming step, the cost of hazardous waste disposal for PPE, energy cost, and MWCNT cost. Fig. 5a illustrates the average cost breakdown by fixed and variable cost and Fig. 5b illustrates average cost breakdown by manufacturing process step for MWCNT NMC satellite batteries. The fabrication cost of MWCNT lithium-ion batteries is dominated by variable costs: material cost (84%), followed by labor cost (9%) and energy cost (1%). The mixing step has the highest impact on the manufacturing unit cost (58% of the manufacturing unit cost) due to the cost of MWCNTs and other raw materials used in the mixing step (Fig. 5b). For an annual production volume of 300![[thin space (1/6-em)]](https://www.rsc.org/images/entities/char_2009.gif) 000 battery cells (3000 batteries), assuming a 10% defective rate after forming and testing, the average annual base case satellite battery cost is approximated at $3945 per battery without considering revenue from manufacturing scrap.
000 battery cells (3000 batteries), assuming a 10% defective rate after forming and testing, the average annual base case satellite battery cost is approximated at $3945 per battery without considering revenue from manufacturing scrap.
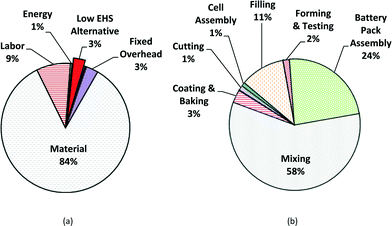 | ||
| Fig. 5 Manufacturing cost breakdowns of low EHS base case for satellite batteries for mean value; (a) fixed and variable cost breakdown; (b) cost by production step. | ||
The manufacturing waste is assumed to be collected and sold to the recycling companies. The revenues from scrap produced during the electrode manufacturing processes of CNT lithium-ion batteries are calculated based on the total production volume. As mentioned earlier, 5% scrap generation is assumed during the electrode manufacturing step with 10% and 2% scrap generation during the forming process and final assembly step, respectively. If companies recover revenue from scrap, the total unit cost is reduced to $3891, albeit only a small reduction in the total cost. The result reported here reflects the manufacturing costs without annualizing over the life of the product.
Using the specifications assumed in Tables 9 and 10, and costs for three EHS scenarios assumed in Table 8, along with revenues from scrap generation, the manufacturing unit costs of MWCNT NMC satellite batteries are calculated. The manufacturing unit costs along with confidence intervals for three EHS scenarios are shown in Fig. 6. To calculate the average values and intervals for manufacturing unit cost, the simulation model (Fig. 4) is run 1000 times by generating numbers for the stochastic parameters. The 95% confidence interval for manufacturing unit cost for different EHS scenarios is determined. The results indicate that if high EHS standards are preferred or become mandatory in the future, the manufacturing unit cost of satellite batteries increases by 9% compared to that of low EHS standards or increases by 5% over that of medium EHS standards.
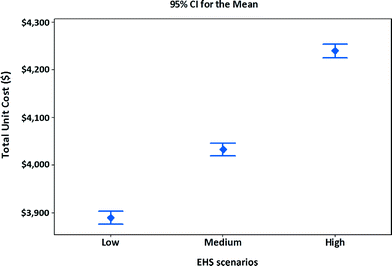 | ||
| Fig. 6 Unit cost and confidence intervals of alternative EHS scenarios for manufacturing MWCNT NMC satellite batteries. | ||
Computer batteries
Table 11 presents the specifications of CNT lithium-ion cells in batteries designed for computers. The battery consists of one module that has 6 cells. Unlike satellite battery cells, computer battery cells are cylindrical and much lighter. The weight of each cell is 0.048 kg with a total battery weight of about 0.41 kg. The assumed distribution for the weight of computer battery parts is shown in Table 12.| Cell specification | Value |
|---|---|
| Anode active material | Graphite |
| Anode substrate | Copper |
| Cathode active material | MWCNT NMC |
| Cathode substrate | Aluminum |
| Separator | Polyethylene |
| Electrolyte solvent | Organic carbonate & lithium salt |
| Cell number | 6 cells and 1 module |
| Cell type | Cylindrical |
| Cell dimension | 65.1 mm height × 18.5 mm diameter |
| Nominal cell weight | 0.041 kg |
| Life cycle | >800 cycles |
| Nominal cell capacity | 2.5 Ah |
| Nominal voltage | 3.6 VDC |
| Specific energy | 220 W h kg−1 |
| Maximum specific power | 200 W kg−1 |
| CNT Li-ion battery | Ranges for (%) part weight37,57,58 | Model input assumptions |
|---|---|---|
| Anode material | 14–19% | 17% |
| Anode current collector | 5–9% | 8% |
| Cathode material | 25–30% | 25% |
| Cathode current collector | 5–7% | 5% |
| Electrolyte | 10–15% | 10% |
| Separator | 2–6% | 4% |
| Cell container | 1–3% | 1% |
| Module container | 5–10% | 5% |
| Pack container and battery management systems | 20–25% | 25% |
Just as in case of the satellite batteries, the amount of raw materials, number of machines, and number of workers change proportionally with the total production volume. The forecasted demand for lithium-ion portable computer batteries in 2018 is 1![[thin space (1/6-em)]](https://www.rsc.org/images/entities/char_2009.gif) 000
000![[thin space (1/6-em)]](https://www.rsc.org/images/entities/char_2009.gif) 000 battery units;59 this value is assumed as the annual total production volume for this case study. The cost breakdown by variable and fixed costs in computer battery manufacturing is shown in Fig. 7a, with the cost breakdown by process step in Fig. 7b. Again, material costs dominate at 62% of the manufacturing unit cost, followed by labor cost (17%) and EHS cost (10%). Because computer batteries are much smaller than satellite batteries, the percentage of material cost is lower for computer batteries, though labor costs remain similar. Fig. 7b indicates that among the battery production steps, the mixing step dominates with 36% of the total manufacturing unit cost. The average manufacturing unit cost of MWCNT NMC batteries for computers (for the low EHS base case scenario) is expected to be ~$27 for an annual production volume of 1
000 battery units;59 this value is assumed as the annual total production volume for this case study. The cost breakdown by variable and fixed costs in computer battery manufacturing is shown in Fig. 7a, with the cost breakdown by process step in Fig. 7b. Again, material costs dominate at 62% of the manufacturing unit cost, followed by labor cost (17%) and EHS cost (10%). Because computer batteries are much smaller than satellite batteries, the percentage of material cost is lower for computer batteries, though labor costs remain similar. Fig. 7b indicates that among the battery production steps, the mixing step dominates with 36% of the total manufacturing unit cost. The average manufacturing unit cost of MWCNT NMC batteries for computers (for the low EHS base case scenario) is expected to be ~$27 for an annual production volume of 1![[thin space (1/6-em)]](https://www.rsc.org/images/entities/char_2009.gif) 000
000![[thin space (1/6-em)]](https://www.rsc.org/images/entities/char_2009.gif) 000 batteries, with an assumed 10% defective rate after the forming and testing step. The manufacturing unit cost decreases minimally (by $1) with credits gained through scrap collection. The result reported here reflects the manufacturing costs without annualizing over the life of the product.
000 batteries, with an assumed 10% defective rate after the forming and testing step. The manufacturing unit cost decreases minimally (by $1) with credits gained through scrap collection. The result reported here reflects the manufacturing costs without annualizing over the life of the product.
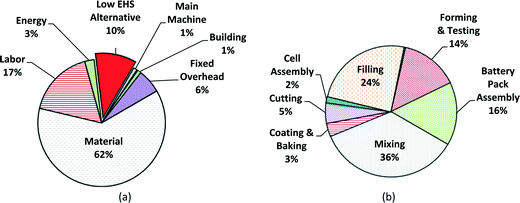 | ||
| Fig. 7 Manufacturing cost breakdowns of low EHS base case for portable computer batteries for mean value; (a) fixed and variable cost breakdown; (b) cost by production step. | ||
Fig. 8 shows the manufacturing unit cost and confidence intervals of MWCNTs lithium-ion batteries for portable computers. Using the manufacturing assumptions listed in Tables 11 and 12 and the EHS scenarios in Table 8, the average manufacturing unit cost for batteries in portable computers increases when higher levels of EHS are implemented. An increase of nearly $4.1 per unit (about 15% cost increase) results from shifting from low EHS practices to high EHS standards. The percentage increase in the manufacturing unit cost for computer batteries is about the same as that for the satellite batteries (10% cost increase). However the absolute dollar numbers will be smaller for computer batteries due to design differences between computer and satellite batteries.
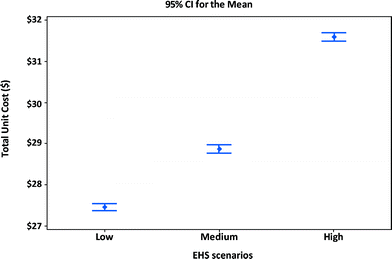 | ||
| Fig. 8 Unit cost and confidence intervals of alternative EHS scenarios for manufacturing MWCNT NMC portable computer battery modules. | ||
Design of experiment results
Design of experiment (DOE) based analyses are run to determine the factors that have significant effect on the manufacturing unit cost and also to study the interaction effects of multiple parameters. Process yield, the cycle time of the forming step, the disposal cost for PPE (i.e., when PPE is considered hazardous waste, its disposal cost is the main factor that differentiates the three EHS scenarios from one another), energy costs, and the cost of MWCNTs are selected for analysis. As mentioned previously, these variables are selected based on an initial exploratory study. In this DOE analysis, high, medium level, and low values for each of these factors are symbolically coded as 1, 0, and −1 respectively. The variables themselves are not normalized between −1 and 1. The high, medium and low levels for each variable are listed in Table 13. Triangular distributions Tri(a, c, b) are used to generate process yield, cycle time and the disposal cost of PPE as hazardous waste, whereas normal distributions N(μ, σ) are used to generate energy cost and MWCNT cost values. The same distribution parameters are used for both satellite and computer batteries.| Factor level | Process yield Tri(a, c, b) | Cycle time Tri(a, c, b) | PPE waste cost Tri(a, c, b) | Energy cost N(μ, σ) | MWCNT cost N(μ, σ) |
|---|---|---|---|---|---|
| 1 | (0.9, 0.95, 1) | (60, 72, 84) | (8, 16, 24) | (0.2, 0.01) | (800, 100) |
| 0 | (0.8, 0.85, 0.9) | (24, 48, 72) | (0, 8, 16) | (0.15, 0.01) | (600, 100) |
| −1 | (0.7, 0.75, 0.8) | (12, 24, 36) | (0, 4, 8) | (0.1, 0.01) | (400, 100) |
Main and interaction effects of the factors on manufacturing unit cost of lithium-ion batteries with CNTs are investigated using a full factorial design. A three-level design with 5 factors has 243 possible combination treatments. The PBCM model was executed 1000 times for each run (treatment), and the average manufacturing unit cost of 1000 replications was taken as the response value for that run. MINITAB was used to analyze the results.
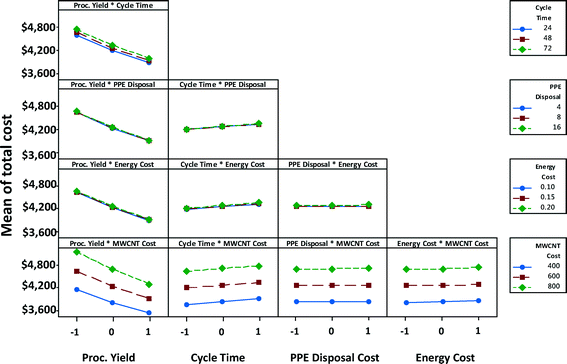
The main effects of process variables on manufacturing unit cost satellite batteries (for the high EHS scenario) are depicted in Fig. 9. Each plot in the figure shows the variation in manufacturing unit cost as a process variable that is varied from its low value to its high value, while keeping all other process variables at their midlevel. These plots are called marginal mean plots. The steep slope of the variation of total manufacturing cost with respect to MWCNT cost indicates that MWNT cost has the strongest effect on the satellite battery unit cost. Process yield has the second strongest effect on manufacturing unit cost. If process yield is poor, then the manufacturing unit cost will increase significantly due to high consumption of MWCNTs and other materials for the satellite battery manufacturing. Cycle time also exerts a non-negligible influence on the manufacturing cost. Longer cycle time means higher energy consumption and more labor hours. Although PPE disposal cost was one of the main contributors to the cost of maintaining high EHS standards, changes to hazardous waste costs do not appear to significantly affect the manufacturing unit cost. Similarly, the influence of energy cost on manufacturing unit cost is dwarfed by the influence of MWCNT cost and process yield.
Fig. 10 shows the interaction effects of factor-pairs on manufacturing unit cost of a satellite battery for the high EHS scenario. The middle line of each plot in the matrix is the same as the marginal mean plot of the corresponding variable in Fig. 9. Parallel lines in a plot indicate that two parameters associated with the plot do not interact, as is the case of PPE disposal cost and MWCNTs, although individually each of them may affect the cost. If the lines in the plot coincide or almost coincide with one another but with a non-horizontal slope, then only one of the variables has influence on the response variable. This is the case with the process yield-PPE disposal cost pair; only process yield has an effect on the unit cost, whereas PPE disposal cost has no effect on the unit cost. If the lines in the plot coincide or almost coincide with one another but with a close-to-horizontal slope, then neither of the two variables has influence on the response variable. This is the case with the PPE disposal cost-energy cost pair; neither of these two has an effect on the unit cost. When the lines are non-parallel as in the case of process yield and MWCNT cost, then each of these parameters affect the cost individually as well as interactively; at low MWCNT cost, process yield has a lower effect than at high MWCNT cost (i.e., the slope is steeper when MWCNT cost is high).
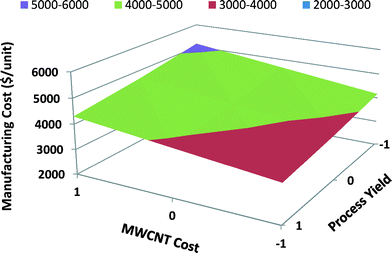
In Fig. 11 the response surface graph for satellite MWCNT batteries illustrates the effect of the two most influential parameters on the manufacturing unit cost: MWCNT cost and process yield. If high process yield is achieved through process improvements and MWCNT cost decreases over time due to advancements in nanomanufacturing, then the manufacturing unit cost will decrease significantly. Because both the process yield and the MWCNT cost have significant effects on the manufacturing unit cost of satellite MWCNT batteries, they both should be scrutinized to minimize the manufacturing unit cost.
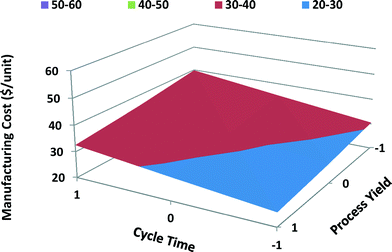
The main and interaction effects of process variables on manufacturing unit cost of computer batteries differ from those of satellite batteries. Both cycle time and process yield have a significant effect on the manufacturing unit cost of computer batteries with MWCNTs; however, process yield has higher effect because of high-volume production of computer batteries. Cost of MWCNTs has a lesser effect on the manufacturing unit cost of computer batteries than on the unit cost of satellite batteries due to the fact that computer batteries require lower quantities of MWCNTs. The cost of disposal of PPE hazardous waste has the least effect on total manufacturing unit cost of computer batteries. Similarly, energy cost shows a negligible effect on total unit cost of computer batteries. The interaction between the cycle time and process yield shows the highest effect on the manufacturing unit cost of computer batteries, while the interaction between PPE disposal cost and energy cost shows the least effect. When the cycle time is long and process yield is poor, the manufacturing unit cost is high, as shown in the response surface graph for portable computer batteries (Fig. 12).
Conclusions
This study presents an economic assessment of CNT-enhanced lithium-ion battery manufacturing. A process-based cost model (PBCM) was developed for manufacture of MWCNT NMC batteries meant for satellite and computer applications. Using PBCM, alternative manufacturing processes with different exposure prevention levels (low, medium, and high EHS standards) were evaluated for their economic viability. By combining PBCM with design of experiment based analysis, the effects of process yield, cycle time, cost of PPE waste, cost of energy, and cost of MWCNT on manufacturing unit cost of computer batteries and satellite batteries were explored.The economic analysis indicates that MWCNT cost and process yield have the greatest effect on manufacturing unit cost for satellite batteries, while process yield and cycle time have the greatest effect on the unit cost of computer battery modules. The cost of MWCNTs is likely to continue to come down as CNT manufacturing technologies improve, with significant reductions expected for large volume customers. Prices on the order of $100 per kg MWCNT or less are anticipated. Similarly the process yield of battery manufacturing is likely to improve with advancement in related technologies. As the price of MWCNTs goes down and process yields increase with time, manufacturing unit costs of satellite batteries are likely to become lower than current costs. If improvements to the existing technologies reduce cycle time, then future manufacturing unit costs of computers will also decrease. Currently, the duration of the forming and testing step is the largest contributor to the cycle time; it is a bottle-neck for high throughput production. Because CNTs have been shown to improve the charge and discharge rates of batteries, it is likely that the required cycle time for the forming step will decrease for CNT-enabled batteries. Other technologies could be explored to compress the forming and testing cycle time.
Energy cost has only a small effect on manufacturing unit cost of batteries compared to the effect of process yield, MWCNT cost, and cycle time. However there is still an opportunity to lower energy consumption by recapturing the discharge energy during the forming and testing step to utilize elsewhere in the battery manufacturing facility. For example this approach can mitigate the energy demand required to maintain high EHS standards for CNT-enabled batteries. In addition, the use of renewable energy could also be explored to determine the effects on unit cost as well as on related environmental impacts.
The use of MWCNTs in batteries results in significant enhancements (e.g., increased specific energy by 20%, battery life by 100%, and run time by 25%), but overall costs increase with inclusion of MWCNTs. When low EHS standards are maintained, the manufacturing unit cost of computer MWCNT batteries increases by 39% (from $19.78 to $27.46) relative to that of non-MWCNT battery modules; it is 55% (from $2520 to $3891) in the case of satellite batteries. This cost differential increases if high EHS standards are implemented: 60% higher (from $19.78 to $31.59) for computer MWCNT batteries and 70% higher (from $2520 to $4284) for satellite MWCNT battery modules compared with non-MWCNT batteries. There are several ways to assess whether these increases are worthwhile to stakeholders, which are discussed below.
For end users or manufacturers, it is notable that the cost of one unit of specific energy decreases when MWCNTs are added to batteries. For computer batteries, the relative cost of specific energy decreases from $0.142 per W h for batteries without MWCNTs to $0.118 per W h for MWCNT-enhanced batteries. Similarly these numbers drop from $37.57 per W h to $31.56 per W h for satellite batteries. Further, technical experimentation shows that the life of MWCNT NMC computer batteries will increase by 100% compared with the life of traditional NMC batteries. Given a doubled product life, it is useful to compare annualized costs of batteries with and without MWCNTs. Just as LED light bulbs cost more but last longer, MWCNT-enabled batteries cost more but provide longer operating life. The annualized cost for MWCNT-enabled computer batteries is expected to be spread over a 6 year life (compared to a 3 year period for computer batteries without MWCNTs). Considering 10% interest rate on initial investment, the annualized cost of a MWCNT-enabled computer battery is $6.20 (compared with $10.86 for a computer battery without MWCNTs). Similarly the enhanced battery life with MWCNTs in satellite applications is expected to be 4 years (compared to 2 years for its counterpart without MWCNTs), and annualized unit costs drop to $1244 from $2273. Although the MWCNT-enabled batteries are more expensive, they are less expensive on an annualized basis, considering their value-added properties for their longer product lifetimes.
The costs associated with implementing higher levels of EHS standards during manufacture may also outweigh the costs of potential future liabilities. This study shows that the manufacturing unit cost increases by ~15% for computer applications and ~10% for satellite applications from the base case (low EHS) compared with the high EHS scenario. The liability costs, if MWCNT regulations were imposed or made retroactive, could be higher than the cost of implementing more responsible industrial hygiene practices from the start. As such, taking preventative action to avoid the potential health and environmental consequences of MWCNTs in the manufacturing stage is likely to result in lower economic risk, particularly given a still uncertain future regulatory climate for CNTs.
There are ample means to avoid human exposures during occupational settings during manufacture or end-of-life (EOL), and as noted in this analysis, it is a question of cost. As new nano-enabled products emerge, costs to cover potential liabilities would also need to be assessed. As the knowledge-base grows for any potential risks, the insurance industry would offer coverage to manufacturers. Though premiums might be high as first, costs would decrease with time as risks become more certain.60 Firms could then explore these cost tradeoffs to determine whether to proceed. Some companies are currently willing to embrace the higher costs to afford the enhanced properties, because there is a market for their product. In the case of MWCNT batteries, the technical advantages result in longer lifetimes and lower energy footprints, and for some applications this makes good sense.
While this analysis has focused on the manufacturing phase of the life cycle, it is important for designers and manufacturers to consider the end-of-life alternatives for CNT-enabled batteries. Given the uncertain EHS effects or hazards associated with CNTs, it is useful to consider development or expansion of recycling infrastructures that avoid exposures and releases. Labeling systems for these batteries could help prevent inadvertent exposures during disposal or recycling especially for workers in recycling industries – and help protect the environment from possible CNT contamination. For powering satellites in orbit, MWCNT batteries would offer advantages in reduced weight, and would not affect humans during use or EOL, with complete burn up designed upon re-entry for newer satellites (hence no EOL disposal exposures). For powering laptops, consumers are not likely to be exposed, but laptop EOL battery disposal would be problematic if not addressed prior to production and broad distribution. Similarly, for powering electric or hybrid vehicles, consumers would not generally be exposed to CNTs, but if EOL practices are not thoughtfully designed, EOL workers could be at risk for exposures. If manufacturers are using CNT-enhanced materials, they should consider a plan for some level of product stewardship to allow responsible disposal of CNT-enabled batteries, just as automotive lead acid batteries are required to be handled with effective pollution control systems that also minimize worker exposure. There is significant promise to realize the improved properties of MWCNT batteries, but only when these products are responsibly manufactured, used and disposed throughout their product lifecycle.
For policymakers, uncertainty about risk poses dilemmas. On one hand, they do not want to over-regulate and undercut commercialization of potentially innovative technologies. On the other hand, they do not want to expose workers and nearby communities to potential risk from nanoparticles. Given such uncertainties, the prudent action may be to enable manufacturers to install the best possible occupational and environmental safety systems, perhaps through grant programs and tax incentives. Given past experience with risks that became more apparent over time, taking such precautions at the manufacturing stage seems a most prudent and cost-effective path.
Acknowledgements
We especially thank Frank Puglia from Yardney Technical Products Division for the technical knowledge and guidance to start the project. For insights on industrial hygiene best practices, we thank Dr. KH Dunn at the NIOSH Division of Applied Research and Technology and Dr. MJ Ellenbecker at the Massachusetts Toxics Use Reduction Institute. We also thank Prof. A Busnaina, Dr. S Somu, MN Ates and other members of the NSF-funded Nanoscale Science and Engineering Center for High-rate Nanomanufacturing at Northeastern University for their technical insights. S. Abbasi, Prof. C. Bosso, Prof. M. Eckelman, L. Pourzahedi, W. Walker and Dr. P. Zhai at Northeastern contributed to discussions. This work was supported by NSF Scalable Nanomanufacturing Award CMMI-1120329 and NSEC Award EEC-0832785.References
- L. Wen-Tso, J. Biosci. Bioeng., 2007, 102, 1–7 Search PubMed.
- Environmental Protection Agency, Nanotechnology White Paper, EPA, Washington, 2007 Search PubMed.
- J. Lee, S. Mahendra and P. J. J. Alvarez, ACS Nano, 2010, 4, 3580–3590 CrossRef CAS PubMed.
- National Nanotechnology Initiative, Nanotechnology Benefits and Applications Search PubMed.
- G. I. Analysts, Nanotechnology, A Global Industry Outlook, January 2012 Search PubMed.
- National Science and Technology Council, Supplement to the President's Budget for Fiscal Year 2015, The National Nanotechnology Initiative, 2014 Search PubMed.
- M. S. Dresselhaus, G. Dresselhaus, J. C. Charlier and E. Hernández, Philos. Trans. R. Soc., A, 2004, 362, 2065–2098 CrossRef CAS PubMed.
- Z. J. Han, S. Yick, I. Levchenko, E. Tam, M. M. A. Yajadda, S. Kumar, P. J. Martin, S. Furman and K. Ostrikov, Nanoscale, 2011, 3, 3214–3220 RSC.
- R. H. Baughman, A. A. Zakhidov and W. A. de Heer, Science, 2002, 297, 787–792 CrossRef CAS PubMed.
- C. Fisher, A. E. Rider, Z. J. Han, S. Kumar, I. Levchenko and K. Ostrikov, J. Nanomater., 2012, 2012, 19 Search PubMed.
- Nanowerk, Global Carbon Nanotubes Market Outlook: Industry Beckons, http://www.nanowerk.com/spotlight/spotid=23118.php.
- R. Kozarsky, Searching for Profits at the Intersection of Nanotech and Electronics., http://sites.ieee.org/sfbanano/files/2013/12/Lux_Research-Ross_Kozarsky-IEEE_Nano_2014-01-28.pdf Search PubMed.
- H. Maes, A. Schaeffer, H. Hollert and H. Ratte, Environ. Sci. Pollut. Res., 2009, 16, 741–742 CrossRef.
- P. W. Aasgeir Helland, A. Koehler, K. Schmid and C. Som1, Environ. Health Perspect., 2007, 115, 7 CrossRef PubMed.
- L. Stander and L. Theodore, Int. J. Environ. Res. Public Health, 2011, 8, 470–479 CrossRef PubMed.
- S. Olapiriyakul, Doctoral of Philosophy in Industrial Engineering, New Jersey's Science & Technology University, 2010 Search PubMed.
- S. Sharifi, S. Behzadi, S. Laurent, M. Laird Forrest, P. Stroeve and M. Mahmoudi, Chem. Soc. Rev., 2012, 41, 2323–2343 RSC.
- Y. Teow, P. V. Asharani, M. P. Hande and S. Valiyaveettil, Chem. Commun., 2011, 47, 7025–7038 RSC.
- NIOSH, Occupational Exposure to Carbon Nanotubes and Nanofibers, 2013 Search PubMed.
- Environmental Protection Agency, Summary of the Toxic Substances Control Act, 2011 Search PubMed.
- V. Krishnan and S. Gupta, Manag. Sci., 2001, 47, 52–68 CrossRef.
- K. M. Abraham, J. Phys. Chem. Lett., 2015, 6, 830–844 CrossRef CAS PubMed.
- V. Antti and S. Justin, J. Chem. Thermodyn., 2012, 46, 80–85 CrossRef PubMed.
- B. Scrosati and J. Garche, J. Power Sources, 2010, 195, 2419–2430 CrossRef CAS PubMed.
- F. Cheng, J. Liang, Z. Tao and J. Chen, Adv. Mater., 2011, 23, 1695–1715 CrossRef CAS PubMed.
- J. L. Sullivan and L. Gaines, Energy Convers. Manage., 2012, 58, 134–148 CrossRef CAS PubMed.
- C. Mikolajczak, M. Kahn, K. White and R. T. Long, Lithium-ion Batteries Hazard and Use Assessment, Springer, US, 2011 Search PubMed.
- Roland Berger Strategy Consultants, Technology & Market Drivers for Stationary and Automotive Battery Systems, http://www.rechargebatteries.org/wp-content/uploads/2013/04/Batteries-2012-Roland-Berger-Report1.pdf Search PubMed.
- Battery University, homepage, http://batteryuniversity.com.
- Yardney Technical Products Division Inc, http://yardney.com/.
- Siemens Inc., Battery Manufacturing Process, http://www.industry.siemens.com/topics/global/en/battery-manufacturing/process/pages/default.aspx Search PubMed.
- R. J. Brodd and C. Helou, J. Power Sources, 2013, 231, 293–300 CrossRef CAS PubMed.
- B. Jin, H.-B. Gu, W. Zhang, K.-H. Park and G. Sun, J. Solid State Electrochem., 2008, 12, 1549–1554 CrossRef CAS.
- H. Zhang, G. Cao, Z. Wang, Y. Yang, Z. Shi and Z. Gu, Electrochim. Acta, 2010, 55, 2873–2877 CrossRef CAS PubMed.
- M.-K. Song, S. Park, F. M. Alamgir, J. Cho and M. Liu, Mater. Sci. Eng., R, 2011, 72, 203–252 CrossRef PubMed.
- S. Chen, C. Mi, L. Su, B. Gao, Q. Fu and X. Zhang, J. Appl. Electrochem., 2009, 39, 1943–1948 CrossRef CAS.
- S. Amarakoon, J. Smith and B. Segal, Application of Life Cycle Assessment to Nanoscale technology: Lithium-ion Batteries for Electric Vehicles, Report EPA 744-R-12-001 Environmental Protection Agency, 2013 Search PubMed.
- Battery University, BU-205: Types of Lithium-ion, http://batteryuniversity.com/learn/article/types_of_lithium_ion Search PubMed.
- N. Kularatna, IEEE Instrum. Meas. Mag., 2011, 14, 20–33 CrossRef.
- A. Shah, M. N. Ates, S. Kotz, J. Seo, K. M. Abraham, S. Somu and A. Busnaina, J. Electrochem. Soc., 2014, 161, A989–A995 CrossRef CAS PubMed.
- M. N. Ates, Q. Jia, A. Shah, A. Busnaina, S. Mukerjee and K. M. Abraham, J. Electrochem. Soc., 2014, 161, A290–A301 CrossRef CAS PubMed.
- M. N. Ates, S. Mukerjee and K. M. Abraham, J. Electrochem. Soc., 2014, 161, A355–A363 CrossRef CAS PubMed.
- Panasonic Corporation, Lithium-ion UF553436G, http://na.industrial.panasonic.com/sites/default/pidsa/files/uf553436g_0.pdf.
- M.-C. Nadeau, A. Kar, R. Roth and R. Kirchain, Int. J. Prod. Econ., 2010, 128, 223–234 CrossRef PubMed.
- J. A. Isaacs, A. Tanwani, M. L. Healy and L. J. Dahlben, J. Nanopart. Res., 2010, 12, 551–562 CrossRef.
- P. A. Nelson, K. G. Gallagher, I. Bloom and D. W. Dees, Modeling the Performance and Cost of Lithium-Ion Batteries for Electric-Drive Vehicles, Argonne National Laboratory, 2011 Search PubMed.
- M. D. Johnson and R. E. Kirchain, IEEE Trans. Eng. Manag., 2010, 57, 634–648 CrossRef.
- A. Locascio, Int. J. Flex. Manuf. Sys., 2000, 12, 207–217 CrossRef.
- E. R. H. Fuchs, E. J. Bruce, R. J. Ram and R. E. Kirchain, J. Lightwave Technol., 2006, 24, 3175–3186 CrossRef.
- M. D. Johnson and R. E. Kirchain, Int. J. Prod. Econ., 2009, 119, 174–186 CrossRef PubMed.
- NIOSH, Occupational Exposure to Carbon Nanotubes and Nanofibers, 2010 Search PubMed.
- M. P. Groover, Automation, Production Systems, and Computer-integrated Manufacturing, Prentice Hall, 2008 Search PubMed.
- Trading Economics, United States Average Hourly Wages in Manufacturing, http://www.tradingeconomics.com/united-states/wages-in-manufacturing.
- R. Hischier and T. Walser, Sci. Total Environ., 2012, 425, 271–282 CrossRef CAS PubMed.
- NIOSH, Current Intelligence Bulletin Occupational Exposure to Carbon Nanotubes and Nanofibers, 2010 Search PubMed.
- W. H. Organization, Guidelines on quality risk management, 2011 Search PubMed.
- D. A. Notter, M. Gauch, R. Widmer, P. Wäger, A. Stamp, R. Zah and H.-J. Althaus, Environ. Sci. Technol., 2010, 44, 6550–6556 CrossRef CAS PubMed.
- G. Majeau-Bettez, T. R. Hawkins and A. H. Strømman, Environ. Sci. Technol., 2011, 45, 4548–4554 CrossRef CAS PubMed.
- V. S. Espinoza, S. Erbis, L. Pourzahedi, M. J. Eckelman and J. A. Isaacs, ACS Sustainable Chem. Eng., 2014, 2, 1642–1648 CrossRef CAS.
- J. A. Isaacs, C. L. Alpert, M. Bates, C. J. Bosso, M. J. Eckelman, I. Linkov and W. C. Walker, Environ. Syst. Decis., 2015, 35, 24–28 CrossRef.
Footnote |
| † Electronic supplementary information (ESI) available. See DOI: 10.1039/c5en00078e |
| This journal is © The Royal Society of Chemistry 2015 |

