DOI:
10.1039/C5RA10938H
(Paper)
RSC Adv., 2015,
5, 57223-57230
On the design of Ag–morin nanocomposite to modify calcium alginate gel: framing out a novel sodium ion trap†
Received
9th June 2015
, Accepted 23rd June 2015
First published on 23rd June 2015
Abstract
The present work describes the design of a Ag–morin nanocomposite and its subsequent incorporation in calcium alginate gels which have the unique property to uptake and release sodium ions. The nanocomposite reported here is the first of its kind and is capable of modifying the calcium alginate gels both physically and chemically. The corrugated surface morphology of calcium alginate becomes modified and becomes smoother upon incorporation of the nanocomposite. Rheological studies reveal an increased viscoelastic nature upon modification of calcium alginate gels which are developing as wound dressing materials. The modified gel will be supposedly a better dressing material as it can also handle saline solution which in turn is a prerequisite for wound healing treatment.
Introduction
Flavonoid compounds are secondary metabolites in plants that have no direct association with their growth or development. Several plant products like spices containing flavonoid compounds have found applications as disease preventives and therapeutic agents in traditional medicine.1 They are known to have antiviral,2,3 antimicrobial,4 anti-allergic,5 antiplatelet, anti-inflammatory6 and antitumor7 activities. Flavonoid compounds, are also popular for their oxygen radical scavenging and antioxidant properties.8,9 Morin (2′,3,4′,5,7-pentahydroxyflavone) is a flavonoid which consists of a yellowish pigment found in almond (Prunus dulcis), fig (Chlorophora tinctoria) and other moraceae used in food and herbal medicines.10 Morin has been reported to possess a variety of biological properties against oxidative stress-induced damage. It protects cardiovascular cells, glomerular mesangial cells, hepatocytes, oligodendrocytes and neurons against damage by oxidative stress.11–14 Morin exhibits protective actions against damage by γ-radiation.15 Irradiated cells generate reactive oxygen species (ROS), and morin, with its ROS scavenging effect, provides cytoprotective effects against γ-radiation induced cell damage. Recently, Zhang et al. have also reported morin's cellular protective action on hydrogen peroxide induced oxidative stress.16
Flavonoids at optimal combinations with each other are reported to act as antimicrobials for treatment of infectious diseases.17 The antibacterial actions of morin and its metal complexes (Mg2+, Ca2+, etc.) were also analyzed in vitro using different microorganisms by the well diffusion method.18 Metallation increases the antimicrobial activity by chelate formation.19,20 Silver ions also have proven medical applications. The medical uses of silver include wound dressings, and its use as an antibiotic coating in medical devices. The silver ion (Ag+) is bioactive and readily kills bacteria in vitro at sufficient concentrations.21 Silver in its ionic form as well as in nanocomposites are well known for antibacterial actions. It has high proficiency in killing a wide range of harmful bacteria species.
Calcium alginate biopolymer derived from seaweed forms a highly porous biodegradable absorbent often used as wound dressing material.22,23 They have been successfully applied to cleanse a wide variety of secreting lesions. The high absorption property limits wound secretions and minimizes bacterial contamination. Alginate dressings maintain a physiologically moist microenvironment that promotes healing and the formation of granulation tissue. Alginates can be rinsed away with saline irrigation, so removal of the dressing does not interfere with healing granulation tissue. This makes dressing changes virtually painless. Alginate dressings are very useful for moderate to heavily exudating wounds.24 For cavity wounds, alginate fibre traditionally packed with gauze soaked in saline, hypochlorite, or proflavine, are also used. To date alginates remain a poorly understood and probably underused dressing.25 Nevertheless alginate dressings have ample possibility of diverse modifications as can be seen from current literature.26 Silver alginate dressings were reported which showed efficient microbiostatic effect in wound healing.27 Keeping these in mind we have designed a silver–morin nanocomposite and incorporated it into calcium alginate biopolymer matrix. The present article describes the design, characterization and sodium ion adsorption–desorption kinetics of Ag–morin nanocomposite incorporated calcium alginate which may be used as advanced dressing materials.
Experimental
Materials
The flavonoid morin (3,5,7,2′,4′-pentahydroxyflavone) was obtained from B.D.H. Silver nitrate and calcium chloride dihydrate were purchased from MERCK. Sodium alginate, sodium acetate, acetic acid, tri sodium citrate, citric acid, di-sodium hydrogen phosphate, di-hydrogen sodium phosphate, sodium chloride, Triton-X-100 and all other chemicals used were of analytical grade and was used as received. Sodium ionic strength adjuster solution was obtained from Thermo Fisher Scientific and used for measurement of sodium ions.
Apparatus
A double beam Perkin-Elmer LS-55 with a 1% attenuator was used for fluorescence spectrometry studies; we have also used Horiba Jobin Yvon Fluorocube 01-NL and 291 nm Horiba nanoLED, IBH DAS-6 decay analysis soft ware for Time Correlated Single Photon Counting (TCSPC) lifetime spectroscopy. The UV visible spectra were obtained using an Agilent 8453 diode array spectrophotometer. A digital pH/ion meter Mettler (S 220 K) was used to measure and adjust the pH of different solutions. A sodium ion selective electrode (perfectION™ comb Na+, Mettler Toledo) was used to measure the concentration of sodium ions. A conductivity meter (JENWAY-4520) was used to measure the conductances of morin solution with different volume of silver solutions at 30 ± 2 °C. IR spectra were recorded in the region 400–4000 cm−1 with a Bruker Optics Alpha-T spectrophotometer as KBr pellets. A JEM 2100 transmission electron microscopy (TEM) was used to get the image of particle size of Ag–morin complex. Innova from Bruker AXS Pvt Ltd Atomic Force Microscopy (AFM) was used to get the image of particle size of Ag–morin complex in both the tapping and liquid modes. Carlzeiss EVO18 instrument was used for scanning electron microscopy (SEM). TA-ARG2 Rheometer was used for observing viscoelastic property of the gels.
Preparation of the reagents
0.5 mM methanolic solution of morin and 0.5 mM aqueous solution of silver nitrate were prepared. 0.1 M buffer solutions of different pH were prepared using tri-sodium citrate and citric acid (pH 3), sodium acetate and acetic acid (pH 5.6) and di-sodium hydrogen phosphate and di-hydrogen sodium phosphate (pH 7.3).
Spectral and conductance measurements
Absorbance, fluorescence and conductance were measured for a set of solutions with varying concentrations of AgNO3 added to a fixed volume of morin solution. Two absorbance maxima were observed at 500 and 290 nm and an emission peak was obtained at 510 nm after exciting at 290 nm.
Time Correlated Single Photon Counting (TCSPC) lifetime spectroscopy
Fluorescence lifetimes of morin and its silver complex were determined by the method of time correlated single-photon counting (TCSPC) using a nanosecond diode laser as the light source at 291 nm. The IBH DAS-6 decay analysis software was used to deconvolute the fluorescence decays. The mean fluorescence lifetimes for the decay curves were calculated from the decay times and the relative contribution of the components.26 Morin (2 mL, 0.5 mM) and AgNO3 (0.1–0.9 mL, 0.5 mM) solutions were mixed with different stoichiometric ratios. Volume was made upto 5 mL using pH 5.6 acetate buffer and the average life time of the complex species were identified.
Infrared measurement
Morin and AgNO3 solutions were mixed in 2![[thin space (1/6-em)]](https://www.rsc.org/images/entities/char_2009.gif) :1 ratio in pH 5.6 buffer medium and allowed to stand for one night. A brown colored solid product appeared which was then collected and dried. IR spectra were recorded in the region 400–4000 cm−1.
:1 ratio in pH 5.6 buffer medium and allowed to stand for one night. A brown colored solid product appeared which was then collected and dried. IR spectra were recorded in the region 400–4000 cm−1.
Transmission electron microscopy
The same above solution was also analyzed for its TEM image.
Atomic force microscopic measurement
A small droplet of the solution containing Ag–morin nanocomposite was placed on a glass slide, dried and covered with a cover-slip. AFM was done with this Ag–morin complex.
Incorporation of Ag–morin nanocomposite into calcium alginate biopolymer matrix
For incorporation of the Ag–morin complex into calcium alginate hydrogel, 3 mL 5 mM aqueous solution of AgNO3 was added to 6 mL 5 mM methanolic solution of morin in presence of 6 mL acetate buffer (pH = 5.6) and left overnight for complete reaction. The complex was then mixed into Na-alginate solution so as to make the final concentration of the solution 3% with respect to Na-alginate. Then the mixture was poured drop wise into 20% calcium chloride dihydrate solution with constant stirring using a magnetic stirrer which was kept in ice water. Dark brown colored beads were formed. These modified beads were kept refrigerated overnight in mother liquor and then washed with triple distilled water several times and were used for experiment. In the same way only morin incorporated Ca-alginate beads were also prepared.
Adsorption and desorption of Na+ ions
The prepared gel beads (30 in number under optimized conditions) were kept in 10 ppm NaCl solution under different conditions of pH and time interval. The sodium ions remaining in the supernatant solution was measured with the help of digital pH/ion meter and hence the amount of up taken sodium was calculated. The beads were then kept in triple distilled water for different time intervals and desorption of sodium was measured in a similar way.
Sample preparation for SEM imaging
The gel-beads formed upon incorporation of morin and Ag–morin nanocomposite in calcium alginate were placed on an aluminium mounting stub covered with a carbon tape. Then those gels were gold coated as the polymer is non-conducting and taken for SEM imaging. All the images were taken with 10 kV potential to avoid sample damage.
Preparation of the gels and their rheological studies
The rheological measurements of the prepared gels were carried out using steel parallel plates with 40 mm diameter at 25 °C. The rheometer was equipped with a Peltier circulator thermo cube for use with a Peltier plate that helps accurate control of temperature. A spacing of approximately 0.8 mm was used for all measurements. The dynamic shear moduli, (storage modulus G′ and loss modulus G′′) have been recorded in the linear viscoelastic regime at a frequency of 0.1 to 100 rad s−1.
Results and discussion
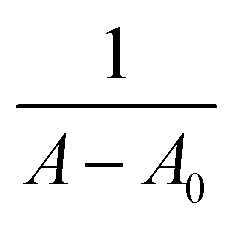
Morin shows a significant absorption peak at 500 nm wavelength which gradually intensifies with small additions of AgNO3 at all the three pHs studied (3, 5.6, 7.3). This indicates complexation of the morin with Ag+. The stability constants of the Ag+–morin complexes at these pHs were obtained from the absorbance values by varying Ag(I) concentrations using Benesi–Hildebrand (BH) equations.28| |
 | (1) |
where A is the absorbance of the experimental solution containing Ag and morin, A0 is the absorbance of the pure morin, A1 is the absorbance when morin is completely bound with the Ag, [M] is the metal ion concentration, K is the binding/association constant. Y represents  ; A represents
  and B represents
  .
.
Fig. 1 shows the increase in absorbance values with increasing Ag+ concentration and the BH plot of the Ag–morin complex at pH 5.6 is shown in Fig. 2. The binding constants of the complex at three different pHs are tabulated in Table 1.
 |
| | Fig. 1 Absorbance spectra of morin upon addition of Ag+ at pH 5.6 in methanol medium. | |
 |
| | Fig. 2 BH plot of Ag–morin complex at pH 5.6 in methanol medium. | |
Table 1 Binding constant and Stern–Volmer constant of Ag–morin complex at different pHs
| pH |
Binding constant (Kb) × 103 |
Ksv value × 103 |
| 3.00 |
3.21 |
3.00 |
| 5.60 |
7.05 |
16.78 |
| 7.30 |
4.98 |
4.35 |
The emission spectrum of morin solution upon slow addition of Ag+ (Fig. 3) shows considerable loss in emission intensity which might be due to restrictions in the electronic transitions upon metal ion complexation in the electron rich moiety of the compound. From this observation the Stern–Volmer constant was calculated using the equation
 |
| | Fig. 3 Emission spectra of morin excited at 290 nm upon addition of Ag+ at pH 5.6 in methanol medium. | |
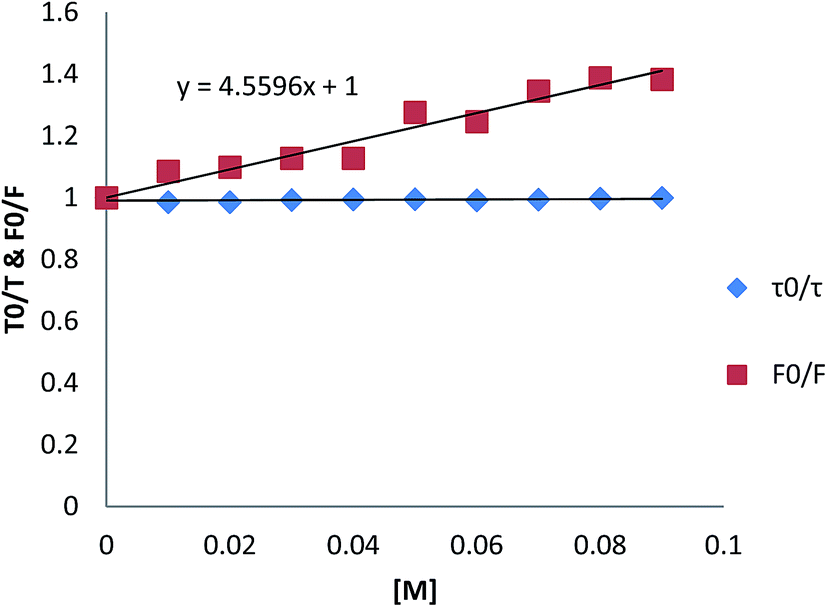
The F0/F value (where F0 and F are the steady state fluorescence intensity in absence and in presence of the quencher) show significant change with the quencher concentration. On the other hand the ratio of fluorescence lifetimes τ0/τ (without and with quencher ions) does not vary with increasing quencher concentration (Fig. 4). This suggests that the quenching of morin fluorescence with addition of Ag(I) is not dynamic collisional quenching.29 Rather the steady state fluorescence quenching indicates that there are molecular interactions in the ground state. The KSV value was found to be highest for the complexation at pH 5.6 (Table 1). Since both the binding constant and the Stern–Volmer constants are highest at pH 5.6, further investigations were carried out at this particular pH only.
 |
| | Fig. 4 Stern–Volmer plot of Ag–morin complex at pH 5.6 in methanol medium. | |
Fig. 5 shows the plot of conductance vs. Ag(I) concentration that was added to methanolic solution of morin. It can be seen that the conductance did not change significantly when concentration of the metal ion was increased gradually from 0.01 mM to 0.09 mM. It implies that the metal ions are not moving freely in the medium, and it forms a complex with morin.
 |
| | Fig. 5 Conductance of Ag–morin complex upon increasing the concentration of Ag. | |
Fig. S1 and S2† shows the IR spectra of pure morin and the nanocomposite respectively. In Fig. S1† a peak at 1614.5 cm−1 is observed due to C![[double bond, length as m-dash]](https://www.rsc.org/images/entities/char_e001.gif) O stretching, at 1510.7 cm−1 due to CC stretching, at 1168.65 cm−1 due to C–C stretching, at 831.18 cm−1 due to aromatic rings and a broad peak at 3270.8 cm−1 is observed due to intense hydrogen bonded –OH groups.30,31 In Fig. S2,† a sharp peak at 3433.67 cm−1 is observed due to the absence of H-bonded –OH groups which may have engaged in complexation with the metal in nanocomposite. A peak at 1567.53 cm−1 can be seen due to the metal oxygen bond stretching and a peak at 1414.88 cm−1 is due to NO3− ion coming from AgNO3 salt present outside the coordination sphere.
O stretching, at 1510.7 cm−1 due to CC stretching, at 1168.65 cm−1 due to C–C stretching, at 831.18 cm−1 due to aromatic rings and a broad peak at 3270.8 cm−1 is observed due to intense hydrogen bonded –OH groups.30,31 In Fig. S2,† a sharp peak at 3433.67 cm−1 is observed due to the absence of H-bonded –OH groups which may have engaged in complexation with the metal in nanocomposite. A peak at 1567.53 cm−1 can be seen due to the metal oxygen bond stretching and a peak at 1414.88 cm−1 is due to NO3− ion coming from AgNO3 salt present outside the coordination sphere.
The formation of the complex as nanocomposite was confirmed through some experiments and a stabilizing agent was required to prevent the nanoparticles from aggregation and precipitation. Triton X-100 is a surfactant and known to form micelles after a certain concentration (cmc). The micellar radius of pure 90% TX solution is nearly 4–5 nm.32 The dynamic light scattering (DLS) experiment gives an idea about the hydrodynamic radius of the components in solution. When morin is dissolved in 90% TX solution, DLS indicates that the micellar size is increased to ∼150 nm (Fig. 6). It implies that the –OH groups present in morin interact with the micellar H and OH of the surfactant molecule and the resultant size enhances. However, when the Ag–morin complex is taken in TX solution the micellar size again gets reduced to ∼18 nm (Fig. 6). Due to complexation free –OH groups of morin disappear and no interaction with the micellar H and OH is possible and hence the original radius of the micelle is observed. As the hydrodynamic radius is always a bit higher than the actual radius it could be seen from the TEM (Fig. 7) and AFM (Fig. 8) images of the same substances that the particle size remains ∼2 nm.
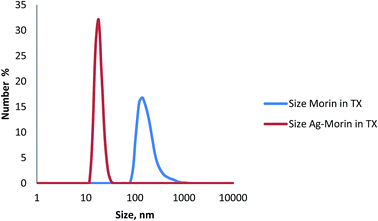 |
| | Fig. 6 Size distribution of pure morin and Ag–morin nanocomposite in TX medium. | |
 |
| | Fig. 7 TEM image of Ag–morin nanocomposite in TX medium. | |
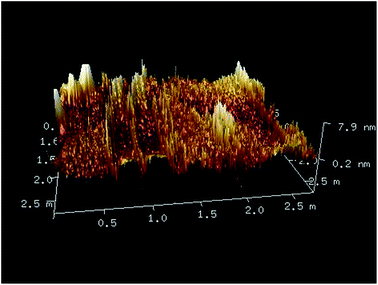 |
| | Fig. 8 AFM image of Ag–morin nanocomposite prepared in TX medium. | |
The scanning electron micrographs shown in Fig. 9(a)–(d) represent the surface morphology of the calcium alginate, morin incorporated calcium alginate, Ag–morin nanocomposite incorporated calcium alginate and its Na adsorbed form respectively. A comparison of the surface patterns of all the four materials indicate chemical modifications. It is clearly visible that the large undulations visible on the surface of calcium alginate gradually diminish as the incorporations add on from Fig. 9(a)–(d). In agreement with the egg box type model of calcium alginate gel the surface of the material is expected to be corrugated as can be seen in Fig. 9(a). This corrugated surface becomes modified with irregular granulations upon incorporation of morin (Fig. 9(b)). The granulations become intense and more organized as Ag–morin nanocomposite is incorporated (Fig. 9(c)). Granulations become even finer when the Ag–morin incorporated gels adsorb sodium ions, which is an indication towards involvement of the surface of the gel in the adsorption event (Fig. 9(d)). The surface modifications upon chemical incorporations are in agreement with several earlier reports.33,34 As the materials are suggested for practical applications we studied the rheological aspects of all types of gels (Fig. 10(a)–(c)). Keeping in mind that the dressing materials should have considerable mechanical strength in addition to their medicinal aptitude, their viscoelastic property was studied. A plot of the storage or loss modulus vs. applied strain for all the three gels shows appreciable viscoelasticity. The value of percent strain where the curves of storage and loss moduli intersect represents the strength of the viscoelastic material.35,36 For the calcium alginate gel, this value is at 6, for the morin incorporated gel it is ∼2 and the nanocomposite incorporated gel, this value rises above 20 indicating the highest mechanical strength for this particular gel. A slight decrease in this value (from 6 to 2) in morin incorporated calcium alginate gel is evidently because of lesser involvement of Ca in gel formation due to interference by morin which results in lesser cross-linking and lesser mechanical strength of the gel. However, in presence of the nanocomposite Ca is not made unavailable for cross linking, rather a physical association between the nanocomposite and gel material enhances the mechanical strength of the hydrogel which is reflected in Fig. 10(c).
 |
| | Fig. 9 (a) SEM image of calcium alginate gel (b) morin incorporated calcium alginate (c) Ag–morin nanocomposite incorporated calcium alginate (d) sodium adsorbed Ag–morin nanocomposite incorporated calcium alginate. | |
 |
| | Fig. 10 Variation of storage modulus G′ and loss modulus G′′ with percent strain in (a) calcium alginate gel (b) morin incorporated calcium alginate (c) Ag–morin nanocomposite incorporated calcium alginate. | |
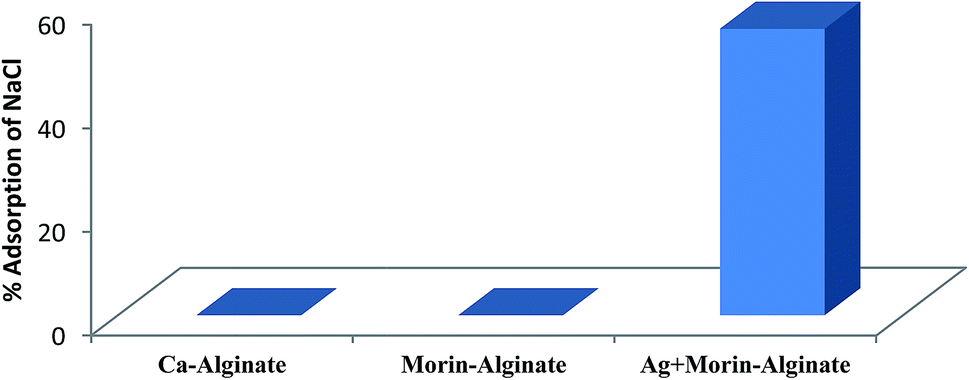
The nanocomposite incorporated gel is also superior to the other two in study as is evident from Fig. 11 which indicates sodium uptake property of this type of gel only. Sodium ions being very small in size have high mobility in different matrices. So, their uptake and release is mostly due to ion exchange type interactions. Calcium alginate is reported to have internal cavities that can entrap large molecules and result in intermolecular interactions therein.37 The sodium uptake experiment shows that upon incorporation of Ag–morin nanocomposite, the local environment in the gel changes and becomes suitable for sodium ion uptake. The pH dependent uptake behavior of sodium in the nanocomposite incorporated gel shows the highest uptake in slightly acidic medium, pH 3–5 (Fig. 12). At pH conditions higher or lower to this range sodium uptake diminishes. This is due to possible degradation of the gels in the medium. The time dependent uptake shows that a minimum of 2 hours is required for the uptake to start and after that certain decrease or increase is seen which is due to the dynamic equilibrium of adsorption and desorption processes (Fig. 13). The sodium adsorbed gels were then removed from the sodium containing solution and placed in triple distilled water for different time intervals to study the desorption of sodium (Fig. 14). The desorption starts right from 5 min interval and the extent of desorption then slightly decreases or increases which is again due to a dynamic equilibrium between the adsorption and desorption processes.
 |
| | Fig. 11 Adsorption of sodium ions in different type of beads. | |
 |
| | Fig. 12 pH dependent sodium ion adsorption by Ag–morin nanocomposite incorporated calcium alginate beads. | |
 |
| | Fig. 13 Time dependent sodium ion adsorption by Ag–morin nanocomposite incorporated calcium alginate beads. | |
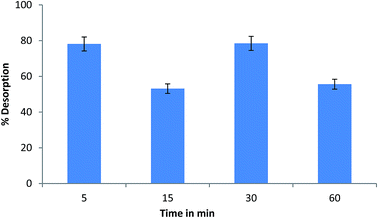 |
| | Fig. 14 Time dependent sodium ion desorption by Ag–morin nanocomposite incorporated calcium alginate beads. | |
Conclusion
Complexation of silver with the flavone, morin was confirmed by absorption, fluorescence and IR spectra. The formation of the nanocomposite due to complexation was confirmed by DLS, TEM and AFM images. The nanocomposite was used to modify the popularly used calcium alginate gel. The developed gel material produced after incorporation of silver–morin nanocomposite in calcium alginate biopolymer shows better viscoelastic behavior, lesser porosity and better sodium uptake property than the morin incorporated calcium alginate and only calcium alginate gels. The sodium adsorbed modified material also releases the sodium ions in water within a short time period. As wound dressing materials need a crucial sodium ion uptake and release behavior as discussed in the introduction, the developed system may be of potential application in this field.
Acknowledgements
Kangkana Sarkar gratefully acknowledges the University Grants Commission (UGC) (Ref. No. UGC/330/Jr. Fellow (Sc) dated 25.03.2013) for providing necessary fellowship. We thank Ms Urmila Goswami, and Mr Pratyush Sengupta Centre for Research in Nanoscience and Nanotechnology, University of Calcutta, India, for obtaining TEM and SEM images. We also thank Prof A. K. Sil and Ms Puja Biswas, University of Calcutta, India, for obtaining AFM images. We are thankful to Dr Abhijit Saha, UGC-DAE Consortium for Scientific Research, Kolkata, India for DLS experiment.
References
- T. Iwashina, J. Plant Res., 2000, 113, 287–299 CrossRef CAS.
- L. C. Chiang, W. Chiang, M. C. Liu and C. C. Lin, J. Antimicrob. Chemother., 2003, 52, 194–198 CrossRef CAS PubMed.
- S. Khadem and R. J. Marles, Molecules, 2012, 17, 191–206 CrossRef CAS PubMed.
- T. P. T. Cushnie and A. J. Lamb, Int. J. Antimicrob. Agents, 2011, 38, 99–107 CrossRef CAS PubMed.
- T. Inoue, Y. Sugimoto, H. Masuda and C. Kamei, Biol. Pharm. Bull., 2002, 25, 256–259 CAS.
- G. N. Sharma, S. K. Dubey, N. Sati and J. Sanadya, Int. J. Pharm. Sci. Drug Res., 2011, 3, 214–218 CAS.
- D. Sawatzky, D. Willoughby, P. Colville-Nash and A. Rossi, Am. J. Pathol., 2006, 168, 33–41 CrossRef CAS PubMed.
- M. Lopez-Lazaro, Curr. Med. Chem.: Anti-Cancer Agents, 2002, 2, 691–714 CrossRef CAS.
- N. Andarwulan, R. Batari, D. A. Sandrasari, B. Bolling and H. Wijaya, Food Chem., 2010, 121, 1231–1235 CrossRef CAS PubMed.
- B. Uttara, A. V. Singh, P. Zamboni and R. T. Mahajan, Curr. Neuropharmacol., 2009, 7, 65–74 CrossRef CAS PubMed.
- M. X. Xie, M. Long, Y. Liu, C. Qin and Y. D. Wang, Biochim. Biophys. Acta, 2006, 1760, 1184–1191 CrossRef CAS PubMed.
- L. D. Kok, Y. P. Wong, T. W. Wu, H. C. Chan, T. T. Kwok and K. P. Fung, Life Sci., 2000, 67, 91–99 CrossRef CAS.
- D. Grassi, G. Desideri and C. Ferri, Nutrients, 2010, 2, 889–902 CrossRef CAS PubMed.
- V. Sivaramakrishnan, P. N. M. Shilpa, V. R. P. Kumar and S. N. Devaraj, Chem.-Biol. Interact., 2008, 171, 79–88 CrossRef CAS PubMed.
- M. Gottlieb, R. Leal-Campanario, M. R. Campos-Esparza, M. V. Sanchez-Gomez, E. Alberdi and A. Arranz, et al., Neurobiol. Dis., 2006, 23, 374–386 CrossRef CAS PubMed.
- R. Zhang, K. A. Kang, M. J. Piao, Y. H. Maeng, K. H. Lee and W. Y. Chang, et al., Chem.-Biol. Interact., 2009, 177, 21–27 CrossRef CAS PubMed.
- V. K. Parihar, K. R. Prabhakar, V. P. Veerapur, K. I. Priyadarsini, M. K. Unnikrishnan and C. M. Rao, Eur. J. Pharmacol., 2007, 557, 58–65 CrossRef CAS PubMed.
- P. Goyal, B. K. Aggarwal and S. Garg, Hacettepe J. Biol. Chem., 2010, 38, 255–258 Search PubMed.
- Q. K. Panhwar and S. Memon, J. Coord. Chem., 2011, 64, 2117–2129 CrossRef CAS PubMed.
- M. V. Kaveri, R. Prabhakaran, R. Karvembu and K. Natarajan, Spectrochim. Acta, Part A, 2005, 61, 2915–2918 CrossRef CAS PubMed.
- A. Bravo and J. R. Anacona, Transition Met. Chem., 2001, 26, 20–23 CrossRef CAS.
- S. Y. Ahn, C. H. Mun and S. H. Lee, RSC Adv., 2015, 5, 15172–15181 RSC.
- J. L. Shamshina, G. Gurau, L. E. Block, L. K. Hansen, C. Dingee, A. Walters and R. D. Rogers, J. Mater. Chem. B, 2014, 2, 3924–3936 RSC.
- G. J. Motta, Ostomy Wound Manage., 1989, 25, 52–56 CAS.
- J. W. Doyle, T. P. Roth, R. M. Smith, Y. Q. Li and R. M. Dunn, J. Biomed. Mater. Res., 1996, 32, 561–568 CrossRef CAS.
- S. J. Hooper, S. L. Percival, K. E. Hill, D. W. Thomas, A. J. Hayes and D. W. Williams, Int. Wound J., 2012, 9, 633–642 CrossRef PubMed.
- S. L. Percival, W. Slone, S. Linton, T. Okel, L. Corum and J. G. Thomas, Int. Wound J., 2011, 8, 237–243 CrossRef PubMed.
- D. P. Berry, S. Bale and K. G. Harding, J. Wound Care, 1996, 5, 10–17 CAS.
- S. K. Ghatak, D. Dey, S. Sen and K. Sen, Analyst, 2013, 138, 2308–2314 RSC.
- P. J. Sadler and Z. Guo, Pure Appl. Chem., 1998, 70, 863–871 CrossRef CAS.
- E. Santi, M. H. Torre, E. Kremer, S. B. Etcheverry and E. J. Baran, Vib. Spectrosc., 1993, 5, 285–290 CrossRef CAS.
- M. A. Zayed, F. A. Nour El-Dien, G. G. Mohamed and N. E. A. El-Gamel, Spectrochim. Acta, Part A, 2004, 60, 2843–2852 CrossRef CAS PubMed.
- X. Chen, L. Liu, K. Liu, Q. Miao and Y. Fang, J. Mater. Chem. A, 2014, 2, 10081–11008 CAS.
- L. B. Sun, X. Q. Liu and H. C. Zhou, Chem. Soc. Rev., 2015 Search PubMed , in press.
- P. Samaddar and K. Sen, J. Sol-Gel Sci. Technol., 2015, 73, 389–395 CrossRef CAS.
- J. D. Ferry, Viscoelastic Properties of Polymers, Wiley, 3rd edn, 1980 Search PubMed.
- F. Stops, J. T. Fell, J. H. Collett and L. G. Martini, Int. J. Pharm., 2008, 350, 301–311 CrossRef CAS PubMed.
Footnote |
| † Electronic supplementary information (ESI) available. See DOI: 10.1039/c5ra10938h |
|
| This journal is © The Royal Society of Chemistry 2015 |
Click here to see how this site uses Cookies. View our privacy policy here. 

 ; A represents
  and B represents
  .
.