
 Open Access Article
 This Open Access Article is licensed under a
 Creative Commons Attribution 3.0 Unported Licence
Quantifying drought-driven temperature impacts on ozone disinfection credit and bromate control†
Bilal
Abada
 ,
Ariel J.
Atkinson
and
Eric C.
Wert
*
,
Ariel J.
Atkinson
and
Eric C.
Wert
*
Southern Nevada Water Authority (SNWA), P.O. Box 99954, Las Vegas, NV 89193-9954, USA. E-mail: bilal.abada@snwa.com; ariel.atkinson@snwa.com; eric.wert@snwa.com
First published on 5th April 2024
Abstract
Climate change and drought can lead to unprecedented changes in surface water temperature requiring utilities to examine their ozone system's disinfection capability while minimizing bromate production. This pilot-scale study investigated temperature (15–30 °C) as a single/isolated variable affecting ozone operating performance (demand, decay rate, exposure (CT)) and the ability to achieve a Cryptosporidium log reduction value (LRV) of 0.5–1.5![[thin space (1/6-em)]](https://www.rsc.org/images/entities/char_2009.gif) logs, as defined by the United States Environmental Protection Agency (USEPA). When dosing 3.0 mg L−1 of ozone into a surface water with 2.5 mg L−1 of total organic carbon, an increase in temperature from 15 °C to 30 °C increased ozone demand in the dissolution zone from 1.0 mg L−1 to 1.6 mg L−1 (60%) and ozone decay rate from 0.07 min−1 to 0.27 min−1 (385%). Despite more rapid demand/decay, the required ozone dose to achieve an LRV of 1.5logs remained at 2.4–2.8 mg L−1 due to the reduction in USEPA's CT requirement at higher temperatures (9.35 mg min L−1 at 15 °C vs. 2.31 mg min L−1 at 30 °C). Bromate formation exceeded the USEPA maximum contaminant level of 10 μg L−1 when ozone was dosed to achieve LRV > 0.5log at all temperature conditions. Chlorine–ammonium pretreatment (0.5 mg L−1 Cl2, 0.1–0.5 mg L−1 NH4+-N) lowered bromate formation to <5 μg L−1 under ambient (80 μg L−1) and elevated (120 μg L−1) bromide concentrations at all temperatures. These results were applied to evaluate a full-scale ozone system designed to achieve an LRV of 1.5logs if drought increases temperature from 13 °C to 26 °C. The study systematically examined the role of temperature on ozone system performance, which can assist utilities planning for future drought-driven changes.
logs, as defined by the United States Environmental Protection Agency (USEPA). When dosing 3.0 mg L−1 of ozone into a surface water with 2.5 mg L−1 of total organic carbon, an increase in temperature from 15 °C to 30 °C increased ozone demand in the dissolution zone from 1.0 mg L−1 to 1.6 mg L−1 (60%) and ozone decay rate from 0.07 min−1 to 0.27 min−1 (385%). Despite more rapid demand/decay, the required ozone dose to achieve an LRV of 1.5logs remained at 2.4–2.8 mg L−1 due to the reduction in USEPA's CT requirement at higher temperatures (9.35 mg min L−1 at 15 °C vs. 2.31 mg min L−1 at 30 °C). Bromate formation exceeded the USEPA maximum contaminant level of 10 μg L−1 when ozone was dosed to achieve LRV > 0.5log at all temperature conditions. Chlorine–ammonium pretreatment (0.5 mg L−1 Cl2, 0.1–0.5 mg L−1 NH4+-N) lowered bromate formation to <5 μg L−1 under ambient (80 μg L−1) and elevated (120 μg L−1) bromide concentrations at all temperatures. These results were applied to evaluate a full-scale ozone system designed to achieve an LRV of 1.5logs if drought increases temperature from 13 °C to 26 °C. The study systematically examined the role of temperature on ozone system performance, which can assist utilities planning for future drought-driven changes.
Water impactDrought-driven water quality changes warrant evaluation by utilities. This work demonstrates the value of pilot-scale testing to evaluate changing temperature conditions on a full-scale ozone facility (i.e. demand, decay rate, CT) while maintaining regulatory compliance (i.e. Cryptosporidium, bromate). The findings can be applied by utilities to better prepare for future temperature fluctuations related to climate change. |
Introduction
Climate change is driving more extreme weather conditions and prolonged drought in some areas, resulting in water quality changes (i.e. temperature, total organic carbon (TOC), bromide, pH, etc.). Water systems that have typically treated stratified lake water from the hypolimnion region (i.e. cold water) may need to treat water from epilimnion region (i.e. warmer water) leading to unprecedented changes in water temperature (i.e., higher maximum, lower minimum).1,2 In addition, dwindling surface water supplies under the influence of increasing wastewater flows may experience public health and water quality concerns related to increased occurrence of pathogens (i.e., viruses, Cryptosporidium, Giardia) and cyanobacteria blooms (i.e., cyanotoxins, taste and odor compounds).3,4 These potential water quality changes place greater importance on the reliability of multi-barrier drinking water treatment systems. Ozone treatment can be a critically important barrier, as it effectively mitigates these water quality issues through pathogen inactivation and chemical contaminant oxidation.5,6 However, existing ozone systems may require re-examination of their original design and operational criteria to ensure that treatment goals can be met during drought-driven water quality scenarios.7,8Regulations governing ozone disinfection credit and compliance are temperature dependent. The United States Environmental Protection Agency (USEPA) regulates Giardia lamblia and viruses under the Surface Water Treatment Rule (SWTR), by treatment technique, requiring log reduction values (LRVs) of 3 and 4logs, respectively.9Cryptosporidium is regulated under the USEPA Long Term 2 Enhanced Surface Water Treatment Rule (LT2ESWTR), with LRV requirements determined by Cryptosporidium raw water occurrence and associated bin classification.10 LRVs for Cryptosporidium (eqn (1)), Giardia (eqn (2)), and viruses (eqn (3)) are calculated as a function of water temperature (in °C) and ozone exposure (i.e., CT in mg min L−1) according to the USEPA LT2ESWTR Guidance Manual.11 The ozone CT requirements decrease as the temperature and efficiency of microbial inactivation increases.12
| LRVCryptosporidium = 0.0397 × 1.09757Temp × CT; | (1) |
| LRVGiardia = 1.0380 × 1.0741Temp × CT; | (2) |
| LRVvirus = 2.1744 × 1.0726Temp × CT; | (3) |
Warmer water temperatures can also accelerate the production of disinfection byproducts (DBPs), which must be balanced with treatment goals.13 Bromate is an ozone DBP regulated under the USEPA Stage 2 Disinfectants/DBP Rule, with a maximum contaminant level (MCL) of 10 μg L−1.14 Increased temperature and/or ozone dosing requirements can enhance the rate of bromate production and bring its concentration above the MCL.13,15 Accordingly, bromate formation and control should be evaluated simultaneously as part of the ozone testing matrix. Ammonium addition, chlorine–ammonium (Cl2–NH4+–N) addition, and pH adjustment, upstream of ozonation have demonstrated efficacy to mitigate bromate.16 The Cl2–NH4+–N pretreatment approach has some advantages compared to ammonium-only and pH adjustment since it does not require the use of corrosive acid/base and achieves up to 94% bromate reduction depending on treatment conditions.16–18 During the process, Cl2–NH4+–N combine to form monochloramine (NH2Cl) ahead of the ozone contactor, which disrupts both ozone and hydroxyl radical (˙OH) pathways toward bromate formation.16,19 The efficacy of Cl2–NH4+–N pretreatment to minimize bromate at elevated temperature has not been well examined in the literature.
Higher water temperatures impact ozone system performance by accelerating ozone demand and decay rate resulting in reduced ozone exposure (∫[O3]dt).12,20,21 Temperature-driven ozone decomposition also accelerates production of hydroxyl radicals (˙OH), which may also contribute toward meeting water quality goals.20,22 However, the overall hydroxyl radical exposure (∫[˙OH]dt) may remain relatively unchanged, as was demonstrated when temperature was varied from 5–35 °C during a bench-scale study using Lake Zurich water.21 This was likely associated with using a consistent organic matter matrix comprised of initiators, promoters, and scavengers.23 As a result, increased temperature can be expected to have greater impact on meeting treatment goals related to ozone exposure versus hydroxyl radical exposure.
Systematic temperature evaluations on ozone process performance are limited in the literature, often being performed at either bench-scale or full-scale and confounded by other water quality and operational factors. Bench-scale studies often involve the addition of a chilled concentrated ozone stock solution (∼2 °C) into a sample at room temperature (20 °C). The scalability of the bench-scale ozone dissolution method, mixing, temperature dynamics, and dilution of the samples are not well evaluated.21 In addition, ozone demand is sometimes defined in bench-scale batch systems as the first 30 seconds of ozone decomposition (i.e., initial ozone demand (IOD)),22 which differs from pilot- and full-scale systems. In pilot- and full-scale systems, ozone demand in the dissolution zone (ODdiss) is defined as the difference between the transferred ozone dose and the initial ozone residual (Cin) at the beginning of the credited disinfection zone, which could involve minutes of contact time depending on hydraulic conditions.22,24 Full-scale studies investigating temperature effects often evaluate data from different seasons. These seasonal changes introduce additional water quality variability (e.g., total organic carbon (TOC) concentration, type of dissolved organic matter, pH, alkalinity) that can also influence ozone demand and decay.20,25 Pilot-scale studies have flexibility similar to bench-scale testing while simulating full-scale conditions in terms of ozone dissolution, design, and operation.
This pilot-scale study investigated temperature as a single water quality variable affecting ozone operation, which addresses experimental limitations associated with bench-scale and full-scale studies. The specific objectives of this study were to examine the effect of temperature (15–30 °C) and ozone dose (1–3 mg L−1) on (i) ozone demand, (ii) ozone decay rate, (iii) operating conditions required to meet a range of Cryptosporidium LRVs from 0.5–1.5logs following USEPA guidance;11 and (iv) bromate formation and control using Cl2–NH4+–N pretreatment with Cl2:N mass ratios between 1:1 and 5:1. Hydroxyl radical exposure was not examined as part of this study due to added complexity of dosing an ˙OH probe compound at pilot-scale and since ˙OH are typically considered insignificant contributors to disinfection compared to ozone.15 The pilot-scale results were applied to a full-scale ozone system design (Southern Nevada Water Authority (SNWA), Las Vegas, NV, USA) to evaluate Cryptosporidium LRV targets under anticipated warm water conditions (∼26 °C) due to prolonged drought conditions within the Colorado River watershed. While Lake Mead modeling has projected additional drought-driven water quality changes (i.e. TOC, pH) that can impact ozone performance, this study systematically evaluates the role of the anticipated temperature changes on ozone performance as a single variable.2,7,8
Materials and methods
Pilot plant description
A 10 gpm (37.8 L min−1) pilot plant (Intuitech Inc., Salt Lake City, UT, USA) was used to treat raw Colorado River water from Lake Mead, NV, USA. The pilot plant included three modules: (1) a raw water skid, (2) a temperature adjustment skid, and (3) an ozone skid (Fig. 1). The raw water skid collected online water quality data (e.g., pH, turbidity, conductivity, and chlorine) and has three chemical application points used to dose bromide, chlorine, and ammonium. Following the raw water skid, the water flow was split evenly into two trains before entering the temperature adjustment skid. The dual-train configuration enabled two temperature-independent tests to be performed simultaneously, which allowed both direct temperature comparisons and accelerated the testing schedule. The temperature adjustment skid used electronic inline heaters (WATTCO FLS3-200X0245T-54945-1, Lachine, Quebec, Canada) on both trains to achieve temperatures of up to 30 °C within 4–5 min in the ozone contactor influent (Fig. S1 and S2†). Steady state conditions were achieved in the ozone contactor effluent within 60 min following a temperature adjustment (Fig. S2†). After temperature adjustment, water flow entered the ozone skid with a theoretical hydraulic detention time (HDT) of 6–7 minutes in the dissolution zone (column 1) and 30–35 min in the disinfection zone (columns 2–6). The ozone module created ozone feed gas from ambient air using an oxygen concentrator (OGSI OG-20-OEMC-24, Oxygen Generating Systems Intl., Tonawanda, NY, USA) and ozone generator (PTI O3 Gen 2 (20 g), Plasma Technics Inc., Racine, WI, USA). The ozone feed gas was measured with an online analyzer (BMT 964, BMT Messtechnik, Gmbh, Stahnsdorf, Germany) and controlled using a mass flow controller (ALICAT Scientific, Tucson, AZ, USA). The ozone contactors were operated with fine bubble diffusion (FBD) with a T10/T ratio of 0.65 confirmed through tracer testing (Text S1, Fig. S3 and Table S1†). Each contactor chamber included the following: eight grab sampling ports distributed evenly throughout each column, three online dissolved ozone analyzers (Rosemount™ 499AOZ, Emerson, Chanhassen, MN, US), and one online dissolved oxygen and temperature analyzer (Thermo Scientific AquaSensor DO DataSticks, Beverly, MA, USA). Calcium thiosulfate was dosed into each ozone contactor effluent (0.05 mg L−1) and the waste stream from all online analyzers (0.2 mg L−1) to quench any residual ozone. Ozone off gas was measured using an online analyzer (BMT) and used to calculate mass transfer efficiency between 94–98% (Fig. S4†). The effect of water temperature on gas–liquid mass transfer efficiency was not systematically evaluated, though may be expected to decrease as temperature increases.26
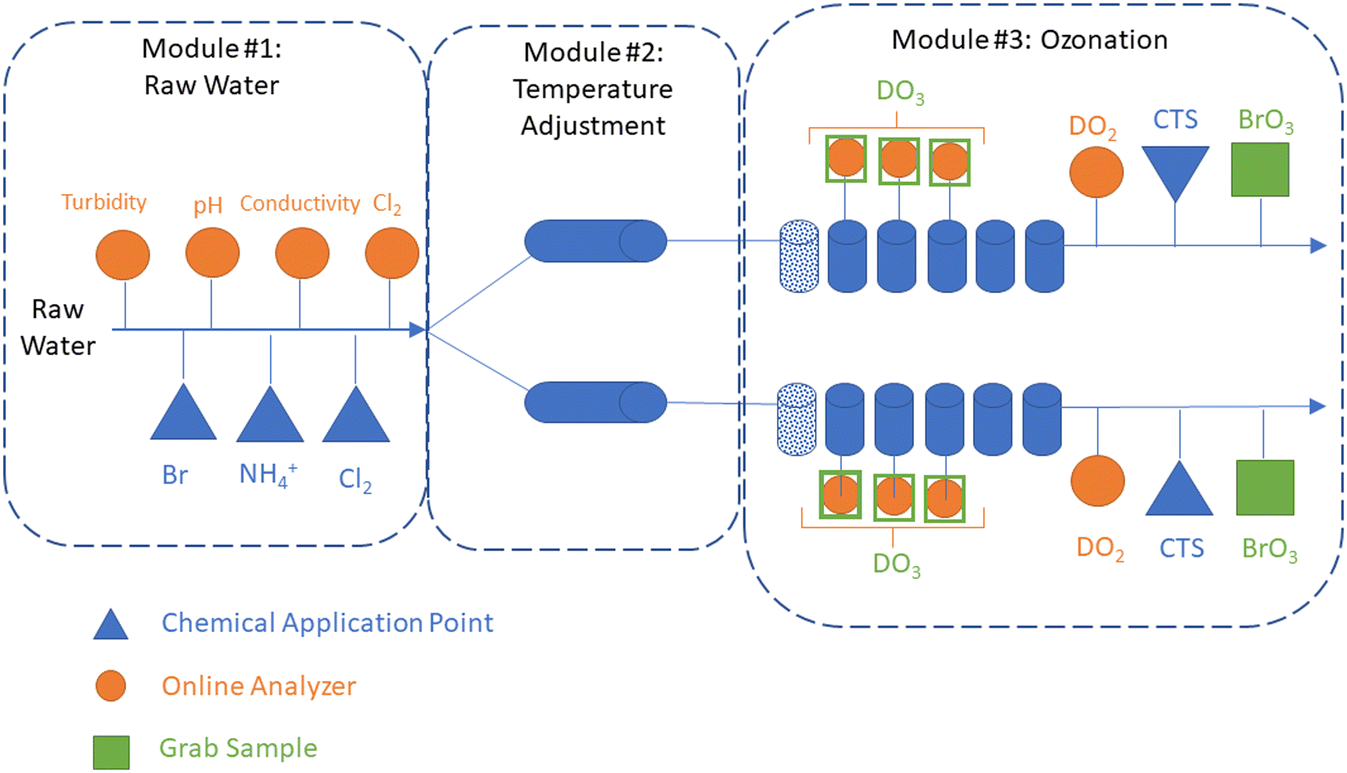 | ||
| Fig. 1 Schematic of pilot-scale testing system: raw water module, temperature adjustment module, and ozonation module. The figure depicts that after raw water module, the flow is split into two parallel trains to enable two temperature-independent tests to be completed simultaneously. Chemical application points are identified for chlorine (Cl2), ammonium (NH4+), bromide (Br−), and calcium thiosulfate (CTS). Online analyzer locations are identified for turbidity, pH, conductivity, chlorine (Cl2), dissolved oxygen (DO2), and dissolved ozone (DO3). Grab sample locations are identified for DO3 and BrO3−. A photo of the pilot-scale water heaters is shown in Fig. S1.† | ||
Ozone process operation used the online instrumentation identified previously along with dissolved ozone grab sample analysis to determine several operational parameters: transferred ozone dose (DO3,transferred) (eqn (4)), first-order ozone decay rate constant (k*) (eqn (5)), initial dissolved ozone residual (Cin) at the entry point of the disinfection zone (eqn (6)), and ozone demand in the dissolution zone (ODdiss) calculated as the difference between DO3,transferred and Cin. Ozone CT was calculated using grab sample data according to the extended integrated T10 method adapted from the LT2ESWTR Toolbox Guidance Manual as shown in eqn (7).11,27 The online dissolved ozone analyzer data was used for process verification and not included in the ozone CT calculation. LRV calculations were determined according to LT2ESWTR guidance according to eqn (1)–(3). A visual depiction of these parameters is included in Fig. S5.†
 | (4) |
 | (5) |
| Cin = C1 × ek*×HDT1 | (6) |
 | (7) |
Experimental plan
Pilot-scale experiments were performed to identify the required transferred ozone dose (∼1–3 mg L−1) to achieve Cryptosporidium LRVs of 0.5, 1.0, and 1.5log at water temperatures of 15, 20, 26, and 30 °C. Bromate control using the Cl2–NH4+–N pretreatment process was evaluated under similar operating conditions. The chemical application points on the raw water skid were used to dose sodium hypochlorite and ammonium chloride ahead of the temperature adjustment skid. Sodium hypochlorite was dosed into the raw water to produce a measured total chlorine (Cl2) residual concentration of 0.5 ± 0.1 mg L−1 at the point of injection. Ammonium chloride was dosed 7 s downstream of chlorine addition to produce NH4+–N concentration of either 0, 0.1, 0.3, or 0.5 mg L−1. While these dosing scenarios are expected to produce similar concentrations of monochloramine, the Cl2:N mass ratio was varied based on breakpoint chlorination chemistry28 from 1:1 (excess ammonium), 3:1 (excess ammonium), and 5:1 (optimal) to investigate whether excess NH4+ conditions demonstrate any added benefit for bromate control. The Cl2–NH4+–N contact time was 95–100 seconds before the ozone dissolution zone (first column). Free and total chlorine were measured 3–4 seconds downstream of chlorine addition, 1–2 seconds downstream of NH4+–N addition, at the ozone influent, and at the ozone effluent (Table S2†). In select experiments bromide was supplemented by spiking potassium bromide (KBr) as 40 μg L−1 bromide to achieve a total (ambient + spiked) bromide concentration in the raw water of 120 μg L−1. Tests with no Cl2–NH4+–N pretreatment were run in duplicate, while all other tests were conducted once.
During the period of testing, the raw water had the following water quality characteristics (i) based on online instrumentation: temperature (14.6–15.4 °C), pH (7.5–7.8), turbidity (0.6–0.9 NTU), and conductivity (850–980 μS cm−1), and (ii) based on grab samples: total alkalinity (140–144 mg L−1 as CaCO3), TOC (2.4–2.6 mg L−1), and bromide (81–82 μg L−1).
Analytical methods
Raw water TOC (Standard methods (SM) 2540C-2017),29 alkalinity (SM 2320B-2017), and bromide (EPA300.0)30 samples were collected and analyzed at least once a week, as daily fluctuations were not expected based on full-scale water quality monitoring. Bromate samples were collected after each testing condition in sample bottles containing 50 mg L−1 ethylenediamine (EDA) as a quenching agent and analyzed using EPA Method 326.0.31 UV254 samples were measured in the raw water and ozone effluent (EPA415.3)32 for tests at ozone doses required to achieve LRV of 1.5logs at different temperatures and Cl2–NH4+ pretreatment conditions. Also, UV254 measurements were taken for various ozone dosing scenarios for tests without Cl2–NH4+ pretreatment and at 20–30 °C. Free and total chlorine were measured in the ozone contactor influent and effluent following each temperature and Cl2–NH4+–N condition using a Hach pocket colorimeter and the SwifTest DPD reagent. Grab samples for dissolved ozone residual were analyzed using the indigo trisulfonate method (SM 4500-O3).29,33
Results and discussion
Effects on ozone demand (initial phase)
Pilot study results showed that ODdiss increased linearly as the transferred ozone dose increased at each temperature condition (Fig. 2 and S6†). At 15 °C, ODdiss increased by 285% from 0.35 mg L−1 to 1.0 mg L−1 as the transferred ozone dose increased from 1.0 mg L−1 to 3.0 mg L−1, respectively. At 30 °C, the ODdiss increased by 225% from 0.70 mg L−1 to 1.6 mg L−1 over a similar ozone dose range. The proportional ozone dose response with ODdiss relates to the extent of ozone oxidation of the dissolved organic matter (DOM) mixture in Colorado River water occurring during this initial phase.6,34–37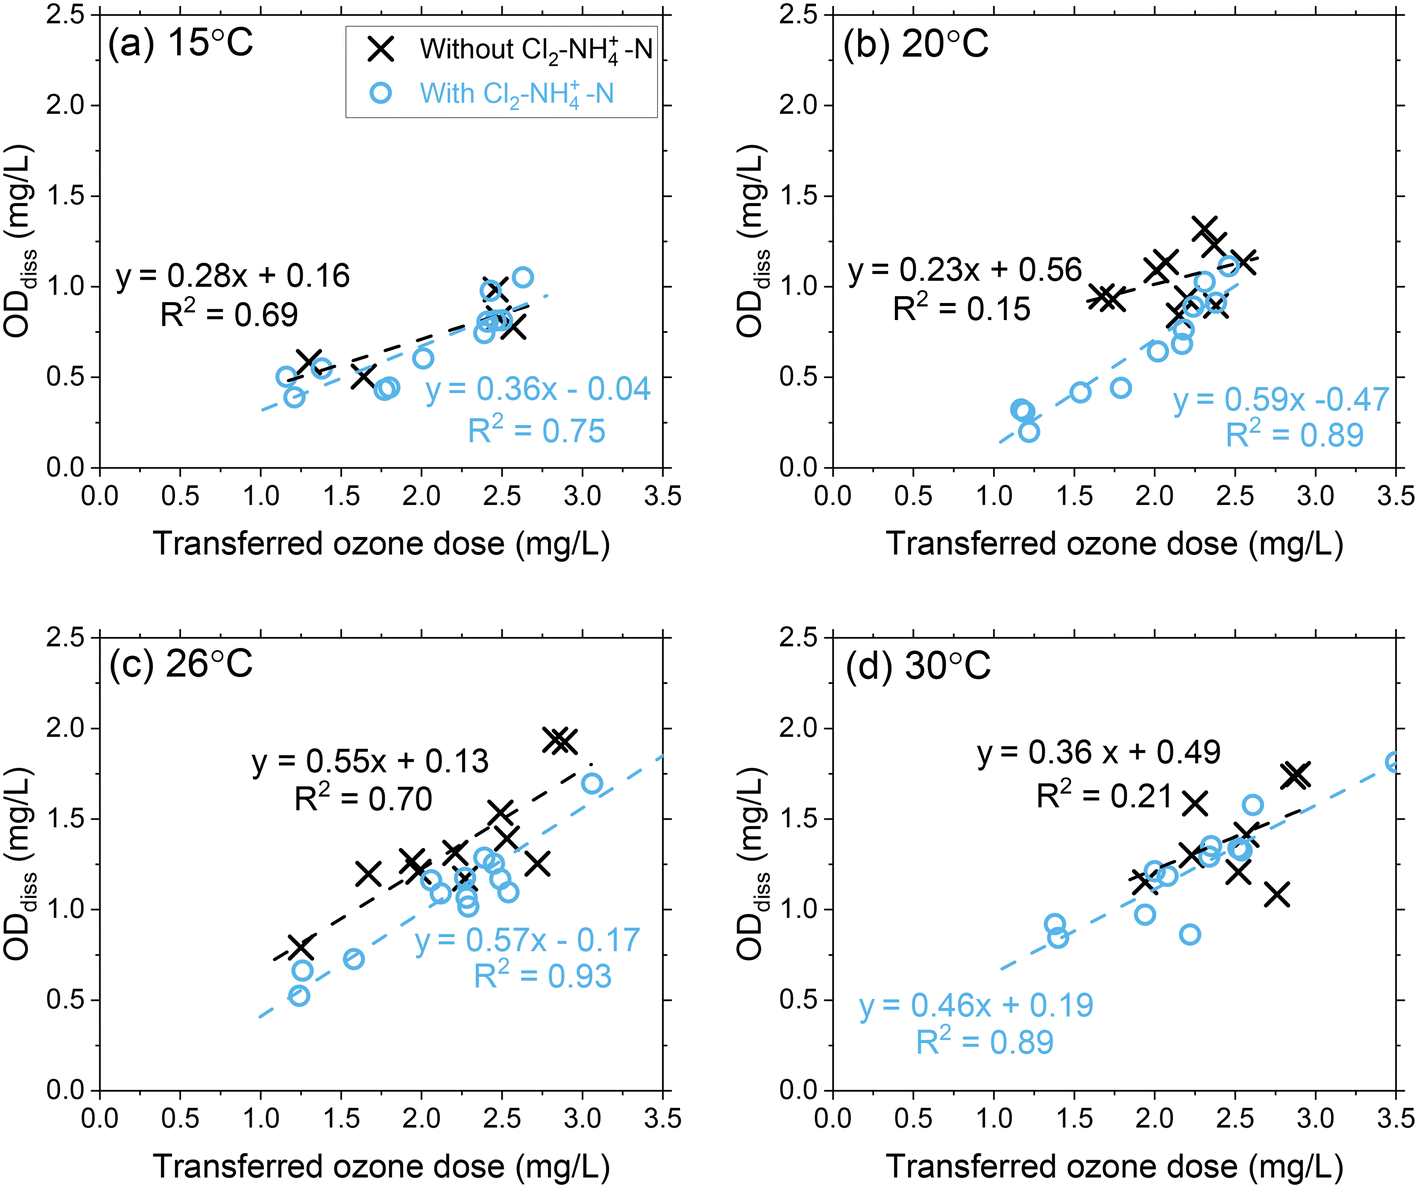 | ||
| Fig. 2 Pilot-scale data depicting correlations between ODdiss as a function of the transferred ozone doses at (a) 15 °C, (b) 20 °C, (c) 26 °C, and (d) 30 °C. Pilot-scale results illustrating the different Cl2–NH4+–N dosing scenarios are presented in Fig. S5.† | ||
DOM transformation has been evaluated as the primary source of ozone decomposition for decades and documented through second-order rate constants (kO3) for the ozone reactions with specific functional groups and transformation of DOM from high molecular weight compounds to low molecular weight compounds.38–41 The heterogenous mixture of functional groups within DOM can initiate ozone decomposition through reactions spanning several orders of magnitude with aromatic compounds (kO3 < 0.1 to 109 M−1 s−1), olefins (kO3 = 10–106 M−1 s−1), heterocyclic compounds (kO3 < 0.1–108 M−1 s−1), aliphatic amines (kO3 = 103–108 M−1 s−1) and aliphatic nitrogen-containing compounds (kO3 < 1–106 M−1 s−1).35 These DOM reactivities and their relevance to ODdiss may be better contextualized through micropollutant groupings with a similar range of reaction rate constants.42,43 Micropollutants (and corresponding DOM components) with high second-order rate constants (group I: kO3 > 105 M−1 s−1) can be expected to react rapidly with ozone (>90%) and included in the ODdiss calculation. Whereas micropollutants (and corresponding DOM components) with moderate reactivity (Group IIA: 103 < kO3 < 105 M−1 s−1; Group IIB: 10 < kO3 < 103 M−1 s−1) require greater ozone exposure to achieve similar extents of abatement. As the ozone dose increases, a greater proportion of group I/IIA DOM components are included in the ODdiss calculation. As temperature increases from 15 °C to 30 °C, the reactivity of group IIA DOM components are higher leading to an increased ODdiss.39
As discussed previously and demonstrated in other studies, the ozone demand phase exhibits an enhanced formation of ˙OH similar to advanced oxidation process (AOP) characteristics (∫[˙OH]dt) via reactions with different organic and inorganic water quality constituents.21,22,36,44 As the ODdiss increases with ozone dose, the ∫[˙OH]dt increases during this initial phase, which also contributes to additional ozone decomposition via the hydroxyl radical chain reaction (kO3 ∼ 108–109 M−1 s−1).6,20 While DOM is responsible for initiating ozone decomposition and the corresponding production of ˙OH, some DOM components along with carbonate may also serve as inhibitors, which reduces ˙OH availability and terminates the chain reaction responsible for ozone decomposition.34 For a complete ozone depletion in Lake Zurich water, the overall ∫[˙OH]dt was unchanged across a temperature range of 5–35 °C, as demonstrated in a previous study.21 These results further demonstrate a finite number of types of reactive sites in DOM (i.e., initiators, promotors, and inhibitors) leading to an increase in Rct (∫[˙OH]dt/∫[O3]dt) as ∫[˙OH]dt is unchanged and ∫[O3]dt decreases with increased temperature.
The chloramine residual concentration following each of the three Cl2–NH4+–N dosing scenarios was 0.45–0.56 mg L−1 (as total chlorine) in the ozone influent (Table S2†). As a result, the three Cl2–NH4+–N dosing scenarios are combined in all figures for improved clarity and differentiated in the ESI.† ODdiss was not impacted by Cl2–NH4+–N pretreatment at all temperature conditions of 15, 20, 26, and 30 °C. Chloramine (kO3 = 26 M−1 s−1) and bromamine (kO3 = 40 M−1 s−1), and ammonium (kO3 = no reaction) react slowly with ozone (Group IIB) and are not expected to result in additional initial phase ozone demand.45–48 However, chloramine is a weak ˙OH scavenger (k˙OH = 5.2–5.7 × 10⁸ M−1 s−1)49,50 and can partially disrupt the chain reaction of ozone decomposition by minimizing the available ˙OH. Since chloramine is only a weak ˙OH scavenger, reactive sites within the NOM likely outcompete NH2Cl for ˙OH which minimizes the effect of chloramine during the initial phase (ODdiss). In wastewater, minimal effect on ODdiss was also observed when using preformed chloramine, while ODdiss increased as a function of ozone dose.51 If longer chlorine contact times (>10 min) are applied before of NH4+ addition, a further decrease in ODdiss may be expected due to chlorine oxidation of DOM components (groups I and II) that contribute to ozone decomposition.17,18
Effects on ozone decay rate (second phase)
Ozone decay rates (k*) decreased proportionally with transferred ozone doses across all temperature conditions (Fig. 3 and S7 and S8†). At 15 °C, the first-order ozone decay rate constants decreased from 0.19 min−1 to 0.07 min−1 (63%) as the transferred ozone dose was increased from 1 mg L−1 to 3 mg L−1. The higher first-order ozone decay rate constant (0.19 min−1) at the lower ozone dose (1 mg L−1) indicates the continued oxidation of DOM by ozone reactions (e.g., group I, IIA and IIB components) that was not completed during the initial phase (ODdiss = 0.35 mg L−1). For higher ozone dosages (e.g., 3 mg L−1), the first-order ozone decay rate constants were lower (0.07 min−1) which relates to a greater DOM (groups I and IIA) oxidation by ozone achieved during the initial phase (ODdiss = 1.0 mg L−1) and continued depletion of slower reacting NOM (group IIB) in the second phase. An inverse relationship is observed when comparing ODdiss (Fig. 2) and k* (Fig. 3) versus the transferred ozone dose. These patterns in ozone decay rate constants are consistent with previous bench-scale studies.20,21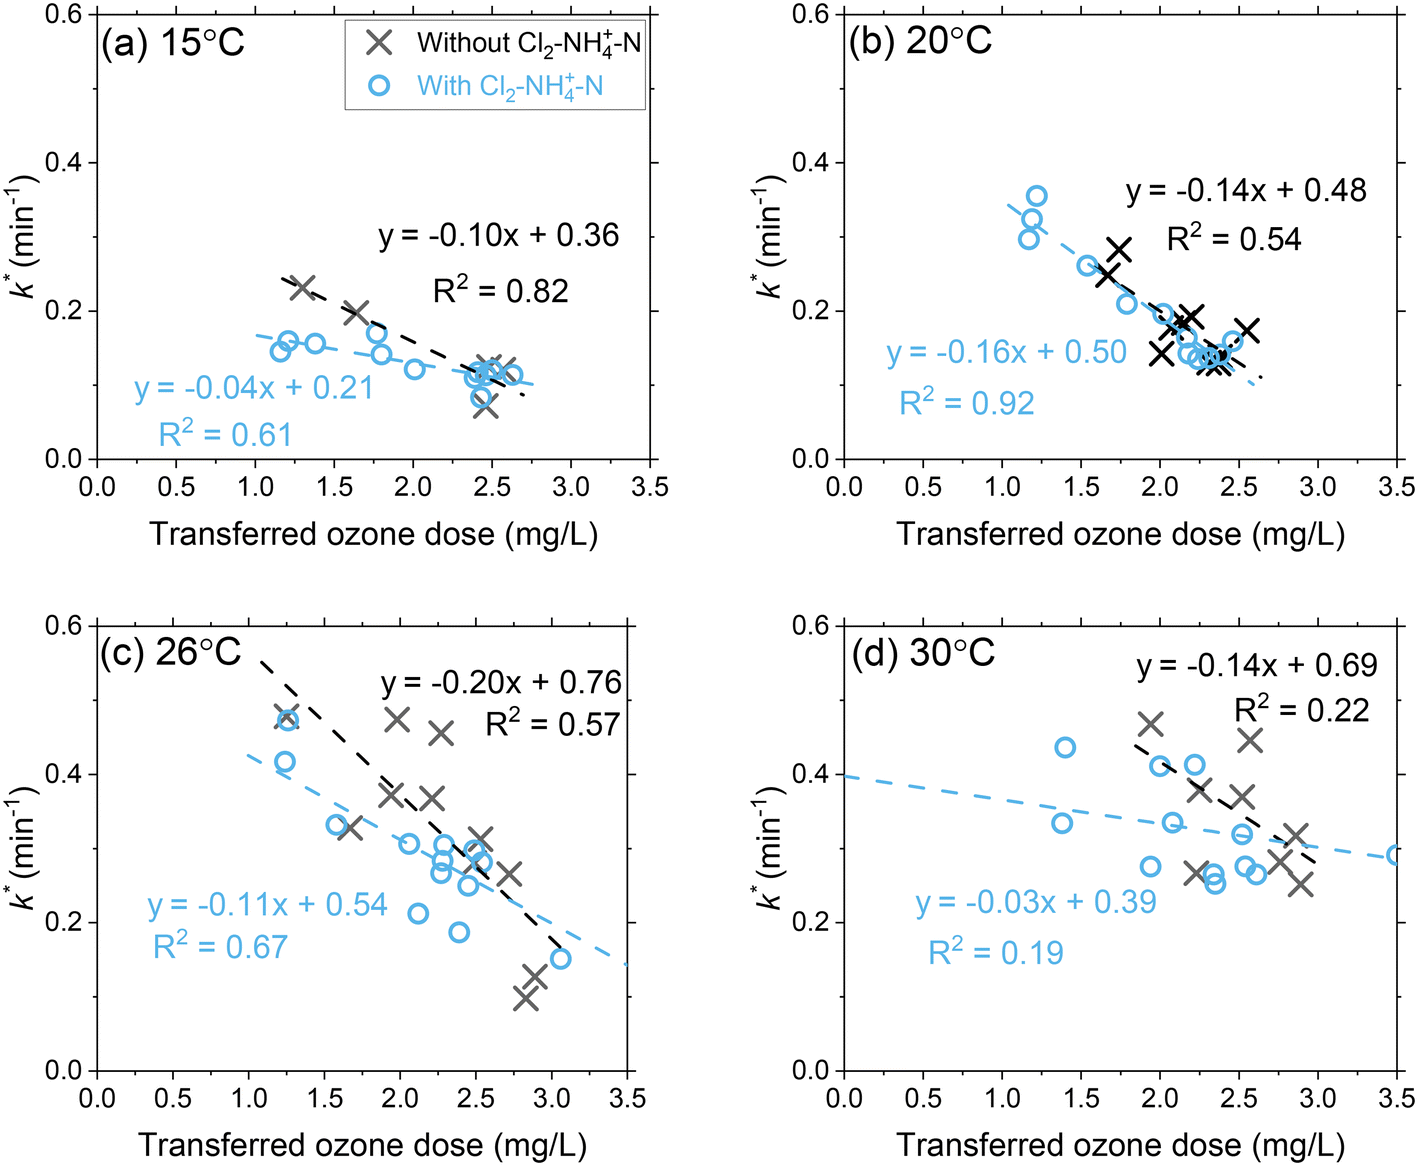 | ||
| Fig. 3 Pilot-scale data depicting the correlations between the first-order ozone decay rate constants as a function of the transferred ozone dose at (a) 15 °C, (b) 20 °C, (c) 26 °C, and (d) 30 °C. Pilot-scale results illustrating the different Cl2–NH4+–N dosing scenarios are presented in Fig. S6.† Another representation of the data in terms of the effect of transferred ozone doses on ozone half-life for all tested temperatures is shown in Fig. S7.† | ||
A temperature increase from 15 °C to 30 °C accelerated ozone depletion which is demonstrated by higher first-order rate constants (k*). At a dose of 1 mg L−1, k* increased from 0.19 min−1 at 15 °C to 0.31 min−1 at 30 °C. The increase in k* indicates that the reactivities of the group IIA and IIB DOM components were enhanced by the temperature increase leading to a faster ozone depletion in the second phase. The role of temperature on ozone depletion kinetics has been examined for decades in model and natural waters.20,21,52,53 The Arrhenius plot (eqn (8)) allows for the determination of the activation energies (Ea) for these processes.12,21
 | (8) |
When applying Cl2–NH4+–N pretreatment, the k* for a transferred ozone dose of 1.5 mg L−1 decreased from 0.21 to 0.15 at 15 °C and from 0.48 to 0.35 at 30 °C. The chloramine residual concentration following the three Cl2–NH4+–N dosing scenarios was 0.45–0.56 mg L−1 as total chlorine in the ozone influent and 0.07–0.24 mg L−1 in the ozone contactor effluent (Table S2†). The decrease in chloramine residual across the ozone process can be attributed to decomposition from the water matrix (i.e. temperature, TOC) in addition to the reaction with ozone, which was described earlier (group IIB). If fully attributed to the reaction with ozone, the measured chlorine decrease (0.2–0.3 mg L−1) can result in up to 0.22 mg L−1 of ozone consumption. In addition to the direct reaction with ozone, scavenging of ˙OH by chloramine also inhibits the chain reaction of ozone decomposition resulting in a corresponding decrease in k*.
Effect of temperature changes on ozone CT and Cryptosporidium LRV targets
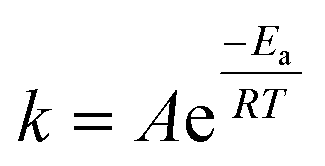
Ozone CT (∫[O3]dt) increased proportionally as a function of the transferred ozone dose at all temperature conditions (Fig. 4 and S10†).17 For similar transferred ozone dose conditions, the ozone CT decreased with increasing temperature (Fig. 4 and S10†). For instance, at a transferred ozone dose of 3.0 mg L−1, the CT achieved at 15 °C was almost >4 times greater (12.4 mg min L−1) than at 30 °C (3.0 mg min L−1). This decrease in CT is primarily driven by the higher rate of ozone depletion at higher temperatures, as discussed in the previous section. Although ozone decomposes more rapidly at higher temperatures, the inactivation kinetics increase.10,12 Regulatory compliance in drinking water applications requires public water systems to achieve specified LRVs for viruses, Giardia, and Cryptosporidium, specifically by demonstrating required disinfectant CTs in the case of ozonation. The change in disinfection efficiency with temperature is reflected in the CT equations published by the USEPA (eqn (1)–(3)).10 For example, eqn 1 indicates that the required ozone CT for a Cryptosporidium LRV of 1log decreases from 6.23 mg min L−1 to 1.54 mg min L−1 as the temperature of the water increases from 15 °C to 30 °C. While CT requirements to meet LRV goals decrease with temperature, this pilot study showed that the required transferred ozone dose to achieve the same level of pathogen inactivation does not substantially change. Regardless of differences in required ozone CT for Cryptosporidium LRV, over the 15 °C to 30 °C range, consistent transferred ozone doses of 1.6–1.8 mg L−1 and 2.4–2.8 mg L−1 were required to meet LRV goals of 0.5 and 1.5logs, respectively (Fig. 4 and S10†). Based on this observation it can be concluded that the lower ozone stability at higher temperature is compensated by the higher inactivation efficiency. This should be considered as site specific and re-examined carefully in other water sources with different water quality characteristics (i.e., pH, alkalinity, organic matter composition).
 | ||
| Fig. 4 Pilot-scale data depicting correlations between ozone CT (and corresponding Cryptosporidium LRV credit on the right y-axis) and the transferred ozone dose at (a) 15 °C, (b) 20 °C, (c) 26 °C, and (d) 30 °C. Fitting equations are associated with the left y-axis (ozone CT). Pilot-scale results illustrating the different Cl2–NH4+–N dosing scenarios and demonstrating ODCT calculations are presented in Fig. S9.† | ||
In Fig. 4, the linear regression lines intercept at the x-axis represent another potential method to determine ozone demand based on CT calculations (ODCT). Based on this interpretation, a single value is calculated for ODCT representing the transferred ozone dose that must be exceeded to create measurable ozone CT. The single value of ODCT contrasts with ODdiss, which varies based on the transferred ozone dose and Cin. In this study, ODCT was determined to be 1.03 mg L−1 at 15 °C or 1.49 mg L−1 at 30 °C. When comparing ODCT to ODdiss in Fig. 2, ODdiss appears to reach a maximum value around the ODCT. Additional research is needed to determine whether ODCT could be considered a maximum value for ODdiss. However, the ODCT approach should be viewed with caution as second phase NOM components (groups IIA and IIB) are being used to predict initial phase ODdiss, which is largely based on group I NOM components.
Across all temperature conditions, Cl2–NH4+–N pretreatment provided a slight increase in ozone CT at lower ozone dose conditions as expected from k* results (Fig. 3). For greater ozone dosages (2.5–3.0 mg L−1), there was little difference in the ozone CT achieved with or without Cl2–NH4+–N pretreatment. The linear regression line intercept at the x-axis for Cl2–NH4+–N pretreatment shows an approximate 35–45% decrease in the ODCT compared to the absence of Cl2–NH4+–N. Since Cl2–NH4+–N pretreatment had minimal impact on ODdiss (Fig. 2), these results show that ODCT is not a good indicator of the maximum ODdiss in the presence of NH2Cl.
Effect of temperature changes on bromate formation
For an influent bromide concentration of 80 μg L−1, bromate formation increased with increasing transferred ozone doses for the selected temperature range with concentrations ranging from 4–28 μg L−1 without Cl2–NH4+–N pretreatment. This exceeded the bromate MCL of 10 μg L−1 in most cases (Fig. 5). As the transferred ozone dose increases, ∫[˙OH]dt is not expected to change with temperature while ∫[O3]dt decreases with temperature, which results in decreasing RCT (∫[˙OH]dt/∫[O3]dt). As temperature increases, ∫[˙OH]dt plays a greater role in bromate production due to the reduced ozone exposure. While higher temperatures are considered to enhance reaction kinetics, bromate declined as the temperature increased for an equivalent transferred ozone dose, likely due to a lower ∫[O3]dt.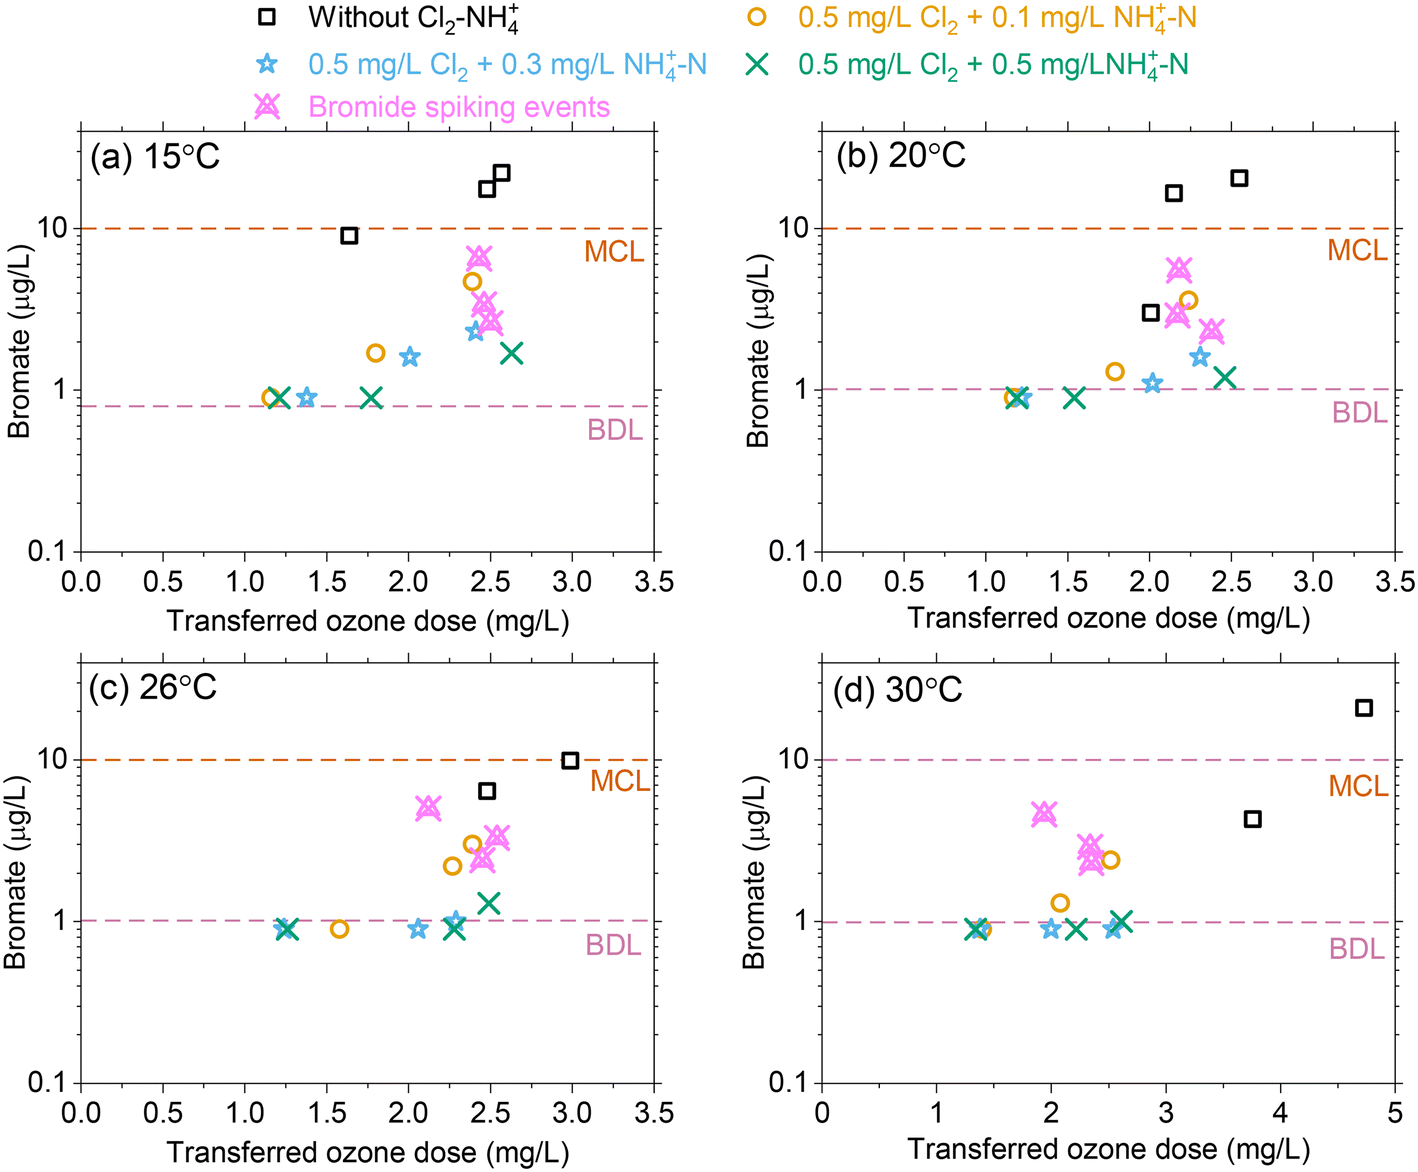 | ||
| Fig. 5 Effect of transferred ozone dose on effluent bromate concentrations under different Cl2–NH4+–N dosing scenarios at (a) 15 °C, (b) 20 °C, (c) 26 °C, and (d) 30 °C. The symbols in magenta represent results from challenge tests conducted with additional 40 μg L−1 bromide spiked into raw water, to increase the influent bromide from 80 μg L−1 to 120 μg L−1 (confirmed with laboratory analysis). MCL = maximum contaminant limit= 10 μg L−1. BDL = below detection limit = of 1 μg L−1. | ||
Chloramine acts as a ˙OH scavenger and thereby reduces the oxidation of bromide and HOBr/OBr leading to bromate formation.16,18 In addition, it has been demonstrated that bromine radicals which are formed from the reaction of ˙OH with bromide can also be quenched by chloramine.19 Bromate results demonstrated the efficacy of Cl2–NH4+–N (i.e., NH2Cl) pretreatment as a bromate control strategy by maintaining concentrations below 10 μg L−1 for all ozone dose and temperature conditions. Increasing the NH4+–N from 0.1 to 0.5 mg L−1 results in some excess NH4+–N (i.e., lower Cl2:N mass ratio) which partially quenches HOBr to form bromamine and further minimizes bromate production.16 However, the results showed that the excess NH4+–N (mass basis) provided only a marginal improvement (∼1–2 μg L−1) for bromate control (Fig. 5). At higher temperatures, Cl2–NH4+–N (i.e. NH2Cl) pretreatment provided more effective bromate control by scavenging ˙OH and the formed Br as RCT is expected to increase with temperature. During experiments in which bromide concentrations were increased from 80 μg L−1 (ambient) to 120 μg L−1 (spiked), Cl2–NH4+–N (i.e., NH2Cl) pretreatment again provided effective bromate control with concentrations below the MCL, magenta symbols in Fig. 5.
Practical application of the pilot-scale results for full-scale design
SNWA operates two drinking water treatment facilities with a combined production capacity of 900 million gallons per day (mgd, 3.3 × 10⁶ m3 day−1) to serve the Las Vegas metropolitan area with a population over 2.5 million.56 Both facilities receive raw water from the Colorado River via Lake Mead, which has been experiencing severe drought conditions and declining lake surface level for over 20 years (from a full elevation of 1221 ft/371.9 m to current levels near 1070 ft/326 m, resulting in >60% lake volume decline).7,8 If lake surface levels continue to decline, water quality models have shown the raw water temperature may change from the current annual range of 12–16 °C to as low as 10 °C in the winter and as high as 30 °C in the summer.2,7,8 While other water quality parameters (i.e. TOC, pH) are also expected to change during drought conditions, temperature was considered to have the most significant impact on ozone process performance. This has necessitated a review of treatment plant performance to ensure that treatment goals can be achieved under these projected temperature conditions.Both treatment facilities operate as direct filtration plants (i.e., coagulation + flocculation + granular media filtration) with pre-ozonation targeting a non-regulatory, internal goal of Cryptosporidium LRV of 0.5log. Currently, both plants are classified as Bin 1 for Cryptosporidium (<0.075 oocysts per L) under the LT2ESWTR, which requires no additional treatment beyond the credits received for direct filtration, assuming turbidity targets are achieved.11 However, if drought conditions increase Cryptosporidium concentrations in the raw surface water (e.g., ≥0.075 and <1.0 oocysts per L), the treatment facilities may be reclassified to Bin 2, which requires Cryptosporidium LRV of 1.5logs beyond the baseline direct filtration credit. The impacts of potential reclassification and temperature were considered as SNWA proceeds with oxygen–ozone system refurbishment after 20 years of service.
As part of the design review, the existing oxygen–ozone systems were evaluated for their ability to achieve a Cryptosporidium LRV of 0.5–1.5logs under the projected temperature conditions. Historical full-scale data (13–15 °C) were supplemented with previous pilot-scale data sets with limited information at temperatures greater than 15 °C and used to develop the initial full-scale design criteria shown in Fig. 6. Given the cost and scale of the ozone system refurbishment, additional pilot-scale data were requested to better inform the full-scale design over the projected temperature range associated with drought conditions (i.e., up to 26 °C), hence the basis for the current study.
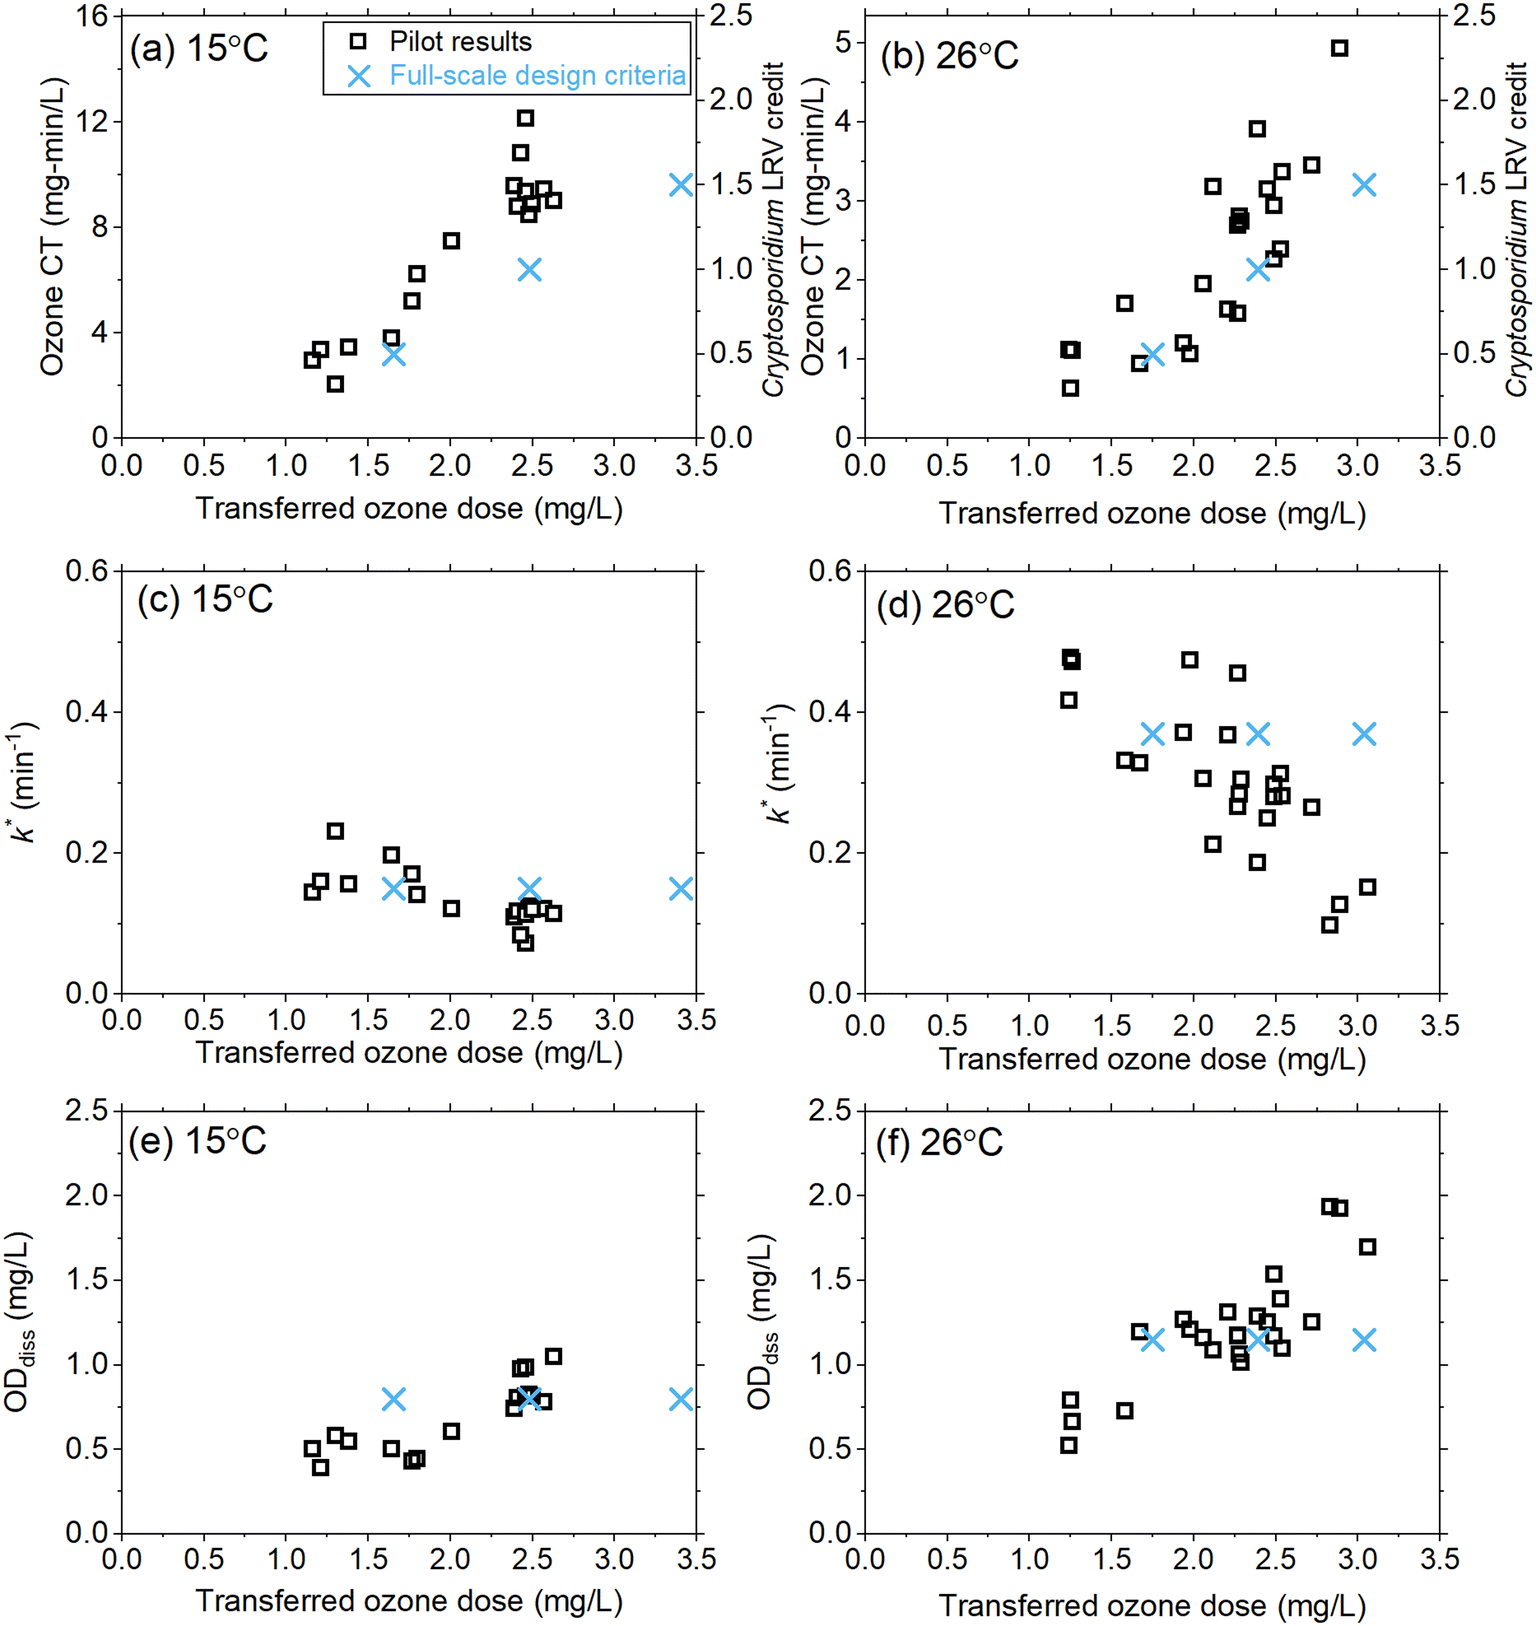 | ||
| Fig. 6 Comparing pilot-scale results of this study to the initial full-scale design criteria at low (15 °C, left panels) and high (26 °C, right panels) design temperatures in terms of the effect of transferred ozone doses on (a and b) ozone CT (left y-axis) and LRV targets (right y-axis), (c and d) k*, and (e and f) ODdiss. | ||
Full-scale ozone capacity is designed based on the transferred ozone dose required to achieve temperature-dependent CT values according to the LT2ESWTR (Fig. S11†). For example, an LRV of 1.5logs requires a CT of 9.35 mg min L−1 at 15 °C and 2.31 mg min L−1 at 30 °C. By defining the target CT required, pilot-scale data can be utilized to calculate the required transferred ozone dose and verify k*, and ODdiss (Fig. 6). The results from this pilot-scale study confirmed that the design criteria were conservative with respect to the transferred ozone dose required (Fig. 6a and b). Results for k* (Fig. 6c and d) and ODdiss (Fig. 6e and f) showed these parameters are not constant as originally defined, based on the limited historical data; however, the differences were not significant enough to change the design ozone production capacity of 13800 lb O3 per day (∼6260 kg day−1) for the refurbished full-scale system. The pilot results from this work provided the consultant and utility with greater confidence in the design assumptions.
Conclusions
This study systematically evaluated the effects of temperature and dosing on ozone decomposition, ability to achieve CT/LRV targets for compliance with the USEPA's LT2ESWTR, and bromate formation and control under projected drought conditions. Pilot-scale testing was accomplished by manipulating temperature, while maintaining a fixed water quality (i.e., pH, TOC concentration, DOM, alkalinity, bromide). The main conclusions from this study include:• As temperature increased from 15 °C to 30 °C, ozone demand in the dissolution zone (ODdiss) increased from 0.3 to 0.7 mg L−1 (at 1.0 mg L−1 transferred ozone dose) and from 1.0 to 1.6 mg L−1 (at 3.0 mg L−1 transferred ozone dose), respectively.
• As temperature increased from 15 °C to 30 °C, the pseudo first-order ozone decay rate constant k* increased (e.g., from 0.19 min−1 to 0.31 min−1 for a transferred ozone dose of 1.0 mg L−1). The activation energies (Ea) derived from pseudo first-order rate constants for ozone decomposition across the different temperature conditions varied between 44–78 kJ mol−1, which aligned with other natural waters.
• Temperature-driven changes in ODdiss and k* can be explained by an enhanced ozone reaction with DOM sites spanning about 10 orders of magnitude (kO3 < 0.1 to 109 M−1 s−1). Fast reacting NOM moieties (group I; kO3 > 105 M−1 s−1) achieve near-complete oxidation (>90%) within the dissolution zone (ODdiss). DOM moieties with lower ozone reactivities (groups IIA/IIB; 10 < kO3 < 105 M−1 s−1) contribute to the second phase of ozone consumption (k*).
• For the waters tested in this study and across the range of water temperatures tested (15–30 °C), decreasing CT requirements (i.e., more rapid disinfection kinetics) offset the increases in ODdiss and k*, resulting in similar ozone dosing requirements to meet Cryptosporidium LRV goals according to the USEPA LT2ESWTR.
• At all temperature conditions (15–30 °C), bromate formation exceeded the MCL of 10 μg L−1 for target Cryptosporidium LRVs > 0.5log. Chlorine–ammonium (0.5 mg L−1 as Cl2 and 0.1–0.5 mg L−1 as NH4+–N, with Cl2:N molar ratios of 1:1 to 1:5) application upstream of ozone effectively minimized bromate to below the MCL at all evaluated ozone doses (1–3 mg L−1).
• While this study focused on temperature variability within a consistent water matrix, drought conditions can change other water quality parameters (i.e. pH, alkalinity, bromide concentration, TOC concentration) as well that can influence ozone demand, decay rate, and CT performance along with bromate formation and mitigation. Furthermore, the potential for greater wastewater influence can also change DOM composition and ozone reaction kinetics depending on the mixture of functional groups (groups I–V). Finally, there is a need for future studies to develop a comprehensive and systematic comparison between findings from bench-, pilot-, and full-scale studies and summarize the key differences and gaps between each system.
Conflicts of interest
There are no conflicts to declare.Acknowledgements
We acknowledge Emily Christensen for assisting with pilot work. We also thank SNWA laboratory staff (Janie Holady, Steve George, Lena Wright, and Matthew Desautel) for sample preparations and select laboratory analysis. We thank Dr. Urs von Gunten (Eawag) and Dr. Daniel Gerrity (SNWA) for their detailed review of the manuscript and providing insightful comments that enhanced the manuscript quality. We also acknowledge Benjamin Finnegan, Christine Ngan Love, and Christopher Schulz from CDM Smith for providing full-scale design information and providing feedback on the test plans and pilot study results.References
- J. B. Butcher, D. Nover, T. E. Johnson and C. M. Clark, Sensitivity of lake thermal and mixing dynamics to climate change, Clim. Change, 2015, 129(1), 295–305, DOI:10.1007/s10584-015-1326-1.
- D. Hannoun, T. Tietjen and K. Brooks, The Influence and Implications of Climate Change on Water Quality in a Large Water Reservoir in the Southwest, USA, Am. J. Clim. Change, 2022, 11(3), 197–229, DOI:10.4236/ajcc.2022.113010.
- K. Levy, A. P. Woster, R. S. Goldstein and E. J. Carlton, Untangling the Impacts of Climate Change on Waterborne Diseases: a Systematic Review of Relationships between Diarrheal Diseases and Temperature, Rainfall, Flooding, and Drought, Environ. Sci. Technol., 2016, 50(10), 4905–4922, DOI:10.1021/acs.est.5b06186.
- B. Wright, B. D. Stanford, A. Reinert, J. C. Routt, S. J. Khan and J. F. Debroux, Managing water quality impacts from drought on drinking water supplies, J. Water Supply: Res. Technol.--AQUA, 2013, 63(3), 179–188, DOI:10.2166/aqua.2013.123.
- C. M. Morrison, S. Hogard, R. Pearce, D. Gerrity, U. von Gunten and E. C. Wert, Ozone disinfection of waterborne pathogens and their surrogates: A critical review, Water Res., 2022, 214, 118206, DOI:10.1016/j.watres.2022.118206.
- C. von Sonntag and U. von Gunten, Chemistry of Ozone in Water and Wastewater Treatment, IWA publishing, 2012, DOI:10.1002/j.1551-8833.1993.tb05922.x.
- D. Hannoun, J. Belding, T. Tietjen and R. Devaney, Assessing treatability with simulated lake drawdown: Quantifying drought-driven turbidity in source water, AWWA Water Sci., 2022, 4(4) DOI:10.1002/AWS2.1295.
- D. Hannoun and T. Tietjen, A three-part coupled statistical and physical model to monitor water quality parameters governing disinfection byproduct risk at an urban drinking water intake, Front. Water, 2022, 4, DOI:10.3389/frwa.2022.983257.
- USEPA. Guidance Manual for Compliance With the Filtration and Disinfection Requirements for Public Water Systems Using Surface Water Sources, 1991, EPA-HQ-OW-2002-0061-0150 Search PubMed.
- USEPA. National Primary Drinking Water Regulations: Long Term 2 Enhanced Surface Water Treatment Rule, Final Rule, 2006, 71 FR 654 Search PubMed.
- USEPA. Long Term 2 Enhanced Surface Water Treatment Rule Toolbox Guidance Manual. Published online 2010: EPA 815-R-09-016.
- H. Li, L. L. Gyürék, G. R. Finch, D. W. Smith and M. Belosevic, Effect of Temperature on Ozone Inactivation of Cryptosporidium parvum in Oxidant Demand-Free Phosphate Buffer, J. Environ. Eng., 2001, 127(5), 456–467, DOI:10.1061/(ASCE)0733-9372(2001)127:5(456).
- M. S. Siddiqui and G. L. Amy, Factors affecting DBP formation during ozone–bromide reactions, J. – Am. Water Works Assoc., 1993, 85(1), 63–72, DOI:10.1002/j.1551-8833.1993.tb05922.x.
- USEPA. National Primary Drinking Water Regulations: Stage 2 Disinfectants and Disinfection Byproducts Rule; Final Rule, 2006, 40 CFR Parts 9, 141, and 142 Search PubMed.
- U. von Gunten, Ozonation of drinking water: Part II. Disinfection and by-product formation in presence of bromide, iodide or chlorine, Water Res., 2003, 37(2003), 1469–1487, DOI:10.1016/S0043-1354(02)00458-X.
- C. M. Morrison, S. Hogard and R. Pearce, et al., Critical Review on Bromate Formation during Ozonation and Control Options for Its Minimization, Environ. Sci. Technol., 2023, 57(47), 18393–18409, DOI:10.1021/acs.est.3c00538.
- E. C. Wert, J. J. Neemann, D. Johnson, D. Rexing and R. Zegers, Pilot-Scale and Full-Scale Evaluation of the Chlorine-Ammonia Process for Bromate Control During Ozonation, Ozone: Sci. Eng., 2007, 29(5), 363–372, DOI:10.1080/01919510701552883.
- M. O. Buffle, S. Galli and U. von Gunten, Enhanced Bromate Control during Ozonation: The Chlorine-Ammonia Process, Environ. Sci. Technol., 2004, 38(19), 5187–5195, DOI:10.1021/es0352146.
- S. Lim, B. Barrios, D. Minakata and U. von Gunten, Reactivity of Bromine Radical with Dissolved Organic Matter Moieties and Monochloramine: Effect on Bromate Formation during Ozonation, Environ. Sci. Technol., 2023, 57(47), 18658–18667, DOI:10.1021/acs.est.2c07694.
- J. Shin, Z. R. Hidayat and Y. Lee, Influence of Seasonal Variation of Water Temperature and Dissolved Organic Matter on Ozone and OH Radical Reaction Kinetics During Ozonation of a Lake Water, Ozone: Sci. Eng., 2016, 38(2), 100–114, DOI:10.1080/01919512.2015.1079120.
- M. S. Elovitz, U. von Gunten and H. P. Kaiser, Hydroxyl Radical/Ozone Ratios During Ozonation Processes. II. The Effect of Temperature, pH, Alkalinity, and DOM Properties, Ozone: Sci. Eng., 2000, 22(2), 123–150, DOI:10.1080/01919510008547216.
- M. O. Buffle, J. Schumacher, E. Salhi, M. Jekel and U. von Gunten, Measurement of the initial phase of ozone decomposition in water and wastewater by means of a continuous quench-flow system: application to disinfection and pharmaceutical oxidation, Water Res., 2006, 40(9), 1884–1894, DOI:10.1016/j.watres.2006.02.026.
- E. L. Yong and Y. P. Lin, Incorporation of initiation, promotion and inhibition in the Rct concept and its application in determining the initiation and inhibition capacities of natural water in ozonation, Water Res., 2012, 46(6), 1990–1998, DOI:10.1016/j.watres.2012.01.025.
- E. C. Wert, J. Lew and K. L. Rakness, Effect of ozone dissolution systems on ozone exposure and bromate formation, J. – Am. Water Works Assoc., 2017, 109(7), E302–E312, DOI:10.5942/jawwa.2017.109.0048.
- T. Wohlsen, S. Stewart, P. Aldridge, J. Bates, B. Gray and M. Katouli, The efficiency of ozonated water from a water treatment plant to inactivate Cryptosporidium oocysts during two seasonal temperatures, J. Water Health, 2007, 5(3), 433–440, DOI:10.2166/wh.2007.039.
- T. Mizuno and H. Tsuno, Evaluation of Solubility and the Gas-Liquid Equilibrium Coefficient of High Concentration Gaseous Ozone to Water, Ozone: Sci. Eng., 2010, 32(1), 3–15, DOI:10.1080/01919510903482376.
- K. L. Rakness, I. Najm, M. Elovitz, D. Rexing and S. Via, Cryptosporidium log-inactivation with ozone using effluent CT10, geometric mean CT10, extended integrated CT10 and extended CSTR calculations, Ozone: Sci. Eng., 2005, 27(5), 335–350, DOI:10.1080/01919510500250267.
- Water Quality and Treatment: A Handbook on Drinking Water, Sixth Edition., ed. J. K. Edzwald, 2011 Search PubMed.
- APHA, AWWA and WEF, Standard Methods for the Examination of Water and Wastewater, American Public Health Association, American Water Works Association, Water Environment Federation, 20th edn, 1998 Search PubMed.
- J. D. Pfaff, Method 300.0 Determination of inorganic anions by ion chromatography, US Environmental protection agency, 1993, p. 28.
- H. P. Wagner, B. V. Pepich, D. P. Hautman, D. J. Munch, E. Salhi and U. von Gunten, Method 326.0 Determination of Inorganic Oxyhalide Disinfection By-Products in Drinking Water Using Ion Chromatography Incorporating the Addition of a Suppressor Acidified Postcolumn Reagent for Trace Bromate Analysis, Revision 1.0. Published online 2002: 815-R-03-007.
- B. B. Potter and J. C. Wimsatt, Method 415.3. Measurement of total organic carbon, dissolved organic carbon and specific UV absorbance at 254 nm in source water and drinking water. US Environmental protection agency, Washington, DC. Published online 2005.
- K. L. Rakness, E. C. Wert, M. Elovitz and S. Mahoney, Operator-friendly technique and quality control considerations for indigo colorimetric measurement of ozone residual, Ozone: Sci. Eng., 2010, 32(1), 33–42, DOI:10.1080/01919510903467864.
- U. von Gunten, Ozonation of drinking water: Part I. Oxidation kinetics and product formation, Water Res., 2003, 37(7), 1443–1467, DOI:10.1016/S0043-1354(02)00457-8.
- S. Lim, J. L. Shi, U. von Gunten and D. L. McCurry, Ozonation of organic compounds in water and wastewater: A critical review, Water Res., 2022, 213, DOI:10.1016/j.watres.2022.118053.
- M. O. Buffle and U. von Gunten, Phenols and amine induced HO. generation during the initial phase of natural water ozonation, Environ. Sci. Technol., 2006, 40(9), 3057–3063, DOI:10.1021/es052020c.
- M. O. Buffle, J. Schumacher, S. Meylan, M. Jekel and U. von Gunten, Ozonation and advanced oxidation of wastewater: Effect of O3 dose, pH, DOM and HO.-scavengers on ozone decomposition and HO. generation, Ozone: Sci. Eng., 2006, 28(4), 247–259, DOI:10.1080/01919510600718825.
- J. Hoigné and H. Bader, Rate constants of reactions of ozone with organic and inorganic compounds in water—II: dissociating organic compounds, Water Res., 1983, 17(2), 185–194, DOI:10.1016/0043-1354(83)90099-4.
- J. Hoigné and H. Bader, Rate constants of reactions of ozone with organic and inorganic compounds in water—I: non-dissociating organic compounds, Water Res., 1983, 17(2), 173–183, DOI:10.1016/0043-1354(83)90098-2.
- M. Edwards and M. M. Benjamin, Transformation of NOM by ozone and its effect on iron and aluminum solubility, J. – Am. Water Works Assoc., 1992, 84(6), 56–66, DOI:10.1002/j.1551-8833.1992.tb07376.x.
- P. Westerhoff, G. Aiken, G. Amy and J. Debroux, Relationships between the structure of natural organic matter and its reactivity towards molecular ozone and hydroxyl radicals, Water Res., 1999, 33(10), 2265–2276, DOI:10.1016/S0043-1354(98)00447-3.
- D. Gerrity, S. Gamage and D. Jones, et al., Development of surrogate correlation models to predict trace organic contaminant oxidation and microbial inactivation during ozonation, Water Res., 2012, 46(19), 6257–6272, DOI:10.1016/j.watres.2012.08.037.
- Y. Lee, D. Gerrity and M. Lee, et al., Prediction of micropollutant elimination during ozonation of municipal wastewater effluents: Use of kinetic and water specific information, Environ. Sci. Technol., 2013, 47(11), 5872–5881, DOI:10.1021/es400781r.
- U. Pinkernell and U. von Gunten, Bromate Minimization during Ozonation: Mechanistic Considerations, Environ. Sci. Technol., 2001, 35(12), 2525–2531, DOI:10.1021/es001502f.
- W. R. Haag and J. Hoigné, Kinetics and Products of the Reactions of Ozone with Various Forms of Chlorine and Bromine in Water, Ozone: Sci. Eng., 1984, 6(2), 103–114, DOI:10.1080/01919518408551009.
- W. R. Haag and J. Hoigné, Ozonation of bromide-containing waters: kinetics of formation of hypobromous acid and bromate, Environ. Sci. Technol., 1983, 17(5), 261–267, DOI:10.1021/es00111a004.
- J. Hoigne and H. Bader, Ozonation of water: kinetics of oxidation of ammonia by ozone and hydroxyl radicals, Environ. Sci. Technol., 1978, 12(1), 79–84, DOI:10.1021/es60137a005.
- W. R. Haag and J. Hoigné, Ozonation of water containing chlorine or chloramines. Reaction products and kinetics, Water Res., 1983, 17(10), 1397–1402, DOI:10.1016/0043-1354(83)90270-1.
- J. M. Gleason, G. McKay, K. P. Ishida and S. P. Mezyk, Temperature dependence of hydroxyl radical reactions with chloramine species in aqueous solution, Chemosphere, 2017, 187, 123–129, DOI:10.1016/j.chemosphere.2017.08.053.
- G. A. Poskrebyshev, R. E. Huie and P. Neta, Radiolytic Reactions of Monochloramine in Aqueous Solutions, J. Phys. Chem. A, 2003, 107(38), 7423–7428, DOI:10.1021/jp030198k.
- R. Pearce, S. Hogard, P. Buehlmann, G. Salazar-Benites, C. Wilson and C. Bott, Evaluation of preformed monochloramine for bromate control in ozonation for potable reuse, Water Res., 2022, 211, 118049, DOI:10.1016/j.watres.2022.118049.
- C. G. Hewes and R. R. Davison, Kinetics of ozone decomposition and reaction with organics in water, AIChE J., 1971, 17(1), 141–147, DOI:10.1002/aic.690170129.
- J. L. Sotelo, F. J. Beltran, F. J. Benitez and J. Beltran-Heredia, Ozone decomposition in water: kinetic study, Ind. Eng. Chem. Res., 1987, 26(1), 39–43, DOI:10.1021/ie00061a008.
- P. L. Houston, Chemical Kinetics and Reaction Dynamics, Courier Corporation, 2012 Search PubMed.
- M. S. Elovitz and U. von Gunten, Hydroxyl Radical/Ozone Ratios During Ozonation Processes. I. The Rct Concept, Ozone: Sci. Eng., 1999, 21(3), 239–260, DOI:10.1080/01919519908547239.
- D. Hannoun and T. Tietjen, Lake management under severe drought: Lake Mead, Nevada/Arizona, J. Am. Water Resour. Assoc., 2023, 59(2), 416–428, DOI:10.1111/1752-1688.13090.
Footnote |
| † Electronic supplementary information (ESI) available. See DOI: https://doi.org/10.1039/d4ew00042k |
| This journal is © The Royal Society of Chemistry 2024 |