
From nematic shells to nematic droplets: energetics and defect transitions
Kunyun
He
a,
Ye
Zhou
b,
Hadi
Ramezani-Dakhel
b,
Juan J.
de Pablo
 *c,
Alberto
Fernandez-Nieves
de and
Teresa
Lopez-Leon
*a
*c,
Alberto
Fernandez-Nieves
de and
Teresa
Lopez-Leon
*a
aLaboratoire Gulliver, UMR 7083 CNRS, ESPCI Paris, PSL Research University, 75005 Paris, France. E-mail: teresa.lopez-leon@espci.fr
bInstitute for Molecular Engineering, University of Chicago, Chicago, Illinois 60637, USA
cPritzker School of Molecular Engineering, University of Chicago, Chicago, Illinois 60637, USA
dDepartment of Condensed Matter Physics, University of Barcelona, 08028 Barcelona, Spain
eICREA-Institucio Catalana de Recerca i Estudis Avancats, 08010 Barcelona, Spain
First published on 18th January 2022
Abstract
In this work, we investigate the possibility of inducing valence transitions, i.e. transitions between different defect configurations, by transforming a nematic shell into a nematic droplet. Our shells are liquid crystal droplets containing a smaller aqueous droplet inside, which are suspended in an aqueous phase. When osmotically de-swelling the inner droplet, the shell progressively increases its thickness until it eventually becomes a single droplet. During the process, the shell energy landscape evolves, triggering a response in the system. We observe two different scenarios. Either the inner droplet progressively shrinks and disappears, inducing a defect reorganization, or it is expelled from the shell at a critical radius of the inner droplet, abruptly changing the geometry of the system. We use numerical simulations and modeling to investigate the origin of these behaviors. We find that the selected route depends on the defect structure and the energetics of the system as it evolves. The critical inner radius and time for expulsion depend on the osmotic pressure of the outer phase, suggesting that the flow through the shell plays a role in the process.
1 Introduction
Confining a nematic to a spherical geometry inevitably yields topological defects. For example, nematic liquid crystals constrained to lie parallel to the interface of a drop exhibit two surface defects, called boojums.†![[thin space (1/6-em)]](https://www.rsc.org/images/entities/char_2009.gif) 1–3 When a nematic is confined to a shell geometry, i.e. between two spherical surfaces, a larger number of defect structures arises from an interplay between topological constraints and energy minimization. The equilibrium defect structure depends on the shell thickness,4–11 molecular anchoring at the boundaries,12–16 elastic constants of the liquid crystal,17–21 external fields,22–24 curvature gradients,23,25–32etc. In particular, theory and simulations have established the energy landscape for nematic shells with planar molecular anchoring.4–11,17,18,20,21,29,33–37 For very thin concentric shells, the shell ground state has four disclination lines at the vertices of a tetrahedron, as shown in Fig. 1(b). These disclinations have a s = +1/2 topological charge, since they induce a π-rotation on the director field. The total charge in the system is +2, consistently with the topological requirements.38,39 For thick concentric shells, shown in Fig. 1(a), the lower energy state is a bipolar configuration with two pairs of s = +1 surface defects (or boojums), which induce a 2π-rotation of the director. In the pair, a boojum is placed on the outer shell surface and the other one is underneath, on the inner shell surface. This structure, shown in Fig. 1(c), is reminiscent of the bipolar structure observed in droplets. Theory and numerical simulations have revealed that the bipolar configuration becomes energetically favorable over the tetrahedral configuration when h/R becomes sufficiently large: h is the shell thickness and R is the outer shell radius, as shown in Fig. 1(a).4,7,11 The free energy densities associated with the two configurations are plotted in Fig. 1(g) as a function of h/R: the red (rhombus) dashed line corresponds to the tetrahedral configuration, while the blue (circles) dashed line corresponds to the bipolar one. The two curves interset at a critical value h*/R ≃ 0.5.4,11
1–3 When a nematic is confined to a shell geometry, i.e. between two spherical surfaces, a larger number of defect structures arises from an interplay between topological constraints and energy minimization. The equilibrium defect structure depends on the shell thickness,4–11 molecular anchoring at the boundaries,12–16 elastic constants of the liquid crystal,17–21 external fields,22–24 curvature gradients,23,25–32etc. In particular, theory and simulations have established the energy landscape for nematic shells with planar molecular anchoring.4–11,17,18,20,21,29,33–37 For very thin concentric shells, the shell ground state has four disclination lines at the vertices of a tetrahedron, as shown in Fig. 1(b). These disclinations have a s = +1/2 topological charge, since they induce a π-rotation on the director field. The total charge in the system is +2, consistently with the topological requirements.38,39 For thick concentric shells, shown in Fig. 1(a), the lower energy state is a bipolar configuration with two pairs of s = +1 surface defects (or boojums), which induce a 2π-rotation of the director. In the pair, a boojum is placed on the outer shell surface and the other one is underneath, on the inner shell surface. This structure, shown in Fig. 1(c), is reminiscent of the bipolar structure observed in droplets. Theory and numerical simulations have revealed that the bipolar configuration becomes energetically favorable over the tetrahedral configuration when h/R becomes sufficiently large: h is the shell thickness and R is the outer shell radius, as shown in Fig. 1(a).4,7,11 The free energy densities associated with the two configurations are plotted in Fig. 1(g) as a function of h/R: the red (rhombus) dashed line corresponds to the tetrahedral configuration, while the blue (circles) dashed line corresponds to the bipolar one. The two curves interset at a critical value h*/R ≃ 0.5.4,11
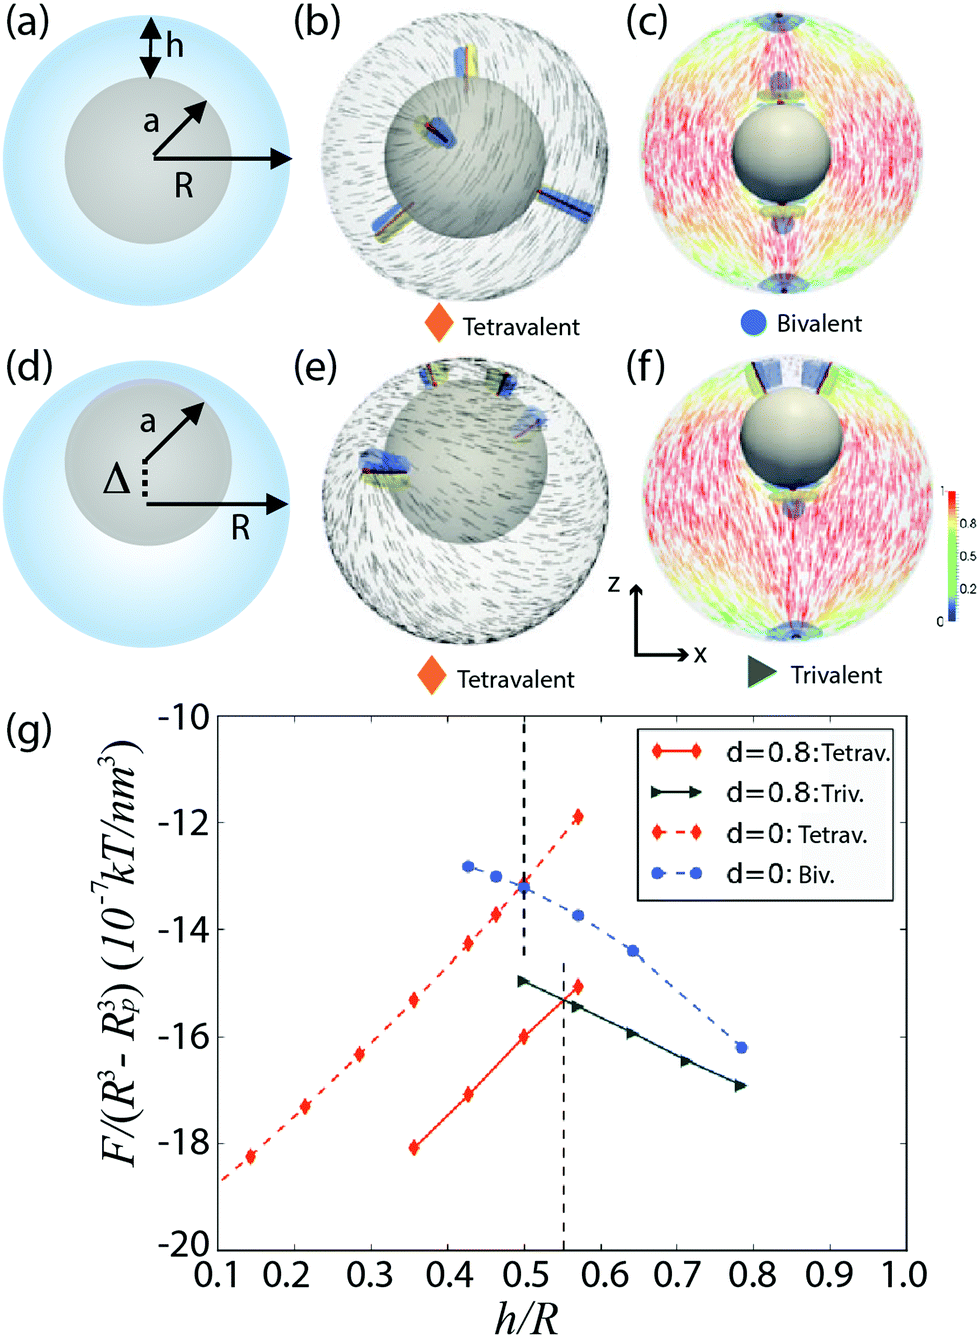 | ||
| Fig. 1 Configuration and free-energy densities of concentric and non-concentric nematic shells.11 (a and d) Schematic side view of a concentric and a heterogeneous shell, respectively. (b and e) Simulated tetravalent defect configuration with four defects of charge +1/2. (c) Simulated bivalent structure with two defects of charge +1. (f) Simulated trivalent configuration with one defect of charge +1 and two defects of charge +1/2. (g) Free-energy density graph as a function of the shell thickness (h/R) for the tetravalent, bivalent and trivalent defect structures. Director fields on the outer surface are shown in black. Director fields on the x − z plane are colored, the color indicates the projection onto the z-axis. The defects are shown in red (isosurface for S = 0.5 with Seq = 0.762). The splay and bend elastic distortions are shown in blue (SSB > 0.002) and in yellow (SSB < −0.002), respectively. | ||
Nematic shells have been prepared in experiments by using double emulsions,5 that is, nematic droplets containing an aqueous core inside. Due to the density difference between the inner droplet and the liquid crystal, experimental shells are often heterogeneous in thickness; see Fig. 1(d), where the center of the inner sphere is shifted by Δ with respect to the center of the outer one. Theory and simulations have shown that this non-concentric geometry has an impact in the energy landscape of the system.7–9,11,20 In thin heterogeneous shells, the four +1/2 defects shift their positions towards the thin part of the shell, loosing the tetrahedral arrangement, as shown in Fig. 1(e). A new structure becomes the ground state when the shell is thicker, and is therefore more heterogeneous in thickness. This new structure combines a pair of +1 boojums, located in the thick region of the shell, with two +1/2 disclination lines located at its thin part, as shown in Fig. 1(f). The free energy curves associated with these two configurations intersect at a h*/R value that is slightly larger than in the concentric case, as depicted by the solid curves in Fig. 1(g), where the red (rhombus) dashed line corresponds to the four-defect configuration and the blue (circles) dashed line to the other one. The free energies of heterogeneous shells are lower than those of the homogeneous counterparts, and thus, free elastic energy contributes, together with buoyancy, to make the shell heterogeneous in thickness.7,20
The defect structures predicted by simulations for homogeneous and heterogeneous shells shown in Fig. 1 have been observed in experimental shells.5,6,11 Interestingly, experimental shells can also exhibit other structures not observed in simulations.5,6 For instance, they often show defect arrangements where pairs of boojums and short disclination lines are all localised in the thin part of the shell. In this confined arrangement, defect structures with (i) four +1/2 disclination lines (referred to as tetravalent), (ii) two pairs of +1 boojums (referred to as bivalent), or (iii) a combination of two +1/2 disclinations and a pair of +1 boojums (referred to as trivalent) can coexist over a large range of h/R values (from 0.2 to 0.5). Once the nematic shell is produced, modifying h/R within the mentioned range impacts the defect separation distance (the defects move apart as h/R becomes smaller),6 but transitions involving a change in the number of defect, i.e. the shell valency, have never been reported. The existence of large energy barriers between configurations seems to be the key in stabilising these metastable structures.8,10
In this work, we explore the possibility of inducing valence transitions through drastic changes in the shell geometry (h/R). By increasing the osmotic pressure in the outer aqueous phase, we force the inner droplet to continuously de-swell. During this process, in which the nematic shell eventually becomes a nematic droplet, the system goes through states that are energetically unfavorable. This triggers transitions to new defect configurations. Two different pathways are observed depending on the initial state of the system. Either the inner droplet progressively shrinks and disappears, or it is suddenly expelled from the shell at a critical average thickness. We find that this critical average thickness increases with the osmotic pressure of the outer phase. Both processes involve the relocation and recombination of defects. Finally, we investigate the role of elasticity and osmotically driven flux of water through the shell, and hint at the importance of water flux affecting the critical size and time for the expulsion.
2 Nematic shells
2.1 Experimental methods
Nematic liquid crystal shells are generated using a glass capillary device.40 The shells are double emulsions consisting of an aqueous droplet of radius a that is contained inside a larger liquid crystalline droplet of radius R. That droplet is in turn dispersed in an aqueous solution; a schematic representation is provided in Fig. 1(a).The liquid crystal employed is 4-cyano-4′-pentylbiphenyl (5CB). Both the inner and outer phases contain 1 wt% polyvinyl alcohol (PVA), which ensures the stability of the double emulsions and enforces strong tangential boundary conditions for the nematic liquid crystal.5,41–43 Due to the density mismatch between the inner aqueous phase and the liquid crystalline phase, the inner droplet floats inside the outer one, leading to a non-uniform shell thickness. The center of the inner droplet is typically shifted by Δ with respect to the center of the outer droplet. The average thickness h is given by the difference between the outer and inner radii, h = R − a. In our experiments, R ranges between 50 and 75 μm and h ranges between a value bellow the micron and R.
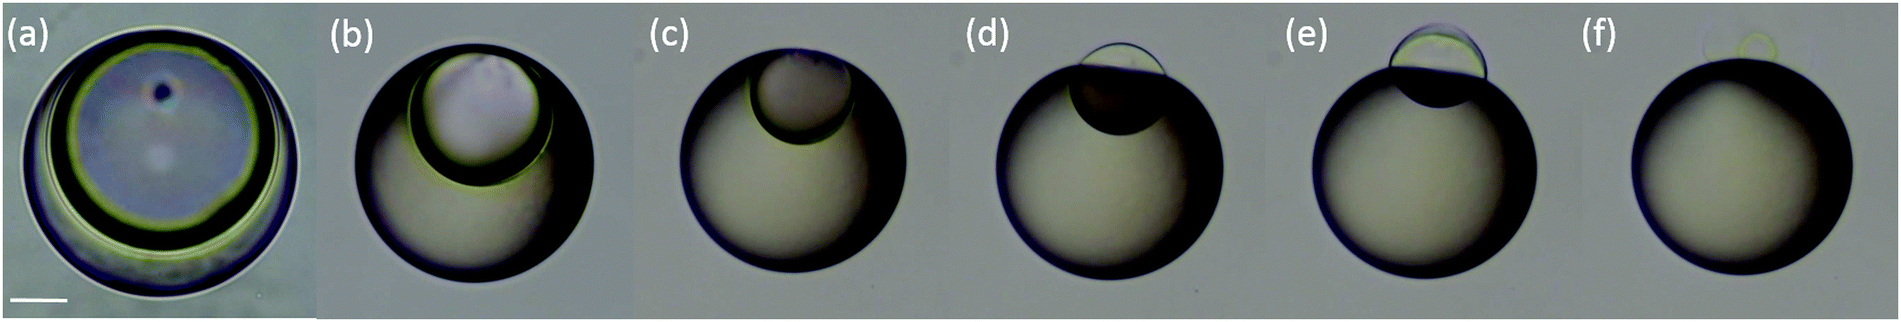
Osmotic forces are used to manipulate the shell thickness.6,44 Through the addition of salt, specifically CaCl2 at concentrations ranging between 10 wt% and 50 wt%, we induce a difference in osmotic pressure between the inner and outer aqueous phases, as illustrated in Fig. 2(a). The 5CB liquid crystal employed in our experiments has some permeability to water.45 Water transport therefore occurs between the inner and outer phases. Adding salt to the outer phase makes the inner droplet shrink; the inner radius a decreases progressively and h/R increases. By controlling this difference in osmotic pressure, we can also control the kinetics of the process and ultimately the range of variation of h/R.
 | ||
| Fig. 2 (a) Schematic illustration of the osmotic mechanism used to continuously vary the thickness of nematic shells (side view). (b–e) De-swelling process in a water/oil/water double emulsion when adding 10 wt% CaCl2 (top view). (f) During the process, the radius of the inner droplet a (black symbols) decreases, while the shell thickness h (blue symbols) increases. Scale bar: 25 μm. | ||
2.2 Numerical methods
Our calculations rely on a Landau–de Gennes (LdG) continuum model for the tensor order parameter Q, defined by , where S is the scalar order parameter and ni are the x, y, z components of the local director vector in a basis where Q is diagonal.46 The scalar order parameter S is given by an ensemble average of the second Legendre polynomials (P2(z) = 〈3/2cos2θ − 1/2〉) evaluated for the dot product between the molecular orientations and the director.
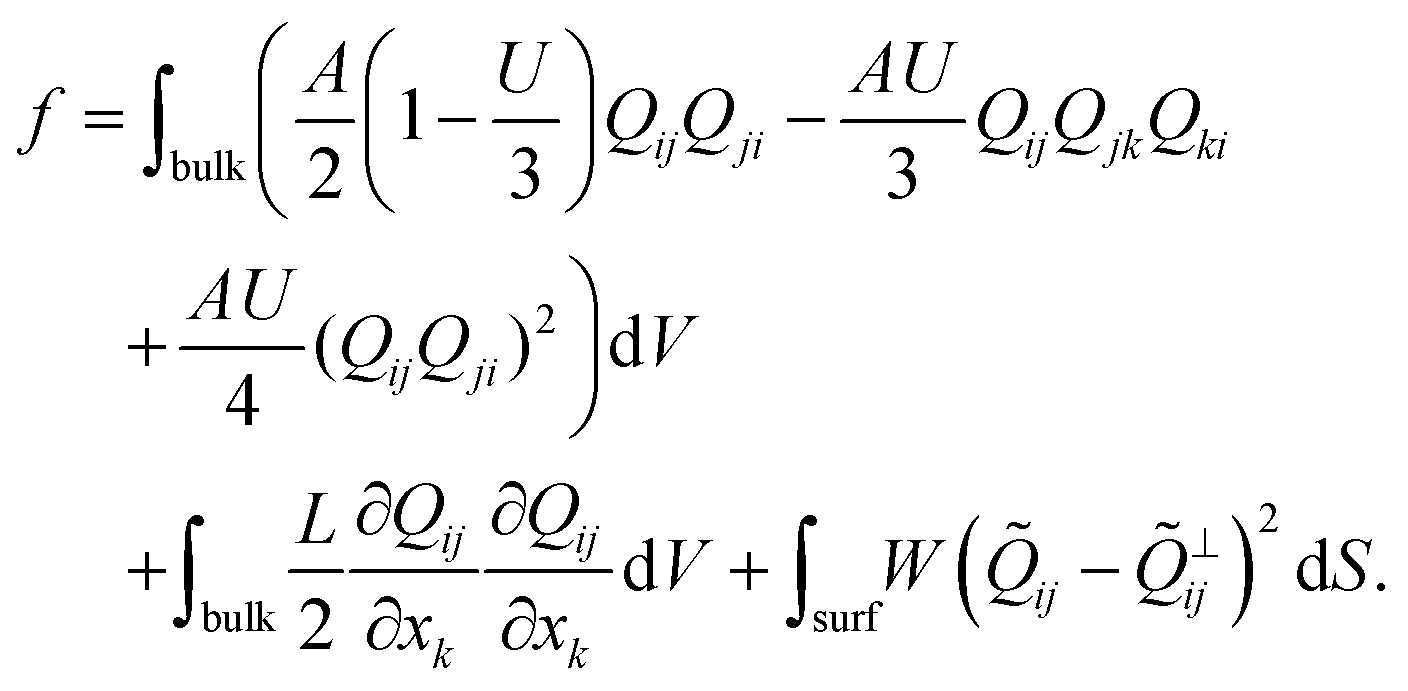
The total free energy of the system is given by
 | (1) |
![[Q with combining tilde]](https://www.rsc.org/images/entities/i_char_0051_0303.gif) ij is defined as
ij is defined as  , where Seq is the equilibrium scalar order parameter. ⊥ij is the projection of ij onto a surface with normal νi: ⊥ij = PikklPlj, where Pij = δij − νiνj is the projection operator.47
The first term in eqn (1) represents the short-range contributions to the free energy (or phase free energy). This term controls the equilibrium value of the nematic order parameter through  . The second term represents the elastic free energy, which governs long-range director distortions and penalizes elastic deformations in the bulk.48 The last term represents the surface energy, which quantifies deviations from planar degenerate anchoring on both the inner and outer boundaries of the shells.
An iterative Ginzburg–Landau relaxation technique with finite differences is implemented on a cubic mesh (with a resolution of 7.15 nm) to minimize the total free energy.49 The numerical parameters employed here are: A = 1.17 × 10⁵ J m−3, U = 5, L = 6 × 10⁻¹² N, W = 10−3 J m−2, and Seq = 0.762. The outer radius of the simulated shells was set to R = 1 mm. This value is significantly smaller than that of experimental shells. However, as shown later, the agreement between experiments and simulations suggests that the results are robust to changes in the shell size.
To characterize the fine structure of the defects, we rely on a splay-bend parameter SSB constructed from the second derivatives of the order parameter tensor  .50 Assuming there is no variation of the scalar order (S = Seq), in the director field representation, SSB is given by
 | (2) |
2.3 Computation of the time-dependent flux of water through the LC film
We describe the time-dependent flux of water through a thin LC film, upon addition of salt to the outer aqueous phase, using the following equation: | (3) |
The evolution of the water density inside the LC film can be simulated using the drift-diffusion Smoluchowski equation:52
 | (4) |
![[F with combining right harpoon above (vector)]](https://www.rsc.org/images/entities/i_char_0046_20d1.gif) = −∇W is the mean force. Assuming a location-independent diffusion constant D for water, the Smoluchowski equation in one dimension reduces to the following expression:
= −∇W is the mean force. Assuming a location-independent diffusion constant D for water, the Smoluchowski equation in one dimension reduces to the following expression: | (5) |
3 De-confinement transition
Osmotic effects can be used to induce a continuous transformation of the core–shell structure of regular water/oil/water double emulsions towards a simple droplet geometry, by the progressive de-swelling of the inner droplet, as schematically represented in Fig. 2(a). This geometrical transformation is shown in Fig. 2(b–e): upon salt addition to the continuous phase, the inner water droplet de-swells with time (black circles in Fig. 2(f)), making the shell progressively thicker (blue circles in Fig. 2(f)), until the inner droplet completely disappears. When nematic shells undergo such a geometrical transformation, the energy associated with the initial defect configuration typically increases, triggering transitions towards states that are lower in energy. We observe two different transitions, depending on the initial defect configuration of the shell.Increasing the shell thickness of a bivalent shell induces a re-location of the two pairs of boojums, as shown in Fig. 3. When the shell is relatively thick (0.2 < h/R < 0.5), the two pairs of boojums are not at antipodal positions, as observed in simulations, but confined to the thinnest part of the shell. This defect structure is shown in Fig. 3(a), which is a cross-polarized micrograph displaying the top view of the shell. Each boojum can be identified by four black brushes, resulting from the π-rotation induced by the defect on the neighboring director field. In Fig. 3(a), the eight black brushed highligthed by red arrows indicate the presence of two boojums, which are located nearby on the outer surface of the shell. Each of these two boojums has its analogue underneath, sitting on the shell inner surface. The equilibrium position of the two pairs of boojums results from the balance between: (i) a repulsive defect interaction of elastic nature and (ii) an attractive force due to the shell thickness gradient.5,6,36
 | ||
| Fig. 3 (a–e) Cross-polarized images of a shell (top view) with two pairs of +1 boojums at different stages of the de-swelling process. The red arrows indicate the location of the defects. The schematics below (side view) indicate the approximate position of the two pairs of +1 boojums (black dots) for each cross-polarized image. The time scale of the de-swelling process is of the order of 10 min. Scale bar: 25 μm. | ||
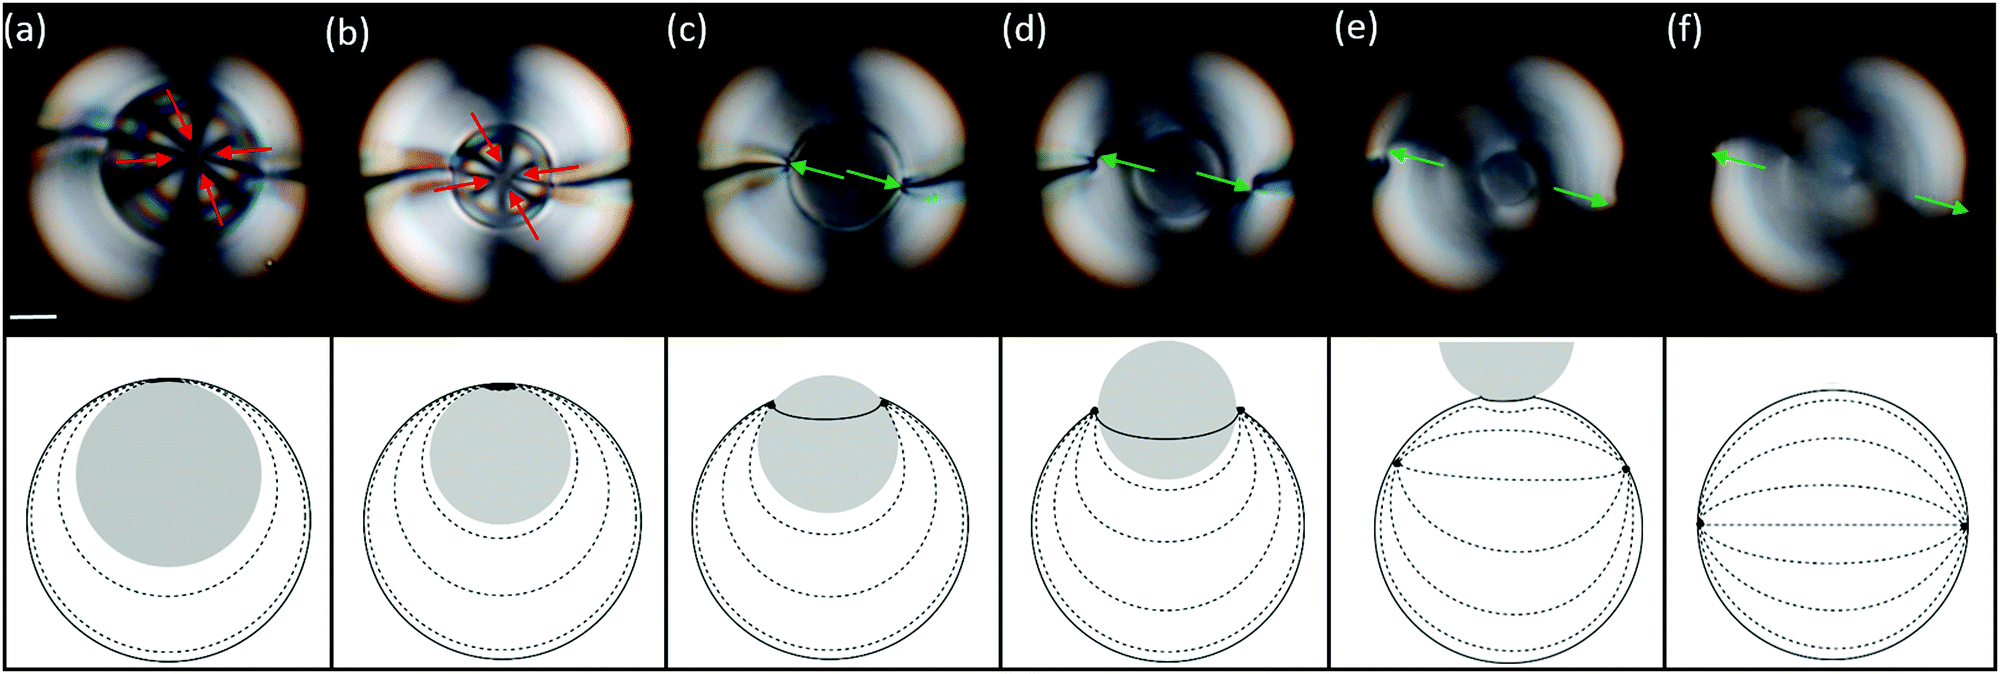
As the inner droplet de-swells, the shell becomes thicker, and the attractive term associated with the thickness gradient becomes more important, keeping the defects close together at the top of the shell. When the inner radius reaches a critical value, h/R ≈ 0.5, we observe an abrupt transition, in which one pair of boojums rapidly migrates towards the thick part of the shell, while the other one remains at its thinnest part.6Fig. 3(b and c) show two instants of this transition: as the distance between boojums becomes larger, we start distinguishing two sets of black brushes progressively moving apart. We refer to this process, where the boojum pairs relocate diametrically opposite to each other, as the de-confinement transition. In the final state, the shell adopts a bipolar configuration, where the two pairs of boojums are diametrically aligned, as shown in Fig. 3(d). This structure remains unaltered as the inner droplet continues to shrink. When the inner droplet eventually disappears, the two boojums that were linked to the inner droplet combine to vanish, giving rise to a bipolar nematic bulk droplet.
This transition, which is almost systematic in bivalent shells, is also observed, although rarely, in trivalent shells. In the latter case, two +1/2 disclination lines and a pair of +1 boojums are initially placed at the thinnest part of the shell, as seen in Fig. 4(a). As the inner drop decreases, the defects remain close together in order to reduce bulk distortions, as explained before. At the critical value of h/R, the pair of boojums migrates toward the bottom of the shell, leaving the two disclinations at the top of the shell, as seen in Fig. 4(c). The resulting final configuration corresponds to the simulated structure shown in Fig. 1(f). The rest of the process involves the shrinkage of the inner droplet, shown in Fig. 4(d and e), and the final recombination of the two +1/2 disclinations with the +1 boojum associated to the inner droplet, leading to the bipolar boojum structure of the final nematic droplet.
 | ||
| Fig. 4 (a–e) Cross-polarized images of a shell (top view) with one pair of +1 boojums and two +1/2 disclinations at different stages of the de-swelling process. The red arrows indicate the location of the defects. The schematics below (side view) indicate the approximate position of the +1/2 disclinations (black lines spanning the shell thickness) and the +1 boojums (black dots) on the outer sphere and its counterpart on the inner sphere. The time scale of the de-swelling process is of the order of 10 min. Scale bar: 25 μm. | ||
It is worth noting that the de-confining transition described above is intrinsically different from the defect relocation previously studied for cases where h/R progressively decreases to values close to zero.6 In the latter case, the defects continuously move apart as h/R becomes smaller, instead of abruptly transitioning between two states. In bivalent shells, both phenomena lead to the same final bipolar structure, see Fig. 1(c). In trivalent shells, conversely, the decrease of h/R yields a triangular defect arrangement, which is totally different from the structure in Fig. 1(f). Besides, in trivalent shells, the defects behave differently depending whether h/R increases or decreases: the pair of boojums moves towards the thinnest part of the shell when h/R decreases, while they migrate towards the shell thicker part when h/R increases.
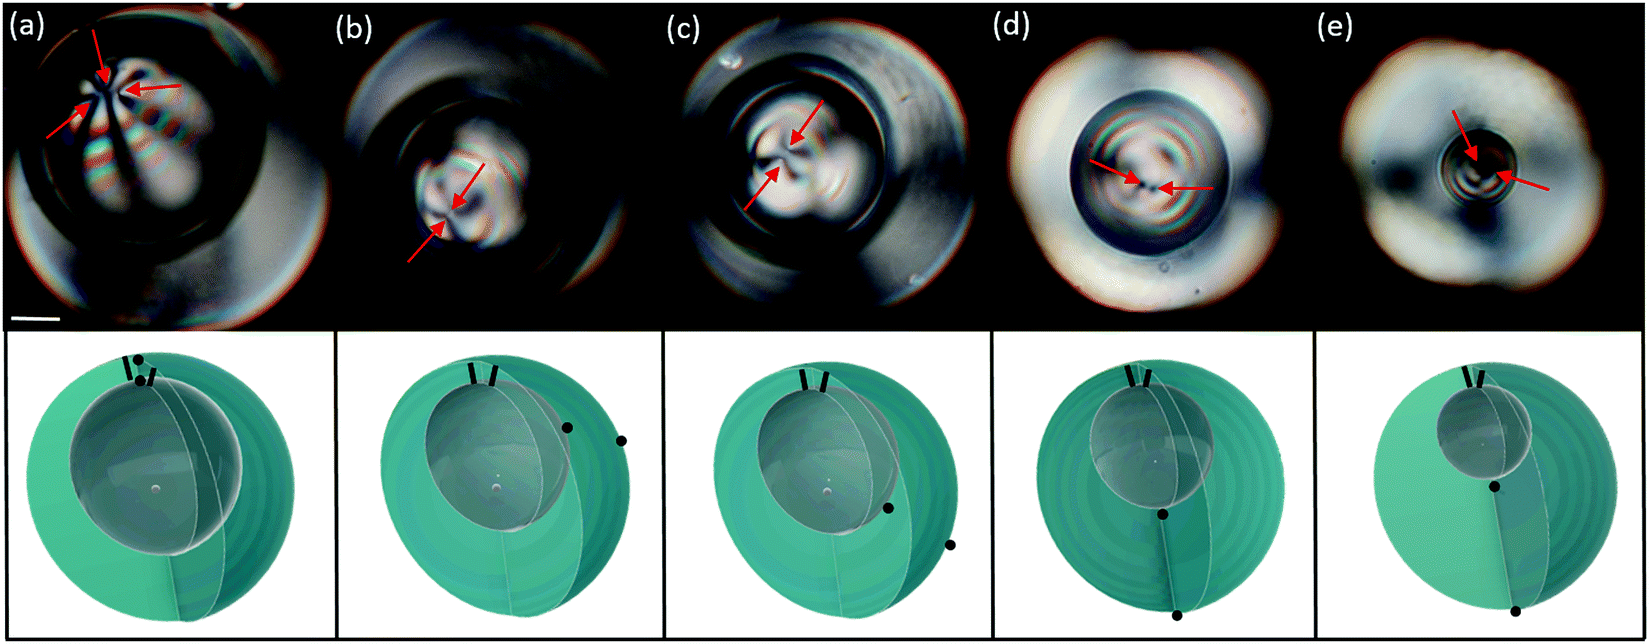
In tetravalent shells, increasing the osmotic pressure of the outer phase triggers a completely different phenomenon, as shown in the sequence of bright-field images of Fig. 5(a–f). Similarly to the experiments described above, the inner droplet de-swells and the shell becomes progressively thicker, see Fig. 5(a–c). However, when the inner radius decreases below a critical value, Fig. 5(d), the inner droplet is suddenly expelled out of the shell, which abruptly transitions into a bulk nematic droplet, see Fig. 5(f). We observe expulsion at values of h/R between 0.5 and 0.6, depending on the salt concentration. These values are reasonably close to the critical value at which our simulations predict the transition between the tetravalent and trivalent configurations (h/R = 0.55), see Fig. 1(g).
 | ||
| Fig. 5 (a–f) Bright-field images (top view) showing the de-swelling and expulsion of the inner droplet in a tetravalent nematic shell. Images (a)–(c) show how the inner droplet de-swells with time until it reaches a critical size at which the inner droplet goes through the outer droplet, as shown in (d) and (e). When the inner droplet is completely out of the outer one, the nematic shell becomes a nematic droplet, as shown in (f). The time scale of the de-swelling process, from (a) to (b), is of the order of 10 min, while the time scale of the expulsion, from (c) to (f), is of the order of 1 s. Scale bar is 25 μm. | ||
This geometrical transformation, from the shell to the droplet geometry, produces a series of topological changes in the nematic field, as shown in Fig. 6. Initially, the four +1/2 disclinations are located at the top of the shell, Fig. 6(a). These defects remain tightly clustered as the shell becomes thicker as seen in Fig. 6(b). When the inner droplet starts travelling across the outer one, the initial +1/2 disclinations disappear and two +1 boojums nucleate at the contact line between the inner and outer droplet, Fig. 6(c). These two boojums eventually unpin from the contact line and move away from each other, due to the repulsion existing between like-charged defects46 to eventually relocate a diameter away in the final nematic droplet, shown in Fig. 6(d)–(f). This phenomenon is also observed in trivalent shells, when the de-confinement transition does not take place.
 | ||
| Fig. 6 Topological transformations undergone by a shell with four +1/2 disclinations upon the de-swelling of the inner droplet. The upper part of the figure shows cross-polarized images of the shell (top view), while the lower part of the figure shows the corresponding schematics of the director field (side view). (a) Initially the shell has four +1/2 disclinations indicated by red arrows. (b) As the shell becomes thicker, the +1/2 disclinations become closer. (c) When the inner droplet is expelled out of the outer one, the +1/2 disclinations transform into boojums of charge +1, indicated by green arrows. (d and e) The boojums move away from each other, as the inner droplet goes across the interface. (f) In the final state, the boojums are placed at opposite sides of the remaining nematic bulk droplet. The time scale of the de-swelling process is of the order of 10 min. Scale bar is 25 μm. | ||
4 Expulsion of inner droplet
4.1 Energy barrier for the expulsion
The expulsion of the inner droplet does not occur in regular water/oil/water double emulsions; it might therefore be related to the elasticity of the nematic liquid crystal. To test this hypothesis, we repeat the de-swelling experiment at a temperature above the isotropic–nematic transition temperature, where the elastic forces are absent. Consistent with our expectations, the inner droplet is never expelled in this case, demonstrating that nematic elasticity is a key factor in the expulsion of the inner droplet.It appears that the symmetry of the shell also plays a role, since the expulsion of the inner droplet does not take place in shells with a bipolar structure, either if they are bivalent or trivalent. Irrespective of the shell valency, if the defects stay confined during the de-swelling experiment, the inner droplet is eventually expelled out of the shell. However, if the defects move to the poles along the process, the expulsion never happens. We thus consider and compare two distinct situations: (i) a confined instance in which the defects are placed at the thinnest part of the shell, yielding a director field with the symmetry shown in Fig. 7(a), and (ii) a de-confined situation where the defects are arranged diametrically, yielding a director field with the symmetry shown in Fig. 7(d). Bringing the inner droplet out of the outer one is expected to induce the formation of a pair of boojums, if the shell is in the confined state [Fig. 7(b)], or a singular disclination ring, if the shell is in the de-confined situation [Fig. 7(e)], when the inner droplet intersects the outer one.
 | ||
| Fig. 7 (a) Schematic director field of nematic shell in a confined state (side view). (b) Schematic transient structure with two half-boojums at opposite sides of the contact line (side view). (c) Simulated transient structure showing the same configuration (side view); the director field on the inner sphere is represented in the image highlighted in black, while the director field around the defect is shown in the image highlighted in blue. (d) Schematic director field of nematic shell in a de-confined state (side view). (e) Schematic transient structure with a singular ring (side view). (f) Simulated transient structure where the singular ring destabilizes into a sequence of point defects (side view); the director field on the inner sphere is represented in the image highlighted in black, while the director field around the defect is shown in the image highlighted in blue. Director fields in the x–z plane are colored. The color indicates the projection onto the z-axis. | ||
To probe the effect of the director field symmetry in the expulsion process, we perform numerical simulations. We consider a shell either in a confined or a de-confined state and calculate the evolution of the director field, and the corresponding free energy, as the inner drop shifts out of the shell. In the case of a shell in a confined state, we observe a transient structure with two boojums at opposite sides of the contact line, as expected. This structure is shown in Fig. 7(c): the image highlighted in black shows the director field on the inner sphere, and the one highlighted in blue shows the top view of the shell, where we can see the director field around the defect. In the case of a shell in a de-confined state, we observe the structure shown in Fig. 7(f): because of energy minimization reasons, the expected singular ring destabilizes into a sequence of point defects, which coexist with the lower pair of boojums. Since the total topological charge has to be two, we observe an alternation of positive and negative defects along the ring, as represented in the image highlighted in blue in Fig. 7(f), with an overall charge of zero.
Fig. 8 shows the energy difference between the transient state [Fig. 7(c)] and the confined state [Fig. 7(a)], denoted as ΔF(confined), and the energy difference between the transient state [Fig. 7(f)] and the de-confined state [Fig. 7(d)], denoted as ΔF(de-confined), as a function of h/R. In the confined state, ΔF is slightly negative, and thus, it is energetically favorable to expel the droplet out of the shell. In contrast, in the de-confined situation, ΔF is always positive, revealing that there is an energy barrier that prevents the inner droplet from being expelled. As expected, this barrier disappears when the shell turns into a droplet (h/R → 1).
 | ||
| Fig. 8 Energy barriers associated to the droplet expulsion for the confined and de-confined states as the inner droplet de-swells. | ||
4.2 Effect of water flux
In our experiments, the inner drop is expelled at a critical inner radius a* that depends on the salt concentration used to de-swell the inner droplet. Higher salt concentrations induce a faster de-swelling dynamics, see Fig. 9. Remarkably, we observe that a* decreases approximately linearly with the salt concentration, as shown in the inset in Fig. 9. This suggests that the flux of water through the shell might play a relevant role in the destabilization of the nematic film separating the inner droplet from the continuous phase.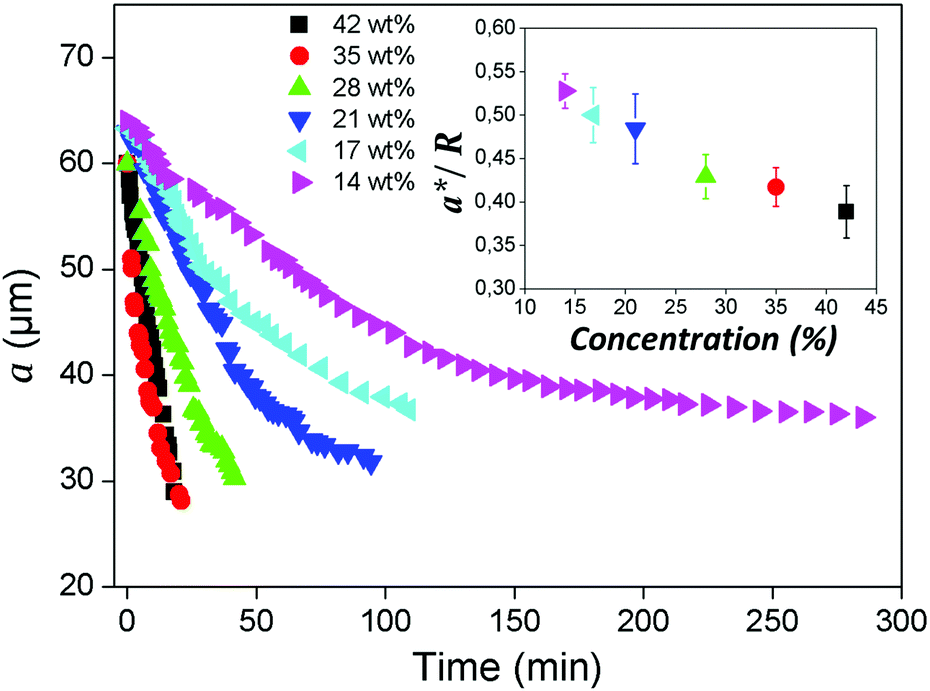 | ||
| Fig. 9 Variation of the inner droplet radius a as a function of time for different salt concentrations. Inset: Critical inner radius a* at which the droplet is expelled as a function of salt concentration. | ||
To investigate a possible correlation between the critical expulsion time and flow effects, we calculate, as described in Section 2.3, the water flux through the shell in a de-swelling process. In the experiment, after salt addition, the inner droplet flattens at its thinner part to facilitate the transport of water, as shown in Fig. 10(a). We assume that the flux of water mainly occurs through this thin nematic film. We simulate a 100 nm film of 5CB, which is in contact with the inner and the outer phases used in the experiments, and compute the flux of water through this thin film for different salt concentrations, as illustrated in Fig. 10(b).
 | ||
| Fig. 10 Continuum simulations of water flux. (a) Bright-field image of a nematic shell during the de-swelling of the inner droplet (top view). (b) Schematic illustration of the thin part of a shell (side view): a film of 5CB with a thickness ∼100 nm. (c) Time-dependent flux of water through the thin film after addition of different concentrations of CaCl2. (d) Correlation between the expulsion time for the inner drop and the water flux in the steady state for different concentrations of CaCl2. | ||
The water flux profiles through the thin film, shown in Fig. 10(c), indicate that the addition of salt to the outer phase leads to a burst of water flux within the first few microseconds that follow salt addition, after which the system reaches a steady state where the flux of water remains constant. This phenomenon has been studied in detail by Ramezani-Dakhel et al.45 The magnitude of the water flux in the steady state increases with salt concentration. Consistent with experiments, we find that the expulsion time, that is, the time needed for the film to destabilize and break, is related to the non-equilibrium flux of water going through the film; it decreases with salt concentration. Interestingly, we find that the steady-state flux depends on the expulsion time as 1/t [see Fig. 10(d)], which is stronger than linearly, suggesting that larger values of J result in smaller sizes a*, even if the expulsion time is smaller; this qualitatively explain our results. Elucidating the origin of the dependence between the critical breaking time and salt concentration, which relies on microscopic details, is out of the scope of this work. Indeed, the breaking of a nematic LC film under an osmotic pressure is a relatively complex process that involves certain stochasticity. Several factors including (i) the diffusion of salt from the continuous phase to the outer surface, (ii) the variable thickness of the LC film due to water transport, (iii) the three-dimensional diffusion of water from the inner drop to the outer phase, and (iv) the formation of water channels between the inner and outer phases may all play relevant roles in the film stability. The specific details of such mechanisms will be the subject of future investigations.
5 Conclusions
We have investigated the possibility of triggering valence transitions in nematic shells by inducting radical changes in their geometry. These geometrical changes are achieved by osmotically de-swelling the inner water droplet until it fully disappears. In the process, the shell continuously increases its overall thickness until it eventually becomes a single nematic droplet. The initial defect configuration of the shell evolves to reach a bipolar defect configuration, with two diametrically located +1 boojums, as it becomes a single droplet. We find that the final bipolar state can be reached through two distinct pathways depending on the shell initial number and type of defects, i.e. the shell valency. In the first pathway, the shell undergoes an abrupt transition in which the defects relocate in a bipolar configuration, while in the second pathway the inner droplet is suddenly expelled out of the shell. Interestingly, transitions involving a change in the shell valency, which means changing the topological charges of the defects, are never observed. Defect relocation occurs systematically in bivalent shells, which host two pairs of +1 boojums, while droplet expulsion systematically occurs in tetravalent shells, which host four +1/2 disclination lines. Shells combining +1 boojums with +1/2 disclination lines, i.e. trivalent shells, can exhibit either of the two behaviors. The critical inner radius at which the transition takes place is independent on the osmotic pressure difference in the case of defect relocation, while it linearly depends on salt concentration when the inner droplet is expelled from the shell. We use numerical simulations and modeling to investigate the origin of these two transitions. We conclude that defect relocation is greatly affected by the elasticity of the liquid crystal and that the osmotically driven water flux going through the shell also plays a role on the shell stability and inner droplet expulsion.Conflicts of interest
There are no conflicts to declare.Acknowledgements
This work was supported by the French National Research Agency, ANR (Grant No. 13-JS08-0006-0) and the MCIN/AEI/10.13039/501100011033/FEDER, UE (Grant No. PID2021-122369NB-100). The theoretical and computational analysis reported in this work was supported by the Department of Energy, Basic Energy Sciences, Division of Materials Research, Biomaterials Program under grant no. DE-SC0019762. We thank V. Vitelli and V. Koning for early discussions.References
- N. D. Mermin, in Quantum fluids and solids, ed. S. Trickey, E. Adams and J. Dufty, Springer, Boston, MA, 1977, pp. 3–22 Search PubMed.
- G. E. Volovik, JETP Lett., 1978, 28, 59 Search PubMed.
- G. E. Volovik and O. D. Lavrentovich, Sov. Phys. JETP, 1983, 58, 1159 Search PubMed.
- V. Vitelli and D. R. Nelson, Phys. Rev. E: Stat., Nonlinear, Soft Matter Phys., 2006, 74, 021711 CrossRef CAS PubMed.
- A. Fernandez-Nieves, V. Vitelli, A. S. Utada, D. R. Link, M. Marquez, D. R. Nelson and D. A. Weitz, Phys. Rev. Lett., 2007, 99, 157801 CrossRef CAS PubMed.
- T. Lopez-Leon, V. Koning, K. B. S. Devaiah, V. Vitelli and A. Fernandez-Nieves, Nat. Phys., 2011, 7, 391–394 Search PubMed.
- S. R. Seyednejad, M. R. Mozaffari and M. R. Ejtehadi, Phys. Rev. E: Stat., Nonlinear, Soft Matter Phys., 2013, 88, 1–6 CrossRef PubMed.
- V. Koning, T. Lopez-Leon, A. Fernandez-Nieves and V. Vitelli, Soft Matter, 2013, 9, 4993–5003 RSC.
- C. R. Wand and M. A. Bates, Phys. Rev. E: Stat., Nonlinear, Soft Matter Phys., 2015, 91, 012502 CrossRef PubMed.
- V. Koning, T. Lopez-Leon, A. Darmon, A. Fernandez-Nieves and V. Vitelli, Phys. Rev. E, 2016, 94, 012703 CrossRef PubMed.
- Y. Zhou, A. Guo, R. Zhang, J. C. Armas-Perez, J. A. Martinez-Gonzalez, M. Rahimi, M. Sadati and J. J. de Pablo, Soft Matter, 2016, 12, 8983–8989 RSC.
- T. Lopez-Leon and A. Fernandez-Nieves, Phys. Rev. E: Stat., Nonlinear, Soft Matter Phys., 2009, 79, 021707 CrossRef CAS PubMed.
- T. Lopez-Leon, M. A. Bates and A. Fernandez-Nieves, Phys. Rev. E: Stat., Nonlinear, Soft Matter Phys., 2012, 86, 030702 CrossRef PubMed.
- J. Noh, K. R. De Sousa and J. P. F. Lagerwall, Soft Matter, 2016, 12, 367–372 RSC.
- J. Noh, Y. Wang, H.-L. Liang, V. S. R. Jampani, A. Majumdar and J. P. F. Lagerwall, Phys. Rev. Res., 2020, 2, 033160 CrossRef CAS.
- G. Durey, Y. Ishii and T. Lopez-Leon, Langmuir, 2020, 36, 9368–9376 CrossRef CAS PubMed.
- M. A. Bates, J. Chem. Phys., 2008, 128, 104707 CrossRef PubMed.
- H. Shin, M. J. Bowick and X. Xing, Phys. Rev. Lett., 2008, 101, 037802 CrossRef PubMed.
- T. Lopez-Leon, A. Fernandez-Nieves, M. Nobili and C. Blanc, Phys. Rev. Lett., 2011, 106, 247802 CrossRef PubMed.
- D. Seč, T. Lopez-Leon, M. Nobili, C. Blanc, A. Fernandez-Nieves, M. Ravnik and S. Žumer, Phys. Rev. E: Stat., Nonlinear, Soft Matter Phys., 2012, 86, 020705(R) CrossRef PubMed.
- S. Dhakal, F. J. Solis and M. O. De La Cruz, Phys. Rev. E: Stat., Nonlinear, Soft Matter Phys., 2012, 86, 011709 CrossRef PubMed.
- G. Skačej and C. Zannoni, Phys. Rev. Lett., 2008, 100, 197802 CrossRef PubMed.
- E. J. L. de Oliveira, I. N. de Oliveira, M. L. Lyra and L. V. Mirantsev, Phys. Rev. E, 2016, 93, 012703 CrossRef CAS PubMed.
- Y. Ishii, Y. Zhou, K. He, Y. Takanishi, J. Yamamoto, J. J. de Pablo and T. Lopez-Leon, Soft Matter, 2020, 16, 8169–8178 RSC.
- M. A. Bates, Soft Matter, 2008, 4, 2059–2063 RSC.
- L. V. Mirantsev, E. J. L. de Oliveira, I. N. de Oliveira and M. L. Lyra, Liq. Cryst. Rev., 2016, 4, 35–58 CrossRef CAS.
- M. A. Bates, G. Skačej and C. Zannoni, Soft Matter, 2010, 6, 655–663 RSC.
- S. Kralj, R. Rosso and E. G. Virga, Soft Matter, 2011, 7, 670–683 RSC.
- G. Napoli and L. Vergori, Phys. Rev. E: Stat., Nonlinear, Soft Matter Phys., 2012, 85, 061701 CrossRef PubMed.
- G. Napoli and L. Vergori, Phys. Rev. Lett., 2012, 108, 207803 CrossRef PubMed.
- M. Sadati, Y. Zhou, D. Melchert, A. Guo, J. A. Martínez-González, T. F. Roberts, R. Zhang and J. J. de Pablo, Soft Matter, 2017, 13, 7465–7472 RSC.
- B. L. Mbanga, K. K. Voorhes and T. J. Atherton, Phys. Rev. E: Stat., Nonlinear, Soft Matter Phys., 2014, 89, 052504 CrossRef PubMed.
- T. Lubensky and J. Prost, J. Phys. II, 1992, 2, 371–382 CrossRef CAS.
- J. Dzubiella, M. Schmidt and H. Löwen, Phys. Rev. E: Stat. Phys., Plasmas, Fluids, Relat. Interdiscip. Top., 2000, 62, 5081–5091 CrossRef CAS PubMed.
- D. R. Nelson, Nano Lett., 2002, 2, 1125–1129 CrossRef CAS.
- A. Darmon, O. Dauchot, T. Lopez-Leon and M. Benzaquen, Phys. Rev. E, 2016, 94, 062701 CrossRef PubMed.
- M. A. Bates, Liq. Cryst., 2018, 45, 2390–2399 CrossRef CAS.
- H. Hopf, Math. Ann., 1927, 96, 225–249 CrossRef.
- H. Poincaré, J. Math. Pures Appl., 1881, 7, 375–422 Search PubMed.
- A. Utada, E. Lorenceau, D. Link, P. Kaplan, H. Stone and D. Weitz, Science, 2005, 308, 537–541 CrossRef CAS PubMed.
- A. A. Sonin, The surface physics of liquid crystals, Gordon and Breach Publishers, 1995 Search PubMed.
- P. S. Drzaic, Liquid crystal dispersions, World Scientific, 1995 Search PubMed.
- P. Poulin and D. A. Weitz, Phys. Rev. E: Stat. Phys., Plasmas, Fluids, Relat. Interdiscip. Top., 1998, 57, 626 CrossRef CAS.
- R. Mezzenga, M. F. Britta and E. Hughes, Langmuir, 2004, 20, 3574–3582 CrossRef CAS PubMed.
- H. Ramezani-Dakhel, M. Sadati, R. Zhang, M. Rahimi, K. Kurtenbach, B. Roux and J. J. de Pablo, ACS Cent. Sci., 2017, 3, 1345–1349 CrossRef CAS PubMed.
- P. G. de Gennes and J. Prost, The physics of liquid crystals, Oxford Science Publications, 1993 Search PubMed.
- J.-B. Fournier and P. Galatola, Europhys. Lett., 2005, 72, 403–409 CrossRef CAS.
- M. Doi, Soft matter physics, Oxford University Press, 2013 Search PubMed.
- M. Ravnik and S. Žumer, Liq. Cryst., 2009, 36, 1201–1214 CrossRef CAS.
- S. Čopar, T. Porenta and S. Žumer, Liq. Cryst., 2013, 40, 1759–1768 CrossRef.
- M. Kleman and O. D. Laverntovich, Soft matter physics: an introduction, Springer Science & Business Media, 2007 Search PubMed.
- M. Smoluchowski, Ann. Phys., 1915, 353, 1103–1112 CrossRef.
- A. V. Bui, H. M. Nguyen and M. Joachim, J. Food Eng., 2003, 57, 243–248 CrossRef.
Footnote |
| † The term boojum was introduced for the first time by N. D. Mermin for the vectorial field of superfluid 3HeA1 and extended to the director field of liquid crystals by G. E. Volovik.2 This concept was then expanded and related to experimental studies of nematic droplets by G. E. Volovik and O. D. Lavrentovich.3 |
| This journal is © The Royal Society of Chemistry 2022 |