
Electronic relaxation and dissociation dynamics in formaldehyde: pump wavelength dependence
Tomoyuki
Endo
 *ab,
Simon P.
Neville
c,
Philippe
Lassonde
a,
Chen
Qu
d,
Hikaru
Fujise
e,
Mizuho
Fushitani
e,
Akiyoshi
Hishikawa
ef,
Paul L.
Houston
gh,
Joel M.
Bowman
i,
François
Légaré
*a,
Michael S.
Schuurman
*cj and
Heide
Ibrahim
*a
*ab,
Simon P.
Neville
c,
Philippe
Lassonde
a,
Chen
Qu
d,
Hikaru
Fujise
e,
Mizuho
Fushitani
e,
Akiyoshi
Hishikawa
ef,
Paul L.
Houston
gh,
Joel M.
Bowman
i,
François
Légaré
*a,
Michael S.
Schuurman
*cj and
Heide
Ibrahim
*a
aCentre Énergie Matériaux Télécommunications, Institut National de la Recherche Scientifique, 1650 Boulevard Lionel-Boulet, Varennes, QC J3X 1S2, Canada. E-mail: francois.legare@INRS.ca; heide.ibrahim@INRS.ca
bKansai Photon Science Institute, National Institutes for Quantum Science and Technology, Umemidai, Kizugawa, Kyoto 619-0215, Japan. E-mail: endo.tomoyuki@qst.go.jp
cNational Research Council Canada, 100 Sussex Drive, Ottawa, ON K1A 0R6, Canada
dDepartment of Chemistry & Biochemistry, University of Maryland, College Park, Maryland 20742, USA
eDepartment of Chemistry, Graduate School of Science, Nagoya University, Nagoya, Aichi 464-8602, Japan
fResearch Center for Materials Science, Nagoya University, Nagoya, Aichi 464-8602, Japan
gDepartment of Chemistry and Chemical Biology, Cornell University, Ithaca, NY 14852, USA
hSchool of Chemistry and Biochemistry, Georgia Institute of Technology, Atlanta, Georgia 30332, USA
iDepartment of Chemistry and Cherry L. Emerson Center for Scientific Computation, Emory University, Atlanta, Georgia 30322, USA
jDepartment of Chemistry and Biomolecular Sciences, University of Ottawa, 10 Marie Curie, Ottawa, ON K1N 6N5, Canada. E-mail: michael.schuurman@nrc-cnrc.gc.ca
First published on 14th December 2021
Abstract
The effect of the incident UV pump wavelength on the subsequent excited state dynamics, electronic relaxation, and ultimate dissociation of formaldehyde is studied using first principles simulation and Coulomb explosion imaging (CEI) experiments. Transitions in a vibronic progression in the à ← ![[X with combining tilde]](https://www.rsc.org/images/entities/i_char_0058_0303.gif) absorption band are systematically prepared using a tunable UV source which generates pulses centered at 304, 314, 329, and 337 nm. We find, both via ab initio simulation and experimental results, that the rate of excited state decay and subsequent dissociation displays a prominent dependence on which vibronic transition in the absorption band is prepared by the pump. Our simulations predict that nonadiabatic transition rates and dissociation yields will increase by a factor of >100 as the pump wavelength is decreased from 337 to 304 nm. The experimental results and theoretical simulations are in broad agreement and both indicate that the dissociation rate plateaus rapidly after ≈2 ps following an ultrafast sub-ps rise.
absorption band are systematically prepared using a tunable UV source which generates pulses centered at 304, 314, 329, and 337 nm. We find, both via ab initio simulation and experimental results, that the rate of excited state decay and subsequent dissociation displays a prominent dependence on which vibronic transition in the absorption band is prepared by the pump. Our simulations predict that nonadiabatic transition rates and dissociation yields will increase by a factor of >100 as the pump wavelength is decreased from 337 to 304 nm. The experimental results and theoretical simulations are in broad agreement and both indicate that the dissociation rate plateaus rapidly after ≈2 ps following an ultrafast sub-ps rise.
1 Introduction
Often, a pump–probe experiment is similar to a black box where only the input parameters and output observables are known. However, the ultimate goal is to identify the mechanism that explains how the observables arise given a specific set of initial conditions. This will generally require not only careful analysis of the experimental data, but often high-level simulation of both the underlying dynamics and the resultant measurable quantity. Understanding the rates of radiation-less transition between electronic states, and the nature of the vibrations that mediate this population transfer, has been a focus of experimental and theoretical efforts since the 1960s.1,2 Less quantitatively studied, however, has been the ability of the decay mechanism itself to affect specific chemical processes following return to the ground state.3,4 In general, only a subset of vibrational modes will appreciably modulate the vibronic coupling that facilitates internal conversion. Thus, following electronic relaxation, and particularly for ultrafast processes, the resultant phase space distribution of a ground electronic state wave packet may be strongly localized in terms of mode excitation. In other words, where does a wave packet end-up in the ground state upon relaxation from an electronically excited state, and how does this influence subsequent reaction dynamics? The energy distribution following return to the ground state will have implications for the time-evolution of the subsequent ground state dynamics. However, the ability to simulate, in a quantitative and cohesive manner, both the excited state dynamics and subsequent hot ground state processes pose a daunting challenge for computational studies. Indeed, even identifying a spectroscopic observable that can resolve these different types of dynamics in a time-resolved manner is difficult.In a recent joint experimental–theoretical work,5,6 our team was able to directly image roaming dynamics of formaldehyde in real time using the time-resolved Coulomb explosion imaging (CEI) technique in a pump–probe scheme to capture the statistically occurring signal. The identification of individual dissociation reaction paths was however only possible upon confirmation that population initially excited to the first excited electronic state à with a femtosecond laser pulse is able to reach the vibrationally excited electronic ground state within the observed timescales of a few hundred femtoseconds – in strong contrast to the generally assumed lifetime of tens of nanoseconds known from high-resolution spectroscopy.7 This confirmation was critically important since the various dissociation channels open up only on the ground state. The key was that the essentially background-free ultrafast detection system, CEI with single-molecule sensitivity, allows to observe the onset of dynamics that is five orders of magnitude faster than previously assumed.
By identifying experimental observables that are sensitive to real-time events rather than to specific product outcomes related to roaming or the other dissociation channels, we could distinguish the roaming pathway from the conventional molecular and radical dissociation reactions. We could also generalize the definition of roaming dynamics of formaldehyde (H2CO) such that a roaming hydrogen fragment, upon completion of the roaming motion, might either: (i) return to the equilibrium geometry, (ii) abstract another hydrogen and both of them leave the remaining CO fragment together, or (iii) dissociate from the remaining HCO fragment. While previously it was generally assumed that the roaming path would end up in the two product channels related to molecular dissociation (H2 + CO in the case of formaldehyde8–10), we were able to show that it can also end as radical products (e.g. H + HCO).
While our previous work focused on a single pump wavelength of 304 nm, in this study we consider the effect of this parameter on the subsequent overall dissociation dynamics. We again employ quantum dynamical simulations (at the Multiconfigurational Time-Dependent Hartree, MCTDH, level of theory), quasi-classical trajectory (QCT) simulations on an accurate ground state potential energy surface (PES), as well as the experimental time-resolved CEI technique to study how pumping at wavelengths corresponding to different vibronic bands in the absorption spectrum influences the subsequent observed (and simulated) multi-state dynamics and ground state dissociation.
2 Experimental methods and results
The experimental methods and analysis are described in detail elsewhere.5,11 Briefly, we employed the time-resolved CEI method at the Advanced Laser Light Source, ALLS (INRS-EMT, Varennes, Canada). Deuterated formaldehyde (D2CO) was chosen for experimental reasons, to clearly separate the sought-after signal from residual background signals such as protons from H2O or hydrocarbons.A tunable UV pump pulse with the following parameter combination (304–337 nm, 200–70 fs, 5–8 μJ) excites the system in a single-photon process to the electronically excited à state. The pump intensity at the focal spot was estimated to be between 0.3–1 × 10¹² W cm−2 from the measurements of pulse duration, pulse energy, and spot size at the focal point.5 The absorption cross section of D2CO12 and the spectra of the UV pump pulses used in the present study are shown in Fig. 1a). Wavelengths of 304 nm and 314 nm are resonant with strong absorption lines of the Q42Q14 and Q32Q14 bands, respectively, whereby Q2 corresponds to the C–O stretching mode and Q4 to the out-of-plane bending mode. Longer wavelengths are only partially overlapping with the Q12Q14 bands (337 nm) or almost not overlapping (329 nm).
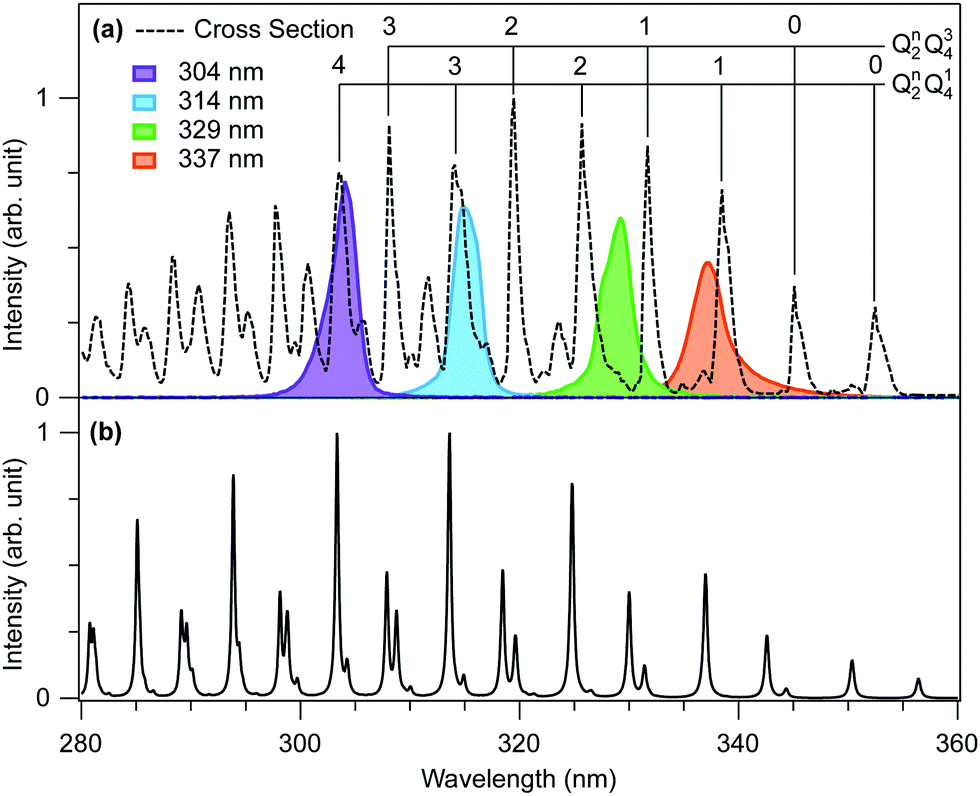 | ||
| Fig. 1 (a) Experimental absorption cross section of D2CO12 (black dotted line) and the UV spectra (solid lines) used in the present study. Strong absorption bands are assigned based on ref. 7, 12 and 13. Q2 and Q4 correspond to the C–O stretching mode and out-of-plane bending mode, respectively. (b) Simulated absorption spectrum. | ||
A time-delayed probe pulse (800 nm, ∼8 fs, 120 μJ) ionizes the photo-excited molecules to different multiply charged states and induces Coulomb explosion from which information about the molecular structure at different pump–probe delays can be deduced. Both laser pulses were focused into a collimated gas jet of D2CO obtained by sublimation of paraformaldehyde-d2 (purity 98%, Sigma-Aldrich). Ionic fragments resulting from Coulomb explosion are collected with a uniform-electric-field ion imaging spectrometer. Their full three-dimensional momenta are retrieved using a time- and position-sensitive delay-line detector at the end of an ion time of flight (TOF) spectrometer (RoentDek Handels GmbH). A TOF window is defined in order to identify events registered by the position sensitive detector as specific fragment ions – either D+, C+, O+, D2+, CD+, CO+, or COD+. The data are then parsed, laser shot by laser shot, for the existence of a specific fragmentation channel – e.g. (D+, D+, CO+) for the three-body breakup. The evaluated momentum information for this channel is stored for further calculation of various metrics – e.g. total kinetic energy release (KER), or the angle between momenta of fragments (θ).
On average, each laser shot excites a neutral molecule in the ultrasonic jet. From this molecule we detect the full fragment momentum information in coincidence. The data were acquired for 2–3 days at each wavelength. All this information together is fed into the time resolved data plots. As discussed in our previous work,5 we experimentally verified excitation to the à state in various ways, including laser-induced fluorescence measurements and photo-electron spectroscopy.
The focus of the present work is to study the overall dissociation yield of excited formaldehyde molecules, rather than investigating the individual dissociation channels as done previously.5 The temporal evolution of experimental yields of dissociating molecules at four different wavelengths is shown in Fig. 2. Following the previous analysis, the yields are evaluated by the ratio of the number of counts in the KER region below 10 eV to the total number of counts in the (D+, D+, CO+) channel, thus combining the counts within the three different dissociation channels: molecular and radical dissociation, as well as roaming.
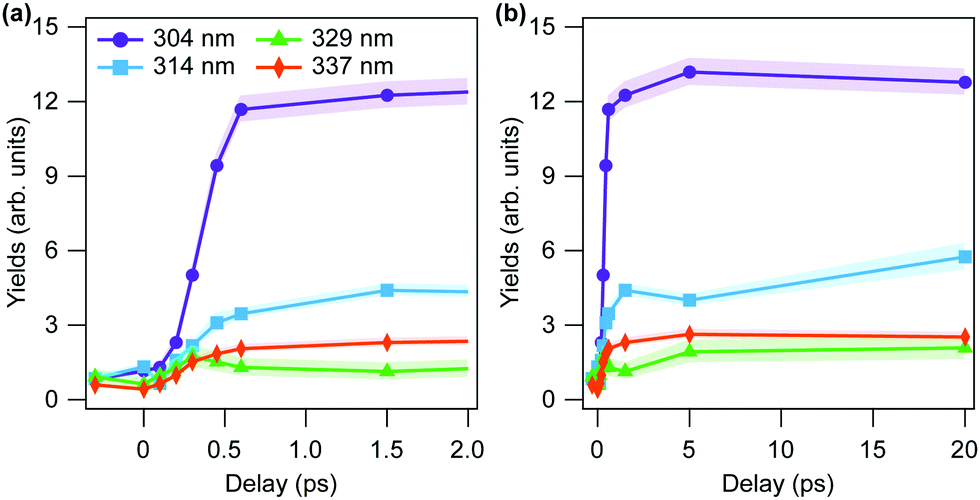 | ||
| Fig. 2 Experimental results of yields of dissociating molecules in (D+, D+, CO+) channel at each wavelength as a function of pump–probe time delay (a) between −0.3 ps to 2 ps and (b) up to 20 ps. Hatched areas denote the statistical errors. | ||
As previously,5 the molecule is excited to the à electronic state, from where it relaxes to the vibrationally hot state. Then, on the ground state PES, the population will undergo dissociation dynamics. This process (and all dynamics subsequent to the pump pulse) are probed via a time-delayed pulse which excites this population to the triply charged electronic state where Coulomb explosion occurs. While we can study the individual steps of population relaxation, propagation and projection onto the triply charged state separately in theory, due to the nature of the experimental design, we will always detect a superposition of signals arising from the combination of pump and probe laser pulses. Correlated fragments of the three-body breakup in the (D+, D+, CO+) channel, originating from a superposition of above mentioned individual steps are our experimental observable. Due to the single molecule sensitivity of CEI, each of these channels can be identified (see our previous work5). In the current work however, we study the overall relaxation and dissociation dynamics of D2CO.
3 Theoretical methods and results
We used high-level simulations to interpret the experimental results, as detailed in the following sections. These include (i) modeling the timescale for nonradiative decay from à to employing different initial conditions for the multi-state dynamics that correspond to the mode excitations associated with different vibronic bands; (ii) computing the nuclear dynamics in the vibrationally hot state with molecular dynamics (MD) trajectory simulations that used micro-canonical ensembles at total energies corresponding to the different pump wavelengths; and (iii) modeling the experimental probe step with an ionizing laser pulse that results in prompt “explosion” of the triply charged ion.
3.1 Electronic relaxation from the à state: quantum dynamics simulations
From previous spectroscopic studies7,12,14–20 it is known that UV pulses in the wavelength range of interest excite formaldehyde to the first excited electronic state Ã. It has been generally accepted that the à → transition requires tens of nanoseconds. This conventional wisdom is based on previously reported lifetime measurements7 and simulations.21 However, these measurements and calculations pertain specifically to high-resolution spectroscopy where the excitation process prepares a small number of energy levels. Previous studies that account for some degree of vibrational mode coupling (assuming a coherent preparation that spans multiple vibrational levels) predict an already significant shortening of the lifetime,22,23 up to an instantaneous population transfer on the order of 1%.24 Because the femtosecond laser pulses used here for excitation intrinsically correlate to a spectral bandwidth of ≈200–300 cm−1 or 0.028–0.038 eV, the resultant wave packet will have a complex vibrational character.
As detailed in the following, we here employ a vibronic coupling model that has been parameterized with anharmonic coupling-terms, which predicts a rate of radiationless ultrafast population transfer1,2 to high-lying vibrational states of on the order of 3% per picosecond at 304 nm.
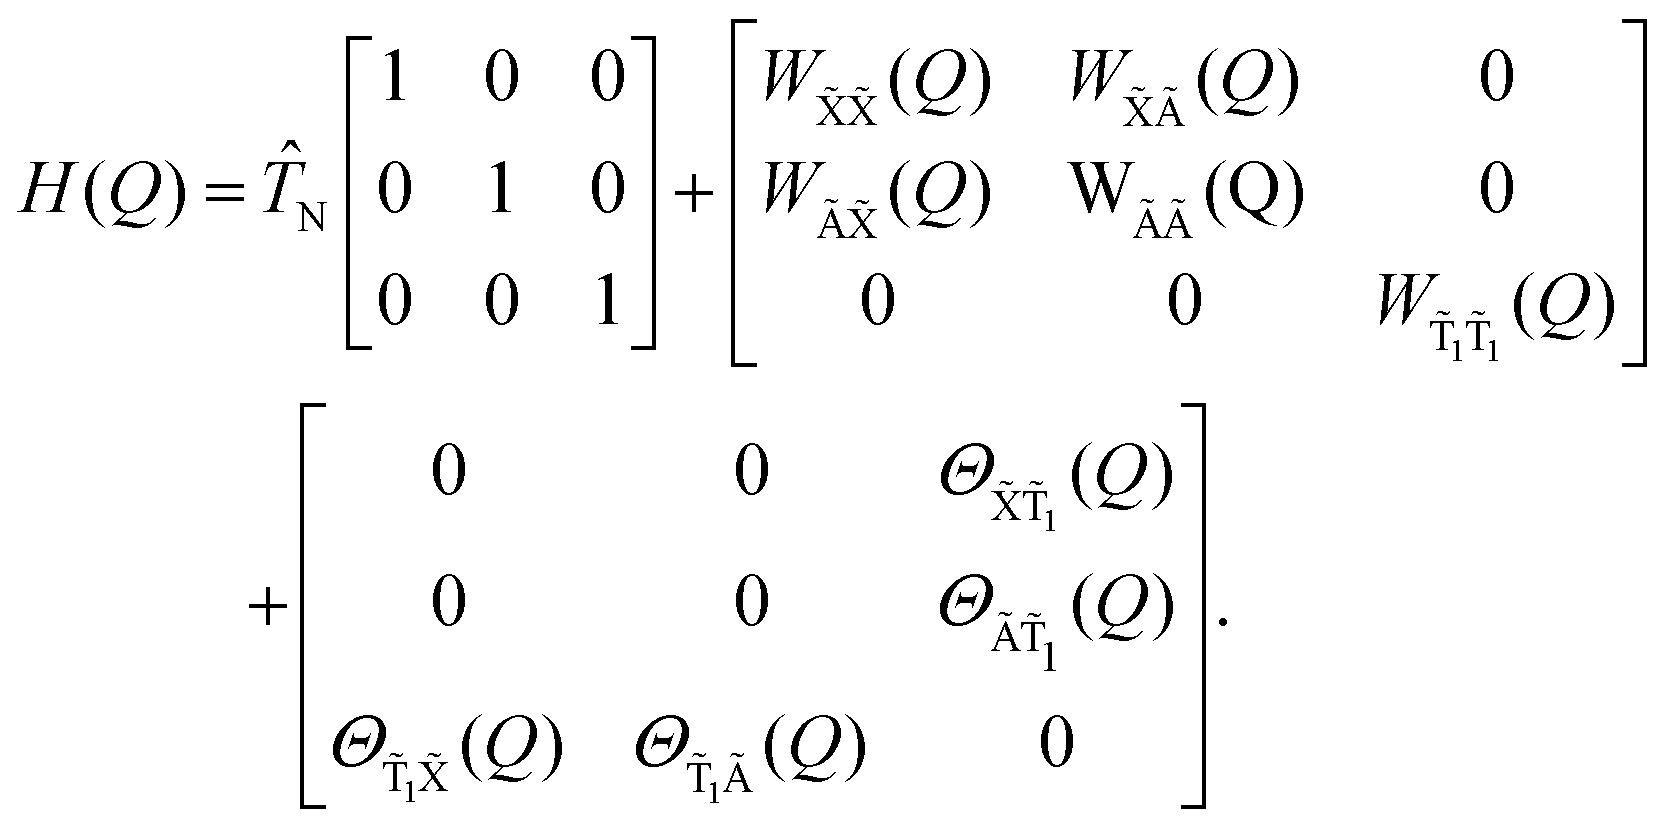
〉 and |Ã〉, and the triplet diabatic state |![[T with combining tilde]](https://www.rsc.org/images/entities/i_char_0054_0303.gif) 1〉. These states were taken to be equal to the S0, S1, and T1 adiabatic states, respectively, at the S1 minimum energy geometry, fixing the global gauge of the adiabatic-to-diabatic transformation. In our treatment of the |1〉 state, the three different projected spin (ms) components were taken to be degenerate, allowing them to be represented by a single effective triplet state.
1〉. These states were taken to be equal to the S0, S1, and T1 adiabatic states, respectively, at the S1 minimum energy geometry, fixing the global gauge of the adiabatic-to-diabatic transformation. In our treatment of the |1〉 state, the three different projected spin (ms) components were taken to be degenerate, allowing them to be represented by a single effective triplet state.
The total Hamiltonian is partitioned as
Ĥ = ![[T with combining circumflex]](https://www.rsc.org/images/entities/i_char_0054_0302.gif) N + Ĥel + ĤSO, N + Ĥel + ĤSO, | (1) |
N is the nuclear kinetic energy operator, Ĥel is the non-relativistic electronic Hamiltonian, and ĤSO accounts for the spin–orbit coupling (SOC) terms (evaluted here using the Douglas–Kroll approximation).
Our model Hamiltonian is expressed in terms of the S1 minimum energy geometry normal modes, {Qα|α = 1,…,3N − 6}, and reads as follows:
 | (2) |
Firstly, we take the elements of the diabatic SOC matrix Θ to be coordinate-independent, and set them to the values computed at the S1 minimum energy geometry reference point. This is deemed to be an acceptable approximation because we are primarily interested in the relative orders of magnitude of the timescales of internal conversion to |〉 and intersystem crossing to |1〉 following excitation to the |Ã〉 state. The required SOC terms were computed at the CASSCF level of theory using the valence triple zeta relativistic atomic natural orbital basis (ANO-RCC-VTZ) basis set and an 8-electron, 8-orbital active space.
Secondly, the elements of the diabatic potential matrix W were approximated using a hybrid 1-mode and quadratic vibronic coupling (QVC) Hamiltonian approach. All parameters were computed at the multi-reference configuration interaction with single and double excitations (MR-CISD) level of theory using a 6-electron, 6-orbital basis set and the cc-pVTZ basis set. The full details of the form of the model potential and it's parameterization are given in the ESI of ref. 5.
absorption spectrum, and thus to validate the model Hamiltonian via comparison to the experimental spectrum. The mode-specific excitation scheme allows us to simulate the excited-state dynamics that ensue following excitation at 337, 329, 314, and 304 nm, which produces excited state wavepackets corresponding to a superposition of a small number of vibronic eigenstates. The full details of the mode-specific excitation scheme are given in ref. 5. That said, the simulation of the dynamics for the 329 nm pump pulse warrants an additional comment. In contrast to the other pump energies, the peak intensity of the pulse for this wavelength is between a pair of vibronic peaks, as opposed to being uniquely assignable to a single transition. Indeed, based on Fig. 1, this pulse would appear to prepare a superposition of the Q22Q14 and Q12Q34 vibronic levels. However, preparing such an initial state is currently not possible using the MCTDH package employed by the authors. Thus, on the basis of pulse parameters evinced in Fig. 1, this pump wavelength was simulated as preparing the Q22Q14 level exclusively, as the overlap is significantly larger for this energy level.
![[X with combining tilde]](https://www.rsc.org/images/entities/b_i_char_0058_0303.gif) absorption spectrum.
In Fig. 1(b) we show the theoretical à ← absorption spectrum, calculated from the Fourier transform of the wavepacket autocorrelation function computed following vertical excitation to the à state. Overall, the calculated and experimental spectra (Fig. 1(a)) are in good qualitative agreement, giving us some confidence in the accuracy of the model Hamiltonian used to describe the excited state dynamics in the vicinity of the à state minimum. In particular, we see the spectrum is characterized by two high intensity progressions corresponding to combination bands of the form Qn2Q14 and Qn2Q34, where Q2 and Q4 are the C–O stretching and out-of-plane bending (or umbrella) modes, respectively. There is an additional progression corresponding to Qn2Q15, where Q5 is the asymmetric CH stretching mode, with peaks at wavelengths 324 nm (Q15) and 311 nm (Q12Q15), that lie below the highest energy pump pulse. This progression is also reproduced in the simulation. However, these transitions have negligible overlap with the pump wavelengths employed in this study.
and 1 state populations calculated for each of these initial states are shown in Fig. 3. The wave packet was propagated for 2 ps for each of the different initial conditions.
absorption spectrum.
In Fig. 1(b) we show the theoretical à ← absorption spectrum, calculated from the Fourier transform of the wavepacket autocorrelation function computed following vertical excitation to the à state. Overall, the calculated and experimental spectra (Fig. 1(a)) are in good qualitative agreement, giving us some confidence in the accuracy of the model Hamiltonian used to describe the excited state dynamics in the vicinity of the à state minimum. In particular, we see the spectrum is characterized by two high intensity progressions corresponding to combination bands of the form Qn2Q14 and Qn2Q34, where Q2 and Q4 are the C–O stretching and out-of-plane bending (or umbrella) modes, respectively. There is an additional progression corresponding to Qn2Q15, where Q5 is the asymmetric CH stretching mode, with peaks at wavelengths 324 nm (Q15) and 311 nm (Q12Q15), that lie below the highest energy pump pulse. This progression is also reproduced in the simulation. However, these transitions have negligible overlap with the pump wavelengths employed in this study.
and 1 state populations calculated for each of these initial states are shown in Fig. 3. The wave packet was propagated for 2 ps for each of the different initial conditions.
| Excitation wavelength (nm) | Initial vibrational state |
|---|---|
| 304 | Q 42 Q 14 |
| 314 | Q 32 Q 14 |
| 329 | Q 22 Q 14 |
| 337 | Q 12 Q 14 |
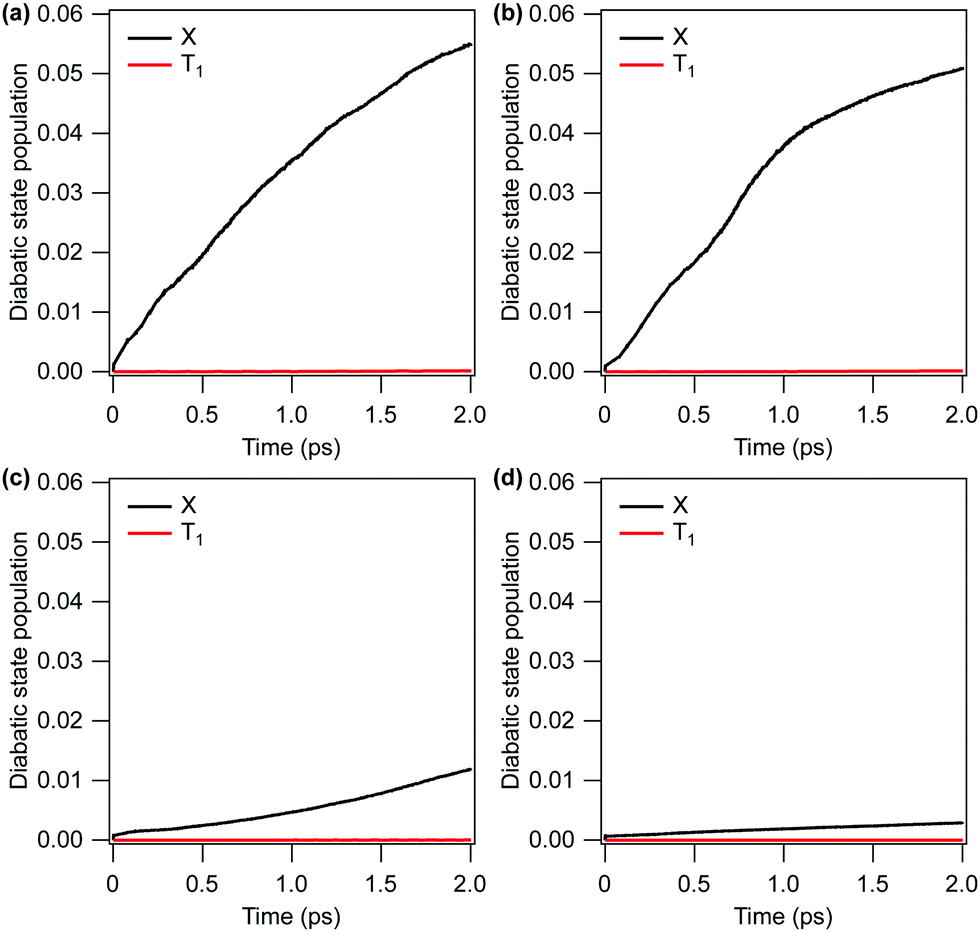 | ||
| Fig. 3
and 1 diabatic state populations within 2 ps calculated following the selective population of the out-of-plane bending (Q4) and C–O stretching (Q2) modes in the à state. (a) Q42Q14 (304 nm), (b) Q32Q14 (314 nm), (c) Q22Q14 (329 nm), (d) Q12Q14 (337 nm). | ||
The rate of internal conversion to the state is predicted to vary significantly with the level of excitation of the C–O stretching mode Q2. With one and two quanta of energy placed into Q2, only 0.3% and 1.2% of the population is transferred to the state after 2 ps, respectively. Increasing the level of excitation of the C–O stretching mode, however, leads to a significant increase in the rate of internal conversion, with three and four quanta of energy being put into this mode leading to 5.1% and 5.5% population transfers after 2 ps, respectively (black lines). Displacements along this mode, as well as the umbrella mode Q4, modulate the energy gap between S1 and S0 which facilitates population transfer to the ground electronic state.
The rate of intersystem crossing to the 1 state is predicted to be extremely low in all cases (red lines). With one and two quanta of energy placed into the C–O stretching mode Q2, the calculated population of the 1 state after 2 ps does not exceed 0.003%. Placing three or four quanta into Q2 increases the final population of the 1 state to 0.014% in both cases. We thus conclude that the early time relaxation dynamics will be dominated by internal conversion to the state.
3.2 Quasi-classical trajectory calculations on the vibrationally excited ![[X with combining tilde]](https://www.rsc.org/images/entities/h3_char_0058_0303.gif) -state and projection onto the D2CO3+ PES
-state and projection onto the D2CO3+ PES
This section corresponds to steps (ii) and (iii) of the simulation procedure. The following energies, including zero-point energy (ZPE) of 4175 cm−1, were studied in these simulations:
(1) 37![[thin space (1/6-em)]](https://www.rsc.org/images/entities/char_2009.gif) 070 cm−1 (corresponding to 304 nm photon energy),
070 cm−1 (corresponding to 304 nm photon energy),
(2) 36022 cm−1 (corresponding to 314 nm photon energy),
(3) 34570 cm−1 (corresponding to 329 nm photon energy),
(4) 33849 cm−1 (corresponding to 337 nm photon energy).
-state trajectory simulations.
The methods used to simulate the dissociation and roaming paths on the hot state were similar to those described elsewhere.25 Established QCT simulations were carried out on the ab initio state PES of D2CO26 which has been shown to produce excellent agreement with experiment.10,25,27
We investigated 1500 trajectories for 337 and 329 nm, 2500 trajectories for 314 nm, and 3000 trajectories for 304 nm, combining the trajectory sets of ref. 5 with new ones to improve statistics. To obtain the correct vibrational energy in the initialization of each trajectory, we assigned random velocities to all four atoms and set the total angular momentum to zero by subtracting the angular velocity contribution. Finally, we re-scaled all velocities to the chosen value of the resulting, now purely vibrational energy. Use of this randomly distributed vibrational energy is equivalent to the assumption that intramolecular vibrational energy transfer following the à → transition occurs rapidly compared to the dissociation time. The new set of calculations resulted in numbers specifying the positions and velocities of the four atoms every integration step (0.1 fs) and these were stored every 60 steps or 6 fs.
state trajectories onto the triply-charged ion state. Although the subsequent separation of the ions was principally controlled by the Coulomb repulsion, it was not sufficiently precise to assume a purely repulsive triply-charged state. We have therefore calculated a realistic D2CO3+ PES, representative of the present CEI experiment, using the CASSCF(7,7) method with GAMESS package and fitted it adopting both energies and gradients, using permutational invariant polynomials. In this simulation, we assumed a delta-function probe pulse instead of the pulse duration of 8 fs. This means that the molecules in the neutral ground state are immediately projected onto the PES of the triply charged state without distorting the molecular geometry by the probe laser pulse. Note that this simplified approximation of a Coulomb explosion process does not consider any possible geometry dependence of the ionization rate.
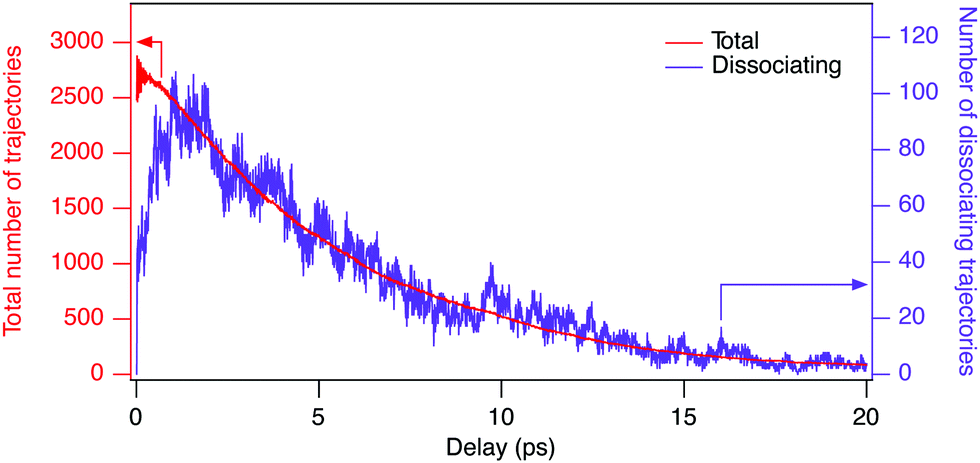 | ||
| Fig. 4 Number of simulated trajectories as a function of pump–probe time delay. Only the trajectories breaking-up into the (D+, D+, CO+) channel when considering the subsequent Coulomb explosion process are counted. Trajectories are simulated on the vibrationally hot ground state at an internal energy corresponding to 304 nm photon energy and subsequently projected onto the D2CO3+ PES. The red curve corresponds to the total number of trajectories, the purple one to the active dissociations at a given time delay. | ||
We consider a trajectory to be dissociating whenever at least one of the deuterons goes beyond a threshold distance of 2.8 Å from the CO fragment5 and to be in equilibrium conditions whenever both deuterons are within the threshold, based on the generalized definition of roaming.
The simulated yields of dissociating molecules are obtained by normalizing the number of dissociating trajectories (purple curve of Fig. 4) with the total number of trajectories (red curve of Fig. 4) at a specific time delay, convoluted with the Gaussian shaped pump pulse with the full width of half maximum of 200, 90, 70, and 90 fs for 304, 314, 329, and 337 nm, respectively. Since the number of trajectories is evaluated including the molecular dynamics on the hot state, as well as the subsequent Coulomb explosion process into the (D+, D+, CO+) channel, the short-term fluctuations in the total number of trajectories are caused by breaking-up into other channels such as (D2+, C+, O+), (D+, DC+, O+), and (D+, C+, DO+). The results for the four different photon energies are shown in Fig. 5, for delays up to 2 ps (a) and 20 ps (b). Due to the low statistics, especially at long time delays, the statistical error is also considered (coloured shadows in Fig. 5). To enable further analysis, we employed a fitting of this data. The number of total and dissociating trajectories in the (D+, D+, CO+) channel were fitted to the following functional forms:
| f(t) = Na0exp(−t/τ0), | (3) |
| g(t) = Na1exp(−t/τ1)[1 − exp(−t/τ2)], | (4) |
state and the subsequent approximated Coulomb explosion process are taken into account. The contribution of the à → relaxation will be considered in the following.
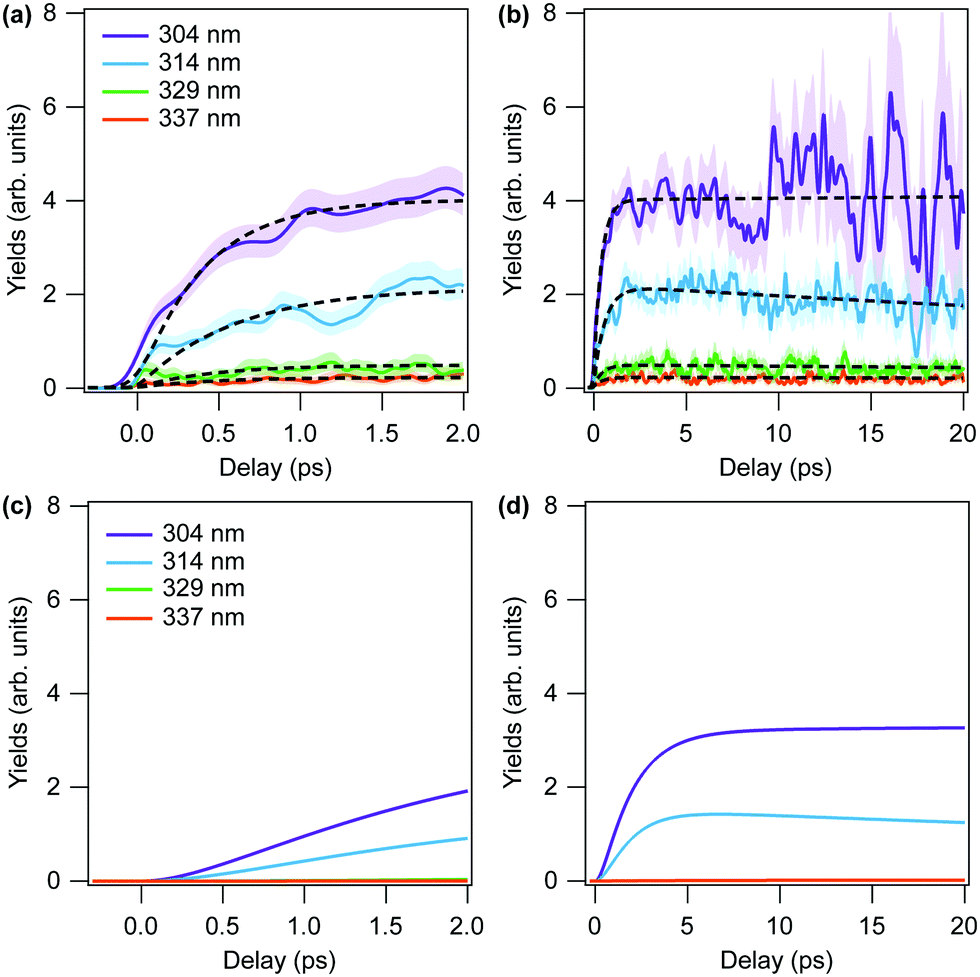 | ||
| Fig. 5 Simulated yields of dissociating molecules in the (D+, D+, CO+) channel at each wavelength as a function of pump–probe time delay (a) up to 2 ps and (b) up to 20 ps. Note that this simulation takes dynamics on the vibrationally hot state into account, but not the precedent à → population transfer. Hatched areas denote the statistical error. The fitting results of h(t) = g(t)/f(t) (eqn (3) and (4)) are shown as black dotted lines. (c and d) Same as (a) and (b), but obtained by convolution of state population (MCTDH simulation result) and the fitting results of h(t). | ||
relaxation dynamics
| Wavelength (nm) | a 0 | τ 0 (ps) | a 1 | τ 1 (ps) | τ 2 (ps) |
|---|---|---|---|---|---|
| 304 | 0.975 | 5.74 | 0.039 | 5.77 | 0.397 |
| 314 | 0.954 | 13.73 | 0.021 | 11.90 | 0.611 |
| 329 | 0.952 | 92.38 | 0.004 | 70.70 | 0.367 |
| 337 | 0.952 | 220.42 | 0.003 | 56.79 | 0.384 |
To arrive at a completely ab initio time-resolved dissociation yield that can be compared directly to the experimental result, the nonadiabatic dynamics simulations that describe the electronic relaxation of the excited à state need to be combined with the ground state classical trajectory computations. In principle, the excited dynamics should inform the classical simulations regarding how the trajectories are “born”; both in time, from the time dependence of the ground state population, and in space via those regions of PES where the ground state component of the wave packet acquires amplitude. The former can be straightforwardly determined from the MCTDH simulation, but the latter cannot. Therefore, in this initial work, we utilize the population dynamics from the MCTDH calculation to inform the final yield computations, but instead use a microcanonical ensemble (determined for each pump wavelength) to generate the initial conditions for the trajectory simulations. To arrive at our final simulated result, we convolute the time-dependent ground state dissociation yields with the instantaneous rates of population transfer to the ground state to arrive at the predicted yield. The results are presented in Fig. 5. In Fig. 5(a and b), we plot the dissociation yields from the trajectory simulations without considering the time-dependence of the ground state population, while panels (c) and (d) show those simulations convoluted with the correpsonding population curves from Fig. 3.
To extrapolate the MCTDH simulation results (Fig. 3) up to 20 ps, the results are fitted with the mono-exponential function. However, a stable fit for 329 nm was found to be difficult to obtain, so this wavelength was excluded from Fig. 5(d). That said, the results from the 329 and 337 nm initial conditions were found to be qualitatively similar.
4 Comparison of experiment and simulation
In the following, we compare the experimental results of Fig. 2 with the theory results of Fig. 5(c and d). We note that the general features of the time-dependent dissociation yields are well reproduced. Both simulation and experiment indicate that the dissociation yields rise and plateau quickly, showing little change in the channel resolved yields after 5 ps. Furthermore, in both simulation and experiment we observe the highest yield of dissociation for the shortest wavelength of 304 nm, followed by 314 nm. The two other photon energies, 329 nm and 337 nm, lead to much smaller yields. The explanation for these observations is readily obtained from the results of the simulations.Firstly, the excited state decay rate is strongly dependant on the excitation wavelength. As the pump wavelength is decreased, the prepared vibronic band corresponds to a combination band with an increasing number of quanta in the C–O stretch mode. As discussed in Section 3.1.4, this mode modulates the energy gap between the S0 and S1 states, which strongly influences the rate of population transfer. As shown in Fig. 3 the quantity of ground state population present after 2 ps when the Q12Q14 band (at 337 nm) is excited, is more than 10 times less than when the Q42Q14 band (at 304 nm) is prepared (0.003 vs. 0.055).
Secondly, once decay to the ground electronic state has occurred, the prevalence of prompt dissociation is dependent on the quantity of internal energy in the system. As shown in Fig. 5(a and b) (which do not include the rate of excited decay on the trajectory dissociation yields), only the two shorter pump wavelengths result in appreciable dissociation on either the 2 ps or 20 ps timescales.
The primary difference between the simulated and experimental results, however, is observed in the “rise time” of the dissociation signal, with the experimental results showing a significantly faster rise time than the simulation. Comparing Fig. 5(c) and 2(a) most clearly evinces this difference, as the experimental results plateau within ∼1 ps, whereas the simulated yields don't plateau until ∼2 ps.
A definitive assignment of this difference is not possible in the present work. However, there are two rather significant limitations to the current simulations that warrant discussion. Firstly, in the simulation of the strong field probe process, in which the trajectories from the vibrationally hot ground state are projected onto the D2CO3+ state, the calculation does not account for the geometry dependence of the ionization rate. The approximation is potentially significant, as the ionization probability of a molecule depends on its geometry at the time instant of ionization, and particularly in the case of bond-lengths elongated to 2–3 times the equilibrium inter-nuclear distance. Previous studies have shown that the ionization rate can increase by up to one order of magnitude in the so-called enhanced ionization regime.28–30 This effect has been already investigated for the stretching of the C–H bond in e.g. acetylene31,32 and is expected to play a role here, too. Since no geometry dependence of ionization is considered in the here presented simulations, we are not surprised to observe that the experimental yield increases significantly faster and stronger than the simulated one, given that roaming occurs at a proton distance of a few Å from the CO fragment, which indeed corresponds to a few times the equilibrium inter-nuclear distance. However, the ab initio modeling of the strong field ionization rates over a highly extended region of coordinate space was beyond our current computational abilities and will thus warrant future study.
Secondly, and of more general interest, the initial conditions for the trajectory simulations are taken from a microcanonical ensemble corresponding to the energies at the various pump wavelengths. However, as discussed in Section 3.1, the rate of electronic relaxation to the ground state is modulated strongly by the displacements along the C–O stretch and umbrella vibrational modes in the S1 state. Thus, the phase-space distribution into which the ground state trajectories are “born” is likely to be a small subspace of the full microcanonical ensemble sampled by the present simulation. Calculating the time-dependent phase space densities that correspond to the instantaneous à → population flux, and its influence on subsequent dissociation dynamics, was not only beyond the scope of the present manuscript but will also require new technical and computational development. However, we believe that this is an avenue worth exploring, as the ability of excited state dynamical processes to “prime” specific reactive outcomes following internal conversion has been considered previously.3,4 The present results suggest that CEI may provide a promising route to imaging these prompt ground state processes.
5 Conclusions and outlook
The results presented here examine the wavelength dependence of non-radiative decay rates from the first excited state of formaldehyde, as well as the subsequent dissociation dynamics on the ground PES. Each of the individual steps of this complex experiment were modelled with first-principles simulation techniques. We find that preparing successive peaks in a vibrational progression in the absorption spectrum results in dramatically different decay rates and dissociation yields. There is broad agreement between the simulations and the experimental results with respect to pump wavelength dependence and the long-time plateau in the dissociation yields measured experimentally. The primary discrepancy between our simulations and the CEI results is in the rise time of the dissociation yields, which we attribute here to an overly severe approximation in the ionization rates and, potentially, to the sampling approach for the ground state trajectories. The ability of CEI to image prompt ground state reactive processes that follow from electronic relaxation make it a potentially powerful approach to investigate the prompt chemical reaction dynamics that follow ultrafast nonradiative decay.Author contributions
T. E. performed all experiments and data analysis. P. L. assisted with CEI experiments in ALLS. F. L. was responsible for the ALLS facility at INRS in Canada. H. F., M. F., and A. H. assisted with the photoelectron experiments and analysis at Nagoya University, Japan. S. P. N. and M. S. S. provided the quantum dynamics simulations. P. L. H. supervised and performed trajectory calculations and analysis. J. M. B. directed the construction of PESs and trajectory code. C. Q. and T. E. calculated the propagation on the D2CO3+ PES. A. H. and F. L. discussed results. H. I. conceived and directed the project, supervised experiments, and analyzed data. M. S. S., T. E., S. P. N., and H. I. wrote the manuscript with assistance from all other authors.Conflicts of interest
There are no conflicts to declare.Acknowledgements
We thank A. Laramée and G. Lebrun for technical support; B. Wales and J. Sanderson for providing the analysis software for the CEI measurement files; Funding: This work was supported by the Canada Foundation for Innovation, NSERC, FRQNT, the JSPS Program for Advancing Strategic International Networks to Accelerate the Circulation of Talented Researchers (grant no. S2602 to T. E. and A. H.), and the World Research Unit (B-1) of Reaction Infography (R-ing) at Nagoya University, Japan (A. H. and F. L.). J. M. B. acknowledges financial support from NASA (grant no. 80NSSC20K0360).Notes and references
- W. Siebrand and D. F. Williams, J. Chem. Phys., 1968, 49, 1860–1871 CrossRef CAS.
- J. Jortner, S. A. Rice and R. M. Hochstrasser, Radiationless Transitions in Photochemistry, 1969 DOI:10.1002/9780470133378.ch3.
- T. S. Kuhlman, T. I. Sølling and K. B. Møller, ChemPhysChem, 2012, 13, 820–827 CrossRef CAS PubMed.
- T. I. Sølling, T. S. Kuhlman, A. B. Stephansen, L. B. Klein and K. B. Møller, ChemPhysChem, 2014, 15, 249–259 CrossRef PubMed.
- T. Endo, S. P. Neville, V. Wanie, S. Beaulieu, C. Qu, J. Deschamps, P. Lassonde, B. E. Schmidt, H. Fujise, M. Fushitani, A. Hishikawa, P. L. Houston, J. M. Bowman, M. S. Schuurman, F. Légaré and H. Ibrahim, Science, 2020, 370, 1072–1077 CrossRef CAS PubMed.
- T. Endo, C. Qu and H. Ibrahim, Phys. Today, 2021, 74, 62–63 CrossRef.
- E. S. Yeung and C. B. Moore, J. Chem. Phys., 1973, 58, 3988–3998 CrossRef CAS.
- D. Townsend, S. a. Lahankar, S. K. Lee, S. D. Chambreau, A. G. Suits, X. Zhang, J. Rheinecker, L. B. Harding and J. M. Bowman, Science, 2004, 306, 1158 CrossRef CAS PubMed.
- A. G. Suits, Annu. Rev. Phys. Chem., 2020, 71, 4 CrossRef PubMed.
- M. S. Quinn, K. Nauta, M. J. T. Jordan, J. M. Bowman, P. L. Houston and S. H. Kable, Science, 2020, 369, 1592–1596 CrossRef CAS PubMed.
- H. Ibrahim, B. Wales, S. Beaulieu, B. E. Schmidt, N. Thiré, E. P. Fowe, E. Bisson, C. T. Hebeisen, V. Wanie, M. Giguére, J.-C. Kieffer, M. Spanner, A. D. Bandrauk, J. Sanderson, M. S. Schuurman and F. Légaré, Nat. Commun., 2014, 5, 4422 CrossRef CAS PubMed.
- A. Gratien, E. Nilsson, J.-F. Doussin, M. S. Johnson, C. J. Nielsen, Y. Stenstrøm and B. Picquet-Varrault, J. Phys. Chem. A, 2007, 111, 11506–11513 CrossRef CAS PubMed.
- C. A. Smith, F. D. Pope, B. Cronin, C. B. Parkes and A. J. Orr-Ewing, J. Phys. Chem. A, 2006, 110, 11645–11653 CrossRef CAS PubMed.
- R. D. McQuigg and J. G. Calvert, J. Am. Chem. Soc., 1969, 91, 1590–1599 CrossRef CAS.
- P. L. Houston and C. B. Moore, J. Chem. Phys., 1976, 65, 757 CrossRef CAS.
- J. C. Weisshaar, A. P. Baronavski, A. Cabello and C. B. Moore, J. Chem. Phys., 1978, 69, 4720–4731 CrossRef CAS.
- J. C. Weisshaar and C. B. Moore, J. Chem. Phys., 1979, 70, 5135–5146 CrossRef CAS.
- D. J. Clouthier and D. A. Ramsay, Annu. Rev. Phys. Chem., 1983, 34, 31–58 CrossRef CAS.
- W. F. Pollik, D. R. Guyer and C. B. Moore, J. Chem. Phys., 1990, 92, 3453–3470 CrossRef.
- W. F. Polik, D. R. Guyer, W. H. Miller and C. B. Moore, J. Chem. Phys., 1990, 92, 3471–3484 CrossRef CAS.
- B. Fu, B. C. Shepler and J. M. Bowman, J. Am. Chem. Soc., 2011, 133, 7957–7968 CrossRef CAS PubMed.
- E. S. Yeung and C. B. Moore, J. Chem. Phys., 1974, 60, 2139–2147 CrossRef CAS.
- R. G. Miller and E. K. C. Lee, J. Chem. Phys., 1978, 68, 4448–4464 CrossRef CAS.
- M. Araujo, B. Lasorne, A. L. Magalhaes, G. A. North, M. J. Bearpark and M. A. Robb, J. Chem. Phys., 2009, 131, 144301 CrossRef PubMed.
- P. L. Houston, R. Conte and J. M. Bowman, J. Phys. Chem. A, 2016, 120, 5103–5114 CrossRef CAS PubMed.
- X. Wang, P. L. Houston and J. M. Bowman, Philos. Trans. R. Soc., A, 2017, 375, 20160194 CrossRef PubMed.
- P. L. Houston, X. Wang, A. Ghosh, J. M. Bowman, M. S. Quinn and S. H. Kable, J. Chem. Phys., 2017, 147, 13936 CrossRef PubMed.
- A. D. Bandrauk and M. L. Sink, J. Chem. Phys., 1981, 74, 1110–1117 CrossRef CAS.
- I. Bocharova, R. Karimi, E. F. Penka, J.-P. Brichta, P. Lassonde, X. Fu, J.-C. Kieffer, A. D. Bandrauk, I. Litvinyuk, J. Sanderson and F. Légaré, Phys. Rev. Lett., 2011, 107, 063201 CrossRef PubMed.
- H. Ibrahim, C. Lefebvre, A. D. Bandrauk, A. Staudte and F. Légaré, J. Phys. B: At., Mol. Opt. Phys., 2018, 51, 042002 CrossRef.
- E. Lötstedt, T. Kato and K. Yamanouchi, Phys. Rev. A: At., Mol., Opt. Phys., 2012, 85, 041402 CrossRef.
- S. Erattupuzha, C. L. Covington, A. Russakoff, E. Lötstedt, S. Larimian, V. Hanus, S. Bubin, M. Koch, S. Gräfe, A. Baltuška, X. Xie, K. Yamanouchi, K. Varga and M. Kitzler, J. Phys. B: At., Mol. Opt. Phys., 2017, 50, 125601 CrossRef.
| This journal is © the Owner Societies 2022 |