Rationalizing the interphase stability of Li|doped-Li7La3Zr2O12via automated reaction screening and machine learning†
Bo
Liu
ab,
Jiong
Yang
 *a,
Hongliang
Yang
bc,
Caichao
Ye
b,
Yuanqing
Mao
b,
Jiping
Wang
b,
Siqi
Shi
 a,
Jihui
Yang
 *d and
Wenqing
Zhang
*b
aMaterials Genome Institute, Shanghai University, Shanghai 200444, China
bDepartment of Physics, Shenzhen Institute for Quantum Science & Technology, Southern University of Science and Technology, Shenzhen, Guangdong 518055, China
cState Key Laboratory of High Performance Ceramics and Superfine Microstructure, Shanghai Institute of Ceramics, Chinese Academy of Sciences, Shanghai 200050, China
dDepartment of Materials Science and Engineering, University of Washington, Seattle, WA 98195, USA. E-mail: jiongy@t.shu.edu.cn; zhangwq@sustc.edu.cn; jihuiy@uw.edu
First published on 16th August 2019
Abstract
Lithium metal batteries are a promising candidate for future high-energy-density energy storage. However, dendrite growth and the high reactivity of the Li metal anode result in low cycling efficiency and severe safety concerns. Here, we present a strategy to stabilize the lithium metal anode through cation doping in Li7La3Zr2O12 (LLZOM, M = dopant). High-throughput automated reaction screening together with a machine learning approach are developed to evaluate possible reactions and the thermodynamic stability of the Li|LLZOM interfaces under various chemical conditions. It is discovered that some dopants, such as M = Sc3+ (doping on Zr site), Ce3+ (La or Zr), Ac3+ (La), Y3+ (La or Zr), Tm3+ (La or Zr), Er3+ (La or Zr), Ho3+ (La or Zr), Dy3+ (La or Zr), Nd3+ (La or Zr), Tb3+ (La or Zr), Pr3+ (La), Pm3+ (La or Zr), Sm3+ (La or Zr), Gd3+ (La or Zr), Lu3+ (La), Ce4+ (Zr), Th4+ (Zr), and Pa5+ (Zr), exhibit thermodynamic stability against Li; while others, M = Ca2+ (La or Zr), Yb3+ (La), Br3+ (Li), Te4+ (Zr), Se4+ (Zr), S4+ (Zr), Hf4+ (Zr), Cl5+ (Zr), and I5+ (Zr), may lead to the spontaneous formation of a stable, passivating solid electrolyte interphase (SEI) layer on the Li metal, and alleviate dendritic lithium growth. From the machine learning approach, the formation energy of oxides MxOy emerges as the most crucial feature dominating the route of interface reactions, implying that the M–O bond strength governs the interface stability of the cation-doped LLZOM. The machine learning model then predicts 18 unexplored LLZOM systems, which are all validated in subsequent calculations. Our work offers practical insights for experimentalists into the selection of appropriate dopants in LLZO to stabilize Li metal anodes in solid-state batteries.
Introduction
Lithium (Li) metal is an ideal anode material for next-generation high-energy- and high-power-density batteries owing to its extremely high theoretical specific capacity (3860 mA h g−1), low density (0.59 g cm−3 at room temperature), and the lowest negative electrochemical potential (−3.040 V vs. H/H+).1–3 Enabling Li metal anode has been regarded as the “Holy Grail” and is confronted by many challenges. Li dendrite formation and propagation, and Li anode pulverization in liquid electrolytes cause poor cycling performance, low coulombic efficiency, and severe safety concerns during battery cycling, which have hampered the practical applications of the Li metal anode over the past decades.4,5 Solid-state electrolytes (SSEs) are a potential solution to these issues inherent to Li metal. Ideal SSE materials should possess high Li+ conductivity (e.g., >10−4 S cm−1 at room temperature), be electrically insulating, have a wide electrochemical window (e.g., >6 V vs. Li+/Li), possess stability against both electrodes and moisture, etc.6 One major challenge in developing solid-state batteries stems from the lack of understanding of electrode–SSEs interfacial stability, specifically the Li metal–SSEs interface.7,8 To prevent the reduction of Li metal, SSEs that are thermodynamically stable or that form stable passivation layers against Li metal are needed. The state-of-the-art SSE materials, including sulfides (Li10GeP2S12 (ref. 9) and Li7P3S11 (ref. 10)), oxynitrides (LiPON11), perovskite (Li0.33La0.56TiO3 (ref. 12)), and NASICON-type (Li1.3Al0.3Ti1.7(PO4)3 (ref. 13) and LiZr2(PO4)3 (ref. 14)), can be reduced to form a solid electrolyte interphase (SEI) layer at the interface once in contact with the Li metal anode. If the SEI layer is electrically insulating, it passivates the SSE materials against further Li reduction, which is critical to achieve good stability.15 Among various SSE materials, the garnet-type Li7La3Zr2O12 (LLZO) has drawn much attention because of its high Li+ conductivity at room temperature (10−3 to 10−4 S cm−1) and reasonable electrochemical stability against Li metal.16–19It has been reported that cation doping in cubic LLZO, such as Nb5+, Ta5+, W6+, or Mo6+ substituting for Zr4+,20–23 as well as Al3+ or Ga3+ for the Li sublattice,24,25 affects the cubic phase stability and increases the ionic conductivity. It was worth noting that the thermodynamic stability of the Li|LLZO interface is also affected by the doped cations. Nemori et al.26 and Kim et al.27 reported that Ta5+-doped LLZO samples are stable in contact with Li, whereas those with Nb5+ are not. Ma et al.28 investigated the reactions at the Li|cubic-Li7−3xAlxLa3Zr2O12 (c-LLZO) interface, which forms a tetragonal-like LLZO interphase with 6 nm thickness, possibly inhibiting further chemical reactions. D. Rettenwander et al.29 reported that Li6.4Fe0.2La3Zr2O12, even with a high total conductivity of 1.1 mS cm−1 at room temperature, is not stable against Li metal and forms a thick tetragonal LLZO interlayer, causing high interfacial resistance. Nakayama et al.18 used density functional theory (DFT) to investigate the electrochemical stability of different garnets with the composition LixLa3M2O12 (x = 5 or 7; M = Ti, Zr, Nb, Ta, Sb, Bi) against Li metal and found that the electrochemical stability is strongly dependent on the effective charge states of the M cations. Moreover, a surface-science-based approach was used to successfully identify the reduction of different dopant species (Nb, Ta, and Al) in LLZO samples by Li metal, suggesting that dopants do indeed play a critical role in determining the reactivity of the Li|LLZO interface.30,31 This leads to the hypothesis that the thermodynamic stability against Li metal of LLZO can be regulated by cation doping, which needs further validation.
So far, there has not been any systematic study on whether the cation doping of LLZO (labeled as LLZOM) improves its stability against Li metal. Owing to the lack of knowledge on the stability and composition-dependent reactions of LLZOM in contact with Li metal, prior studies on screening for appropriate dopants are mostly based on the trial-and-error approach. A predictive model for the thermodynamic stability of cation-doped LLZOM against Li metal is necessary. The present study is motivated by two fundamental questions. First, which cation dopant in LLZO is beneficial to the thermodynamic stability against Li metal? Second, what factors dominate the stability of Li|LLZOM interfaces?
In this paper, by using a first-principles approach based on a large-scale materials database, we build an automated route to screen all possible reactions corresponding to LLZOM in contact with varying amounts of Li, and to calculate the reaction energies (ΔGLLZOM–Li) for the formation of the lowest-energy phases. We also obtain a machine learning model for classifying Li|LLZOM interfaces as thermodynamically stable or unstable with high accuracy. Our results reveal that the thermodynamic stability of LLZOM against Li metal can be improved when the dopant–oxygen bond in LLZOM is strong. By applying our machine learning model, 18 unexplored dopants M in LLZOM systems against Li metal are predicted and further validated in our automated calculations.
Methods
Formation energy calculations
In general, the formation energy for a compound is given by32 | (1) |
Phase stability calculations
The energy above the convex hull (Ehull) of each LLZOM compound was evaluated using pymatgen based on the DFT energies.33 Stable compounds have an Ehull value of 0 eV per atom, and higher values indicate increasing metastability.First-principles calculations
Density functional theory (DFT) calculations were performed within the generalized gradient approximation (GGA) with the Perdew, Burke and Ernzerhof (PBE) exchange–correlation functional,34 using a plane wave basis set and the projector augmented wave (PAW) method35 as implemented in the Vienna Ab initio Simulation Package (VASP) code.36 Energy cutoff for the plane waves was set to be 520 eV. The convergence thresholds for self-consistency and forces were 10−5 eV and 10−2 eV Å−1, respectively. The DFT+U was used to accurately describe the transition metal (Co, Cr, Fe, Mn, Mo, Ni, V, and W) for the strong correlation of d-electrons, and the U values were chosen with reference to the Materials Project (MP) database.33 The energy correction for anions, transition metals, and gas/liquid phase was included in the MP database.33 For pristine LLZO cells, we used an eight formula units conventional supercell, with cubic symmetry group Ia![[3 with combining macron]](https://www.rsc.org/images/entities/char_0033_0304.gif) d. Li was distributed on the partially occupied 24d and 96h sites by using an electrostatic energy criterion that excluded occupation of electrostatically unfavorable first nearest-neighbor sites.37 Before calculating the properties of doped LLZO, we compared the total energies of several pristine LLZO cells containing different distributions of Li ions across the available Li sites. The structure having the lowest total energy from this set of candidates was adopted for subsequent calculations.
d. Li was distributed on the partially occupied 24d and 96h sites by using an electrostatic energy criterion that excluded occupation of electrostatically unfavorable first nearest-neighbor sites.37 Before calculating the properties of doped LLZO, we compared the total energies of several pristine LLZO cells containing different distributions of Li ions across the available Li sites. The structure having the lowest total energy from this set of candidates was adopted for subsequent calculations.
Machine learning method
![[x with combining right harpoon above (vector)]](https://www.rsc.org/images/entities/i_char_0078_20d1.gif) = (f1, f2, f3, …, fn) and a target label y. The label has a value of +1, say, for thermodynamically stable, and −1, for unstable. An SVM aims to find a function that for any given
= (f1, f2, f3, …, fn) and a target label y. The label has a value of +1, say, for thermodynamically stable, and −1, for unstable. An SVM aims to find a function that for any given ![[x with combining right harpoon above (vector)]](https://www.rsc.org/images/entities/i_char_0078_20d1.gif) has a value of ±1. Ideally, it is desired to generate a decision boundary in the space of features that maximizes the distance (also known as margin) of the closest instance of either class from it. Instances are defined as points in the hyperspace of features that lie on one side or the other of this hypersurface. If we represent our input data by the set of label distances {(
has a value of ±1. Ideally, it is desired to generate a decision boundary in the space of features that maximizes the distance (also known as margin) of the closest instance of either class from it. Instances are defined as points in the hyperspace of features that lie on one side or the other of this hypersurface. If we represent our input data by the set of label distances {(![[x with combining right harpoon above (vector)]](https://www.rsc.org/images/entities/i_char_0078_20d1.gif) i,yi)}, then a soft margin support vector classifier determines the hypersurface in the space of features by solving
i,yi)}, then a soft margin support vector classifier determines the hypersurface in the space of features by solving | (2) |
 | (3) |
The kernel κ(![[x with combining right harpoon above (vector)]](https://www.rsc.org/images/entities/i_char_0078_20d1.gif) i,
i,![[x with combining right harpoon above (vector)]](https://www.rsc.org/images/entities/i_char_0078_20d1.gif) j) has linear kernels, polynomial kernels, or Gaussian kernels (radial basis function kernels, RBFs). In this work, however, after testing a number of kernels for their classification accuracies, we chose to go forward with a Gaussian kernel, defined as
j) has linear kernels, polynomial kernels, or Gaussian kernels (radial basis function kernels, RBFs). In this work, however, after testing a number of kernels for their classification accuracies, we chose to go forward with a Gaussian kernel, defined as
κ(![[x with combining right harpoon above (vector)]](https://www.rsc.org/images/entities/i_char_0078_20d1.gif) i, i,![[x with combining right harpoon above (vector)]](https://www.rsc.org/images/entities/i_char_0078_20d1.gif) j) = exp(−γ| j) = exp(−γ|![[x with combining right harpoon above (vector)]](https://www.rsc.org/images/entities/i_char_0078_20d1.gif) i − i − ![[x with combining right harpoon above (vector)]](https://www.rsc.org/images/entities/i_char_0078_20d1.gif) j|2). j|2). | (4) |
 | (5) |
![[x with combining right harpoon above (vector)]](https://www.rsc.org/images/entities/i_char_0078_20d1.gif) i,
i,![[x with combining right harpoon above (vector)]](https://www.rsc.org/images/entities/i_char_0078_20d1.gif) j) has linear kernels, polynomial kernels, Gaussian kernels (RBFs), or Laplacian kernels. In this work, however, after testing a number of kernels for their classification accuracies, we chose to go forward with a Laplacian kernel, defined as
j) has linear kernels, polynomial kernels, Gaussian kernels (RBFs), or Laplacian kernels. In this work, however, after testing a number of kernels for their classification accuracies, we chose to go forward with a Laplacian kernel, defined as | (6) |
The coefficient of determination (R2), employed to evaluate the model accuracy, is defined as
 | (7) |
 | (8) |
Results and discussion
Automated reaction screening for possible interphases
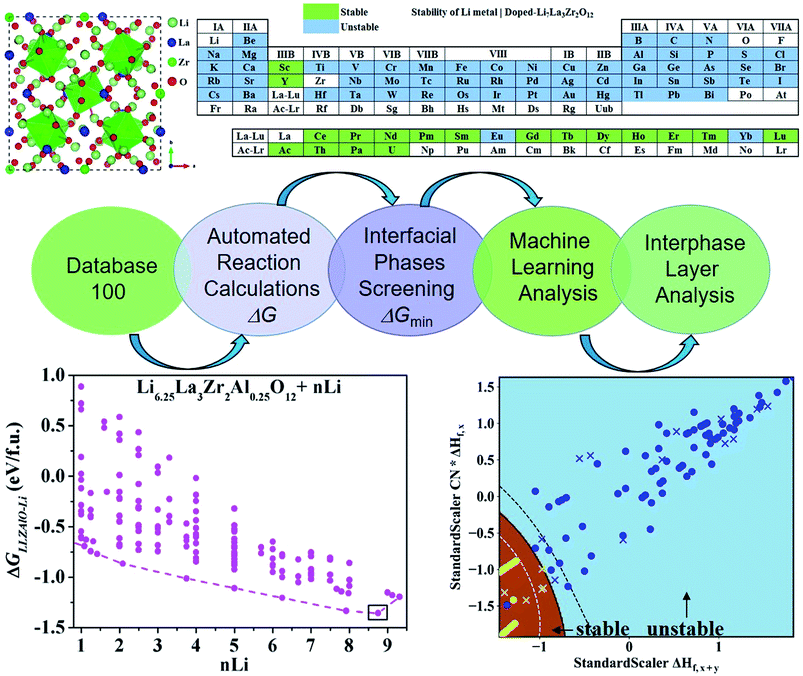
To find the optimal cation doping in LLZO that can be stable against Li metal, we construct a screening workflow as illustrated in Fig. 1. First, a database containing the identities and formation energies of all of the relevant material phases, including the LLZOM phase and the product phases, is created, corresponding to more than 100 LLZOM structures which cover the Li-site, La-site, and Zr-site doping. For all calculations, we employ similar parameters, e.g., the cutoff energy of plane waves, convergence criterion, etc., in order to make all data comparable. The phase stability of the single phase LLZOM can be estimated by determining its Ehull value in the relevant multicomponent phase diagram. As shown in Fig. S1b,† each LLZOM has relatively small energy above the hull, suggesting that it has good phase stability. For each LLZOM reaction with Li metal, all possible product phases, including ternary compounds (Li–O–Zr, Li–O–M, La–Zr–O, La–M–O), binary compounds (Li–O, Zr–O, La–O, M–O, Zr–M), and simple substances (Zr, M) are considered. The structures and formation energies (ΔHf) of the product phases are taken from the Materials Project (MP) database.33 We compare the corresponding ΔHDFTf (ref. 33) and ΔHexpf (ref. 38 and 39) values of some product phases in Fig. S2.† The difference between the ΔHDFTf and ΔHexpf is relatively small, which implies DFT calculations can provide an acceptable level of accuracy in formation energy of product phases. Nevertheless, the reactant LLZOM has no matching entry with formation energies in MP; instead, a convex hull energy of LLZOM is used for reaction energy calculation. Herein, the formation energies of the LLZOM are calculated by DFT directly, which can increase the accuracy of the calculations for Li|LLZOM reactions. The possible reaction equations of LLZOM in contact with Li metal are constructed by an automatic reaction balance procedure. The high-throughput calculation framework used here relies on the availability of accurate formation energies to calculate the reaction energies of the Li|LLZOM interfaces, once the database is compiled.From the large amount of calculated reaction energies data, the reactions with the lowest reaction energies are selected to be the most possible interphase reactions corresponding to the equilibrium product phases. This is a fully automated prediction of the product phases with different reactants. As a result, only the reaction-forming phase with the lowest reaction energy is adopted for further interface stability evaluations. The final thermodynamic stability of a specific Li|LLZOM interface is determined by whether the two materials have an exothermic reaction to form other phases. We calculate the reaction energies of LLZOM with metallic Li by reduction, according to the following equations
| nLi + LLZOM → product phases, | (9) |
| ΔGLLZOM–Li = E [product phases] − E [LLZOM] − nE [Li], | (10) |
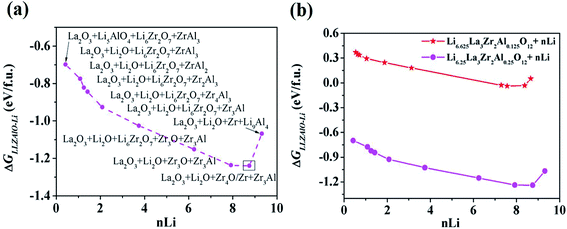
As mentioned above, a successful workflow of the optimal dopant screening, including high-throughput interface reaction calculations and machine learning prediction, has been demonstrated. For the high-throughput automated reaction calculations, using the Al-doped LLZO system as an example in Fig. 1 (bottom panels), only the reactions with the lowest reaction energies (bottom left panel), along the dashed line, represent the most likely decomposition path, i.e. the lithiation reaction of Li7−xLa3Zr2AlxO12 (x = 0.25). Fig. 2a shows that the reaction path starts with the product phases of La2O3, Li5AlO4, Li6Zr2O7, and ZrAl3; and eventually forms La2O3, Li2O, Zr4O, and Zr3Al. The final product phases (La2O3, Li2O, Zr4O, and Zr3Al) have a reaction energy of −1.244 eV per formula unit (f.u.). Fig. 2b shows the reaction energy for different dopant contents (Li7−xLa3Zr2AlxO12 with x = 0.125, 0.25). Overall, the reaction energy increases greatly with decreasing Al concentration, e.g., as Al concentration decreases to 0.125, the reaction energy of the final product phases becomes −0.039 eV per formula unit. The results suggest that the thermodynamic stability of LLZOM against Li metal can be improved by controlling the dopant M contents. Higher M doping concentrations will cause instability of the Li|LLZOM interface (see ESI Fig. S3†).
M–O bond-strength-related interphase stability from data mining
In this section, we try to adopt the data mining technique to reveal the underlying mechanism of interfacial stability. Advanced machine learning methods become more and more important in the field of data mining as they have the potential to solve many complex problems, including prediction of physical properties and crystal structures, and uncover the physical mechanisms using a large amount of data from either high-throughput computation or experiments.43–49 The key steps of data mining for the thermodynamic stability analysis of the Li|LLZOM interfaces are the selection of features (or descriptors) and the choice of model for machine learning algorithms.The site and valence state for possible Li-, La-, and Zr-site dopants in LLZO, after filtering with a defect energy cutoff of 2 eV, are computed by DFT following previous work.50 By applying this filter, the dataset for machine learning can be expanded. The dataset for this study comprises 100 LLZOM compounds, mainly from our own DFT calculations. The reaction data, i.e., the reaction equation and reaction energy for each LLZOM against Li metal, are analyzed using an automatic reaction screening process. The Li|LLZOM interface is labeled ±1, with label +1 for a thermodynamically stable phase and label −1 for a thermodynamically unstable one. Typically, features are properties of a material that can distinguish one compound from others.46,49,51 In our study, since the doping elements are different in LLZOM, we consider many relevant properties of the doping element as the features. Fifteen features for each LLZOM compound are selected for the machine learning procedure. They are: (i) valence states (VS) of dopant element M; (ii) ionic radius (riM) and atomic radius (rcM) of element M from Shannon's work,52 adopting the values under the same coordination number (CN) in LLZOM; (iii) atomic mass (AM) of element M; (iv) Pauling electronegativity (χM) of element M; (v) first ionization energy (1stIEM) of element M; (vi) the formation energy per atom defined as ΔHf,x+y = ΔHf/(x + y), where ΔHf is the heat for formation of the formula MxOy, the experimental formation energies from the SGTE Solid SUBstance (SSUB) database39 and the thermodynamic database at the Thermal Processing Technology Center at the Illinois Institute of Technology (IIT),38 and calculation formation energies from the MP database (see Table S3†). The majority of the calculated ΔHf values are consistent with the measured data within ±0.2 eV per atom, with a few exceptions. (vii) Oxygen coordination number (CN) of dopant element M in LLZO; (viii) product of coordination number CN with the formation energy of oxide MxOy per M atom (CN × ΔHf,x), and product of coordination number CN with the formation energy of oxide MxOy per oxygen atom (CN × ΔHf,y), where ΔHf,x = ΔHf/x and ΔHf,y = ΔHf/y. The parameters CN × ΔHf,x and CN × ΔHf,y can be possibly viewed as the effective measurement of local interaction strength with dopant M in LLZO. (ix) Ratio of M ionic radius to O ionic radius, denoted as riM/riO; (x) electron configurations of s + p, d and f orbitals of dopant element M; and (xi) bond dissociation energies (BDE) of M–O from the Handbook of Chemical Bond Energies (see Table S4†).53 The random forest classifier in scikit-learn package54 is adopted to measure the importance of the features by calculating their weights. As shown in Fig. 3, the formation energy (ΔHf,x+y) plays the most important role in determining the thermodynamic stability of LLZOM against Li, followed by the local interaction of M (CN × ΔHf,x, CN × ΔHf,y), the electronegativity (χM), and M–O bond dissociation energies (BDE). Pearson correlation coefficient (P) matrices are also calculated to identify the positive and negative correlations between pairs of features in Fig. S4.†
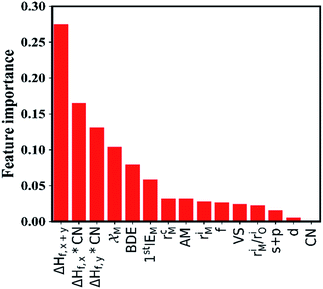 | ||
| Fig. 3 The importance of the selected features. The 15 selected features are ranked using a random forest algorithm. | ||
In our work, we adopt the machine learning technique in two different ways: (i) as a binary classification problem, where the machine should simple predict if the Li|LLZOM interface is thermodynamically stable (label 1) or not (label −1), and (ii) as a regression problem, where the machine predicts the reaction energy for the Li|LLZOM interface. In both situations, we adopt the machine learning model with best performance.48 For example, five different classification algorithms, including logistic regression, support vector machine (SVM), decision tree, extra tree, and neural network, are adopted. Each classification algorithm is fitted using the training data with two, three, four, or even more features at a time. The SVM with Gaussian kernel algorithm is found to be the most effective model based on the five-fold cross-validation results, and the performance of the top five feature pairs is summarized in ESI Table S5.† The best feature pair is (ΔHf,x+y, CN × ΔHf,x), with both accuracy and F1 score of 0.99(±0.02) for the test set. It is worth noting that all the five top-performing feature pairs contain ΔHf,x+y. Going beyond two features does not improve the model performance, so we use our best performing model (SVM) with two features for subsequent analyses and predictions.
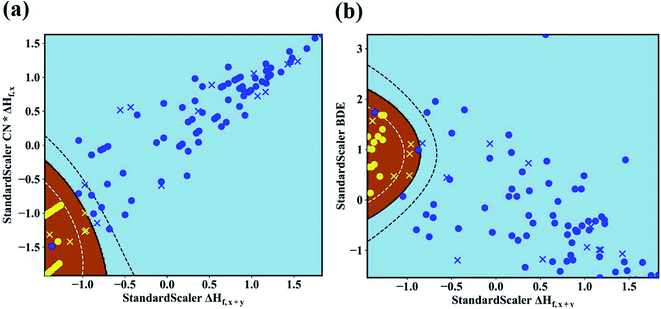
The maps of the best feature pairs, i.e., (ΔHf,x+y, CN × ΔHf,x) and (ΔHf,x+y, BDE), are shown in Fig. 4a and b, with yellow circles indicating thermodynamically stable (ΔGLLZOM–Li > 0) and blue ones unstable (ΔGLLZOM–Li < 0). Besides the 100 training data points, predictions were made for 18 unexplored compounds, labeled as crosses in Fig. 4. It is clear that compounds that are stable and unstable at Li|LLZOM interfaces are well separated by the black solid lines, which divide the (ΔHf,x+y, CN × ΔHf,x) and (ΔHf,x+y, BDE) maps into two regions with only a few exceptions. We observe that the 18 predicted data points (yellow crosses and blue crosses) are perfectly predicted by the training model, falling within the respective stable and unstable regions established by the training data. The (ΔHf,x+y, CN × ΔHf,y) and (ΔHf,x+y, χM) classification maps are also plotted in Fig. S5.† From the chemical bond point of view, since the selected features, such as ΔHf and BDE, can be viewed as indicators of the M–O bond strength, based on our machine learning procedures it can be qualitatively concluded that the Li|LLZOM interface stability could be mainly measured by the local M–O chemical bond strength.
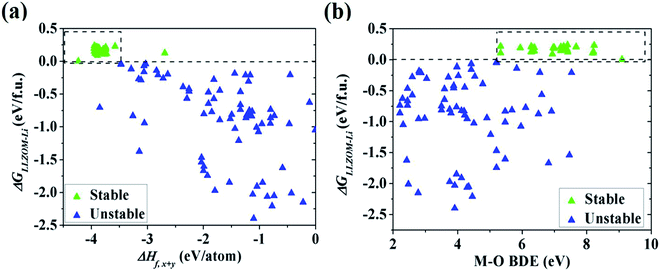
To quantitatively understand the Li|LLZOM interfacial thermodynamic stability, the reaction energies ΔGLLZOM–Li and single feature (ΔHf,x+y, BDE) relations are plotted in Fig. 5. We observe that oxides MxOy with larger negative formation energies (|ΔHf,x+y| > 3.5 eV) give rise to more thermodynamically stable Li|LLZOM interfaces, and the M–O BDE directly reflects the local chemical bond strength of the initial LLZOM structure stability, shown in Fig. 5a and b, respectively. The greater the BDE, the more heat needs to be absorbed to disrupt the M–O bond in LLOZM during the chemical reactions. Similarly, it is clear that the majority of stable Li|LLZOM interfaces have a large negative CN × ΔHf,y value, corresponding to the local chemical bond strength. In terms of the Pauling electronegativity χM, the appropriate range for Li|LLZOM interface stability is between 1.0 and 1.5 with only a few exceptions, as shown in ESI Fig. S6.† Therefore, we conclude that the thermodynamic stability of the Li|LLZOM interface relates to the stronger ionic bonding nature of M–O in LLZOM, which is in agreement with the report by Nakayama.18
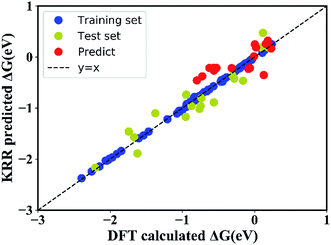
In order to quantitatively obtain a prediction model for reaction energy ΔG, the KRR algorithm (with the best performance among five algorithms, see Table S8†) was employed. The model is based on the training data (80% of the full dataset), and is used to evaluate the test data. A plot of 100 LLZOM ΔG values predicted using KRR versus the DFT calculated values is presented in Fig. 6. The results clearly show good agreement between the DFT values and KRR predictions, with the R2 and MSE of the test data as 0.92 and 0.04, respectively. Then, the trained KRR model is applied to the unexplored 18 LLZOM to predict their ΔG values, and the prediction results are listed in Table S6.† We notice that the predicted 18 ΔG values are in excellent correlation with the relevant feature statistics (|ΔHf,x+y| > 3.5 eV; 1.0 < χM < 1.5). More importantly, the reaction energies of the 18 LLZOM systems are calculated by the automated reaction calculations, confirming the prediction model. Therefore, combining machine learning technology and high-throughput automated reaction calculations, we have developed an extremely fast target-driven method to predict the reaction energies for the Li|LLZOM interface systems. This workflow can be readily applied to other solid electrolyte materials.
Beneficial effects of the interphase layer
Based on the automated reaction screening of the interfacial phases, an LLZOM that is unstable against Li metal would generate an interphase layer, similar to the formation of a solid electrolyte interphase (SEI) layer, as shown in Fig. 7. In fact, the interphase layer formed by the reactions also has the attribute of improving the stability of the interface, depending on the electrical conductivity of the product phases.55 If the product phases are electrically insulating, they will form a passivated interface layer that promotes interfacial contacts and reduces the interfacial impedance.56,57 In addition, the passivating interphase layer can prevent LLZOM from further reaction and suppress Li dendrite growth during cycling.15,58 For example, some elements, M = Ca2+ (La or Zr), Yb3+ (La), Br3+ (Li), Te4+ (Zr), Se4+ (Zr), S4+ (Zr), Hf4+ (Zr), Cl5+ (Zr), and I5+ (Zr), when in equilibrium with Li metal, typically decompose into products that are electrically insulating with bandgaps >2.0 eV (bandgap data from MP,33 see Table S7†), e.g., CaO, YbO, LiBr, La2TeO2, La2SeO2, La2SO2, Li6Hf2O7, LiCl, and LaIO. For LLZOs with other dopants, the undesired high electrical conductivities of the interphase layers may cause continuous decomposition of the LLZOM materials, and a passivating interphase cannot be achieved at the interface.59 In previous work, the non-passivating behavior of the interphase was confirmed, the interphase layers and the resistance increasing markedly in a short period of time.9 Therefore, the electrical conductivity of the interphase layer is also a crucial factor in determining the interfacial stability of LLZOM against Li metal anode.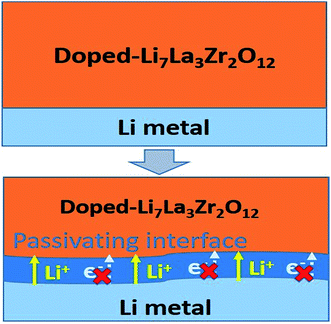 | ||
| Fig. 7 Improvement of Li|LLZOM (M = dopants) interfacial stability via the formation of a passivating interface layer. | ||
Conclusions
In this work, we have developed a high-throughput automated reaction screening and machine learning approach to evaluate possible reactions and the thermodynamic stability of Li|LLZOM interfaces under various chemical conditions. Our calculations reveal that LLZOM stability against Li metal is governed by the dopants. We discover that M = Sc3+ (Zr), Ce3+ (Zr or La), Ac3+ (La), Y3+ (La or Zr), Tm3+ (La or Zr), Er3+ (La or Zr), Ho3+ (La or Zr), Dy3+ (La or Zr), Nd3+ (La or Zr), Tb3+ (La or Zr), Pr3+ (La), Pm3+ (La or Zr), Sm3+ (La or Zr), Gd3+ (La or Zr), Lu3+ (La), Ce4+ (Zr), Th4+ (Zr), Pa5+ (Zr), Ca2+ (La or Zr), Yb3+ (La), Br3+ (Li), Te4+ (Zr), Se4+ (Zr), S4+ (Zr), Hf4+ (Zr), Cl5+ (Zr), and I5+ (Zr) exhibit stability against Li metal, either because the interface is thermodynamically stable or as a result of stable passivation. However, LLZOMs with other dopant cations are likely reduced by Li metal, while passivating interphases cannot be achieved at the interface. On the basis of a large amount of data, we have attempted to find the underlying physical mechanisms of the thermodynamic stability of Li|LLZOM interfaces by employing a machine learning technique. Based on our analysis, the stability of the Li|LLZOM interface is determined by the M–O chemical bond strength. Our results provide a guiding principle for selecting cation doping in LLZO to provide stability against Li metal, and show the potential for the fast screening of new LLZOM materials by the machine learning approach.Conflicts of interest
The authors declare that there are no conflicts of interest.Acknowledgements
This work was supported by the National Key Research and Development Program of China (No. 2017YFB0701600), the Natural Science Foundation of China (Grant Nos. 51572167, 51632005, 51622207, and U1630134), and the 111 project D16002. Jihui Yang acknowledges support from the Inamori Foundation. W. Q. Zhang acknowledges the support Program of Shanghai Subject Chief Scientist (16XD1401100), Guangdong Innovation Team Project (Grant No. 2017ZT07C062), and the Shenzhen Pengcheng-Scholarship Program.References
- W. Xu, J. Wang, F. Ding, X. Chen, E. Nasybulin, Y. Zhang and J.-G. Zhang, Energy Environ. Sci., 2014, 7, 513–537 RSC.
- D. Lin, Y. Liu and Y. Cui, Nat. Nanotechnol., 2017, 12, 194 CrossRef CAS PubMed.
- B. Liu, J.-G. Zhang and W. Xu, Joule, 2018, 2, 833–845 CrossRef CAS.
- X.-B. Cheng, R. Zhang, C.-Z. Zhao and Q. Zhang, Chem. Rev., 2017, 117, 10403–10473 CrossRef CAS PubMed.
- X. Q. Zhang, X. B. Cheng and Q. Zhang, Adv. Mater. Interfaces, 2018, 5, 1701097 CrossRef.
- H. Duan, H. Zheng, Y. Zhou, B. Xu and H. Liu, Solid State Ionics, 2018, 318, 45–53 CrossRef CAS.
- F. Han, J. Yue, C. Chen, N. Zhao, X. Fan, Z. Ma, T. Gao, F. Wang, X. Guo and C. Wang, Joule, 2018, 2, 497–508 CrossRef CAS.
- A. Wang, S. Kadam, H. Li, S. Shi and Y. Qi, npj Comput. Mater., 2018, 4, 15 CrossRef.
- S. Wenzel, S. Randau, T. Leichtweiß, D. A. Weber, J. Sann, W. G. Zeier and J. Janek, Chem. Mater., 2016, 28, 2400–2407 CrossRef CAS.
- S. Wenzel, D. A. Weber, T. Leichtweiss, M. R. Busche, J. Sann and J. Janek, Solid State Ionics, 2016, 286, 24–33 CrossRef CAS.
- A. Schwöbel, R. Hausbrand and W. Jaegermann, Solid State Ionics, 2015, 273, 51–54 CrossRef.
- S. Stramare, V. Thangadurai and W. Weppner, Chem. Mater., 2003, 15, 3974–3990 CrossRef CAS.
- H. Aono, E. Sugimoto, Y. Sadaoka, N. Imanaka and G. y. Adachi, J. Electrochem. Soc., 1990, 137, 1023–1027 CrossRef CAS.
- Y. Li, W. Zhou, X. Chen, X. Lü, Z. Cui, S. Xin, L. Xue, Q. Jia and J. B. Goodenough, Proc. Natl. Acad. Sci. U. S. A., 2016, 113, 13313–13317 CrossRef CAS PubMed.
- B. Wu, S. Wang, J. Lochala, D. Desrochers, B. Liu, W. Zhang, J. Yang and J. Xiao, Energy Environ. Sci., 2018, 11, 1803–1810 RSC.
- M. Ramaswamy, T. Venkataraman and W. Werner, Angew. Chem., Int. Ed., 2007, 46, 7778–7781 CrossRef PubMed.
- M. Kotobuki, H. Munakata, K. Kanamura, Y. Sato and T. Yoshida, J. Electrochem. Soc., 2010, 157, A1076–A1079 CrossRef CAS.
- M. Nakayama, M. Kotobuki, H. Munakata, M. Nogami and K. Kanamura, Phys. Chem. Chem. Phys., 2012, 14, 10008–10014 RSC.
- T. Thompson, S. Yu, L. Williams, R. D. Schmidt, R. Garcia-Mendez, J. Wolfenstine, J. L. Allen, E. Kioupakis, D. J. Siegel and J. Sakamoto, ACS Energy Lett., 2017, 2, 462–468 CrossRef CAS.
- S. Ohta, T. Kobayashi and T. Asaoka, J. Power Sources, 2011, 196, 3342–3345 CrossRef CAS.
- H. Buschmann, S. Berendts, B. Mogwitz and J. Janek, J. Power Sources, 2012, 206, 236–244 CrossRef CAS.
- P. Bottke, D. Rettenwander, W. Schmidt, G. Amthauer and M. Wilkening, Chem. Mater., 2015, 27, 6571–6582 CrossRef CAS.
- Y. Li, Z. Wang, Y. Cao, F. Du, C. Chen, Z. Cui and X. Guo, Electrochim. Acta, 2015, 180, 37–42 CrossRef CAS.
- J. Wolfenstine, J. Ratchford, E. Rangasamy, J. Sakamoto and J. L. Allen, Mater. Chem. Phys., 2012, 134, 571–575 CrossRef CAS.
- D. Rettenwander, P. Blaha, R. Laskowski, K. Schwarz, P. Bottke, M. Wilkening, C. A. Geiger and G. Amthauer, Chem. Mater., 2014, 26, 2617–2623 CrossRef CAS PubMed.
- H. Nemori, Y. Matsuda, S. Mitsuoka, M. Matsui, O. Yamamoto, Y. Takeda and N. Imanishi, Solid State Ionics, 2015, 282, 7–12 CrossRef CAS.
- Y. Kim, A. Yoo, R. D. Schmidt, A. Sharafi, H. Lee, J. Wolfenstine and J. Sakamoto, Front. Energy Res., 2016, 4, 1–7 CrossRef.
- C. Ma, Y. Cheng, K. Yin, J. Luo, A. Sharafi, J. Sakamoto, J. Li, K. L. More, N. J. Dudney and M. Chi, Nano Lett., 2016, 16, 7030–7036 CrossRef CAS PubMed.
- D. Rettenwander, R. Wagner, A. Reyer, M. Bonta, L. Cheng, M. M. Doeff, A. Limbeck, M. Wilkening and G. Amthauer, J. Phys. Chem. C, 2018, 122, 3780–3785 CrossRef CAS PubMed.
- J. G. Connell, Y. Zhu, P. Zapol, S. Tepavcevic, A. Sharafi, J. Sakamoto, L. A. Curtiss, D. D. Fong, J. W. Freeland and N. M. Markovic, ACS Appl. Mater. Interfaces, 2018, 10, 17471–17479 CrossRef CAS PubMed.
- Y. Zhu, J. G. Connell, S. Tepavcevic, P. Zapol, R. Garcia-Mendez, N. J. Taylor, J. Sakamoto, B. J. Ingram, L. A. Curtiss, J. W. Freeland, D. D. Fong and N. M. Markovic, Adv. Energy Mater., 2019, 9, 1803440 CrossRef.
- S. Kirklin, J. E. Saal, B. Meredig, A. Thompson, J. W. Doak, M. Aykol, S. Rühl and C. Wolverton, npj Comput. Mater., 2015, 1, 15010 CrossRef CAS.
- S. P. Ong, W. D. Richards, A. Jain, G. Hautier, M. Kocher, S. Cholia, D. Gunter, V. L. Chevrier, K. A. Persson and G. Ceder, Comput. Mater. Sci., 2013, 68, 314–319 CrossRef CAS.
- K. B. John, P. Perdew and M. Ernzerhof, Phys. Rev. Lett., 1996, 77, 3865–3868 CrossRef PubMed.
- G. Kresse, Phys. Rev. B, 1999, 59, 1758–1775 CrossRef CAS.
- G. Kresse, Phys. Rev. B, 1996, 54, 11169–11186 CrossRef CAS PubMed.
- P. P. Ewald, Ann. Phys., 1921, 369, 253–287 CrossRef.
- P. Nash, https://tptc.iit.edu/index.php/thermo-database, 2013.
- L. f. T. Hüttenkunde and R.-W. T. H. Aachen, Thermodynamic Properties of Inorganic Materials, Landolt-Börnstein, New Series, 1999, vol. 19 Search PubMed.
- B. He and S. Shi, Screening platform for solid electrolyte, Shanghai University, 2018, http://https://www.bmaterials.cn Search PubMed.
- R. Xiao, H. Li and L. Chen, Sci. Rep., 2015, 5, 14227 CrossRef CAS PubMed.
- L. Pan, L. Zhang, A. Ye, S. Chi, Z. Zou, B. He, L. Chen, Q. Zhao, D. Wang and S. Shi, J. Materiomics, 2019 DOI:10.1016/j.jmat.2019.04.010.
- G. Pilania, P. V. Balachandran, C. Kim and T. Lookman, Front. Mater., 2016, 3, 1–7 Search PubMed.
- S. Shi, J. Gao, Y. Liu, Y. Zhao, Q. Wu, W. Ju, C. Ouyang and R. Xiao, Chin. Phys. B, 2016, 25(1), 018212 CrossRef.
- Y. Liu, T. Zhao, W. Ju and S. Shi, J. Materiomics, 2017, 3, 159–177 CrossRef.
- J. Schmidt, J. Shi, P. Borlido, L. Chen, S. Botti and M. A. L. Marques, Chem. Mater., 2017, 29, 5090–5103 CrossRef CAS.
- Y. Wang, W. Zhang, L. Chen, S. Shi and J. Liu, Sci. Technol. Adv. Mater., 2017, 18, 134–146 CrossRef CAS PubMed.
- W. Li, R. Jacobs and D. Morgan, Comput. Mater. Sci., 2018, 150, 454–463 CrossRef CAS.
- S. Lu, Q. Zhou, Y. Ouyang, Y. Guo, Q. Li and J. Wang, Nat. Commun., 2018, 9, 3405 CrossRef PubMed.
- L. J. Miara, W. D. Richards, Y. E. Wang and G. Ceder, Chem. Mater., 2015, 27, 4040–4047 CrossRef CAS.
- A. O. Oliynyk, E. Antono, T. D. Sparks, L. Ghadbeigi, M. W. Gaultois, B. Meredig and A. Mar, Chem. Mater., 2016, 28, 7324–7331 CrossRef CAS.
- R. Shannon, Acta Crystallogr., Sect. A: Cryst. Phys., Diffr., Theor. Gen. Crystallogr., 1976, 32, 751–767 CrossRef.
- Y. R. Luo, Comprehensive Handbook of Chemical Bond Energies, CRC Press, Boca Raton, FL, 2007 Search PubMed.
- F. Pedregosa, G. Varoquaux, A. Gramfort, V. Michel, B. Thirion, O. Grisel, M. Blondel, P. Prettenhofer, R. Weiss, V. Dubourg, J. Vanderplas, A. Passos, D. Cournapeau, M. Brucher, M. Perrot and E. Duchesnay, J. Mach. Learn. Res., 2011, 12, 2825–2830 Search PubMed.
- Y. Shen, Y. Zhang, S. Han, J. Wang, Z. Peng and L. Chen, Joule, 2018, 2, 1674–1689 CrossRef CAS.
- X. Han, Y. Gong, K. Fu, X. He, G. T. Hitz, J. Dai, A. Pearse, B. Liu, H. Wang, G. Rubloff, Y. Mo, V. Thangadurai, E. D. Wachsman and L. Hu, Nat. Mater., 2016, 16, 572 CrossRef PubMed.
- K. Fu, Y. Gong, B. Liu, Y. Zhu, S. Xu, Y. Yao, W. Luo, C. Wang, S. D. Lacey, J. Dai, Y. Chen, Y. Mo, E. Wachsman and L. Hu, Sci. Adv., 2017, 3, e1601659 CrossRef PubMed.
- Z. Zhang, L. Zhang, Y. Liu, H. Wang, C. Yu, H. Zeng, L.-m. Wang and B. Xu, ChemSusChem, 2018, 11, 3774–3782 CrossRef CAS PubMed.
- Y. Z. Zhu, X. F. He and Y. F. Mo, Adv. Sci., 2017, 4, 1600517 CrossRef PubMed.
Footnote |
| † Electronic supplementary information (ESI) available. See DOI: 10.1039/c9ta06748e |
| This journal is © The Royal Society of Chemistry 2019 |

