
Elucidating the special role of strong metal–support interactions in Pt/MnO2 catalysts for total toluene oxidation†
Shengpeng
Mo
 a,
Qi
Zhang
a,
Mingyuan
Zhang
a,
Qian
Zhang
a,
Jiaqi
Li
a,
Mingli
Fu
abc,
Junliang
Wu
abc,
Peirong
Chen
abc and
Daiqi
Ye
*abc
a,
Qi
Zhang
a,
Mingyuan
Zhang
a,
Qian
Zhang
a,
Jiaqi
Li
a,
Mingli
Fu
abc,
Junliang
Wu
abc,
Peirong
Chen
abc and
Daiqi
Ye
*abc
aSchool of Environment and Energy, South China University of Technology, Guangzhou 510006, China. E-mail: cedqye@scut.edu.cn
bNational Engineering Laboratory for VOCs Pollution Control Technology and Equipment, Guangzhou Higher Education Mega Centre, Guangzhou 510006, P. R. China
cGuangdong Provincial Key Laboratory of Atmospheric Environment and Pollution Control (SCUT), Guangzhou Higher Education Mega Centre, Guangzhou 510006, P. R. China
First published on 9th July 2019
Abstract
With the aim to elucidate the role of strong metal–support interactions (SMSIs) in total toluene deep oxidation, herein, we prepared a series of Pt/MnO2 catalysts with different MnO2 crystal structures (α-, β-, γ- and hollow-MnO2); it was found that the structures and catalytic behaviors of the MnO2 crystals decorated by Pt nanoparticles (NPs) changed dramatically, especially the mobility of surface adsorbed oxygen and lattice oxygen. Among all these catalysts, the as-synthesized Pt/α-MnO2 exhibited best catalytic activity for total toluene oxidation (T90 = 170 °C). TGA, high-temperature XRD (HT-XRD) and quasi in situ XPS were applied to estimate the reconfiguration of gaseous oxygen on the surface of MnO2-based catalysts. A series of characterization results indicate that the SMSIs between the Pt NPs and MnO2 result in improved low-temperature reducibility, optimized surface chemical states, and the weakening of surface lattice oxygen species (Mn–O bands). The in situ DRIFTS study showed that the lattice oxygen could be involved in the activation of toluene without oxygen, whereas the presence of gas-phase oxygen was essential for the deep oxidation of toluene into CO2 and H2O on the surface of MnO2-based catalysts.
New conceptsThe utilization of strong metal–support interactions (SMSIs) between precious metals and metal oxide supports is a promising approach to improve the catalytic property and durability of catalysts, and the formation of SMSIs can significantly alter the natural properties of the catalysts. However, the special role of SMSIs in catalytic VOC deep oxidation remains unclear. If the SMSIs of the functional catalysts could be optimized by tuning the crystal structures of the transition-metal oxide supports, novel structures with SMSIs would be endowed with prominent performances in catalytic reactions. Based on this new concept, the present study provides scientific insights into the significant effect of SMSIs in the Pt/MnO2 catalysts on the surface oxygen species. The biggest contribution of Pt/MnO2 SMSIs is the weakening of surface Mn–O bonds and the improved mobility of the surface lattice oxygen. We speculate that the toluene oxidation simultaneously follows the Langmuir–Hinshelwood (L–H) mechanism and the Mars–van Krevelen (MvK) mechanism on the surface of the MnO2-based catalysts. The results provide a deep understanding of the positive effects of SMSI on the natural structures of the catalysts. |
Introduction
In recent years, the concentration of volatile organic compounds (VOCs), including ethyl acetate, formaldehyde, benzene and toluene, has been steadily increasing in the environment due to the continuous emissions of these VOCs; this is harmful to air quality and the human health.1,2 To date, catalytic oxidation has been considered as a highly efficient technology to eliminate the VOCs.3 Supported platinum (Pt) catalysts have been widely studied in the field of heterogeneous catalysis due to their outstanding activity for VOC degradation.4–6 It has been revealed that control over the particle size of Pt nanoparticles (NPs) can influence the structure–property relationships of supported Pt catalysts. Consequently, a significant number of studies have been devoted towards the development of uniform ultra-small Pt NPs or single-atom catalysts;6–9 on the other hand, it has been disclosed that the surface interface, that is, the so-called strong metal–support interaction (SMSI) in supported metal catalysts, would significantly alter the activity and stability of the catalysts.10–13 In 1978, SMSI was first observed by Tauster et al.,14 and since then, the SMSIs have attracted extensive attentions because of their positive effects. It has been established that the generation of SMSIs usually requires the metal NPs and supporting materials to lead to partial encapsulation during thermal treatment;13 the SMSIs can hinder the growth of small metal nanoparticle crystals, promoting the bonding structures and electron transfers between the metals and the supports.13To date, various kinds of promising approaches have been introduced for the utilization of the SMSIs of supported metal catalysts; however, the structural characteristics of supporting materials are occasionally overlooked. Moreover, only a limited number of studies have been reported on the tailoring of the SMSIs of supported metal catalysts via modification of the crystal structures of transition-metal oxide supports.15,16 Generally, transition-metal oxide supports can crucially influence the overall oxygen utilization of catalysts as well as the electronic and chemical states of precious metal NPs. Thus, tailoring of the natural structure/morphology of oxide supports would provide an efficient strategy for the manipulation of SMSIs. Among transition-metal oxide catalysts, MnO2 catalysts with five phase structures (α-, β-, γ-, δ-, and ε-MnO2) have been applied in different catalytic applications,17–21 such as in the VOC oxidation, CO oxidation, ozone decomposition and NOx SCR, mainly owing to their special physico-chemical properties. To achieve optimal performance of MnO2, various novel structures including nanotubes, nanorods, nanoflowers, nanospheres and hollow microspheres have been consecutively reported.22–24 To the best of our knowledge, only a few studies have been reported on Pt/MnO2 systems, especially on the elucidation of the natural structures of Pt/MnO2; moreover, the promotional roles of their SMSIs in the catalytic deep oxidation of VOCs have been rarely investigated, which may have an important significance in the development of novel catalysts with remarkable performance.
In this study, we successfully reported the construction of Pt/MnO2 SMSIs by tuning the crystal structures of different MnO2 catalysts (α-, β-, γ- and hollow-MnO2) with the aim to systemically investigate the special role of SMSIs in toluene oxidation. Moreover, the relationship between the Pt/MnO2 SMSIs and the catalytic performances for toluene oxidation was identified by the ex situ characterization techniques, including XRD, SEM, TEM, H2-TPR, O2-TPD, TGA, XPS, and high-temperature XRD (HT-XRD), as well as quasi in situ XPS. The in situ DRIFTS results provided evidences for the elucidation of the reaction mechanism of toluene deep oxidation.
Results and discussions
The size of the as-prepared Pt NPs was examined by transmission electron microscopy (TEM), as shown in Fig. 1a–d. It can be clearly observed that the as-prepared Pt NPs are monodisperse, and the average diameter is mainly distributed in the range of around 3.5 nm, as shown in Fig. 1d. In addition, the lattice fringe of the Pt NPs is 0.23 nm, corresponding to the (111) plane of the Pt NPs. The SEM images of the as-prepared carbon spheres with a smooth surface are shown in Fig. 1e and f, revealing that a monodisperse spherical shape with a diameter of around 1.0 μm has been successfully achieved by the hydrothermal treatment of the glucose solution. The carbon spheres were mainly used as templates to prepare the hollow γ-MnO2 structure.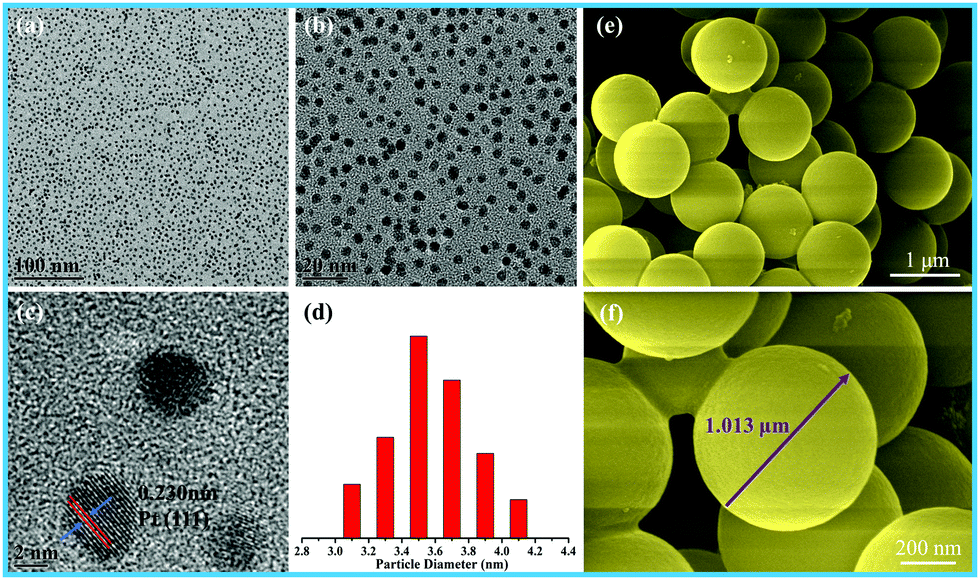 | ||
| Fig. 1 (a) Low-, (b) medium-, and (c) high-magnification TEM images, and (d) particle-size distribution images of Pt nanoparticles; (e and f) SEM images of the carbon spheres. | ||
X-ray diffraction (XRD) was used to investigate the crystal structures of the as-obtained MnO2 products, as shown in Fig. S1 (ESI†). All the diffraction peaks could be perfectly ascribed to α-MnO2 (JCPDS 44-0141), β-MnO2 (JCPDS 24-0735) and γ-MnO2 (JCPDS 42-1316). The XRD pattern of hollow MnO2 (H-MnO2) is in good agreement with that of γ-MnO2 (JCPDS 42-1316). In addition, α-MnO2 and β-MnO2 possess high crystallinities according to their high-intensity and narrow characteristic peaks; in contrast, γ-MnO2 and H-MnO2 display low-intensity XRD patterns. Compared with that of the γ-MnO2 sample, the XRD pattern of the H-MnO2 sample indicates that its crystallinity is relatively lower, and more exposed planes can be detected. Lower crystallinity will be beneficial to the formation of more lattice defects that would enhance the surface oxygen vacancies and catalytic activities of the catalysts; this has been further confirmed by the following characterizations.
Fig. 2 shows the SEM images, schematics and crystal structures of different MnO2 samples. As shown in Fig. 2e and f, the γ-MnO2 product possesses a uniform sphere-like morphology with the average diameter of about 1.5 μm. The sphere-like morphology was composed by the aggregation of cubic-shaped MnO2; the hollow γ-MnO2 (H-MnO2) sample was further synthesized by the NH4HCO3 co-precipitation method using a carbon sphere as the template. For the H-MnO2 sample, the SEM images (as shown in Fig. 2a and b) reveal that there are similar sphere-like nanostructures assembled from cubes; however, a hollow spherical structure of MnO2 is formed. α-MnO2 shows uniform nanorods, and typically, an individual nanorod is about 600–800 nm long and about 40 nm wide, as shown in Fig. 2i and g. It can be clearly observed that β-MnO2 possesses a pompon-like morphology, which is composed of tetragonal nanorods with the width of 20 nm (Fig. 2m and n).
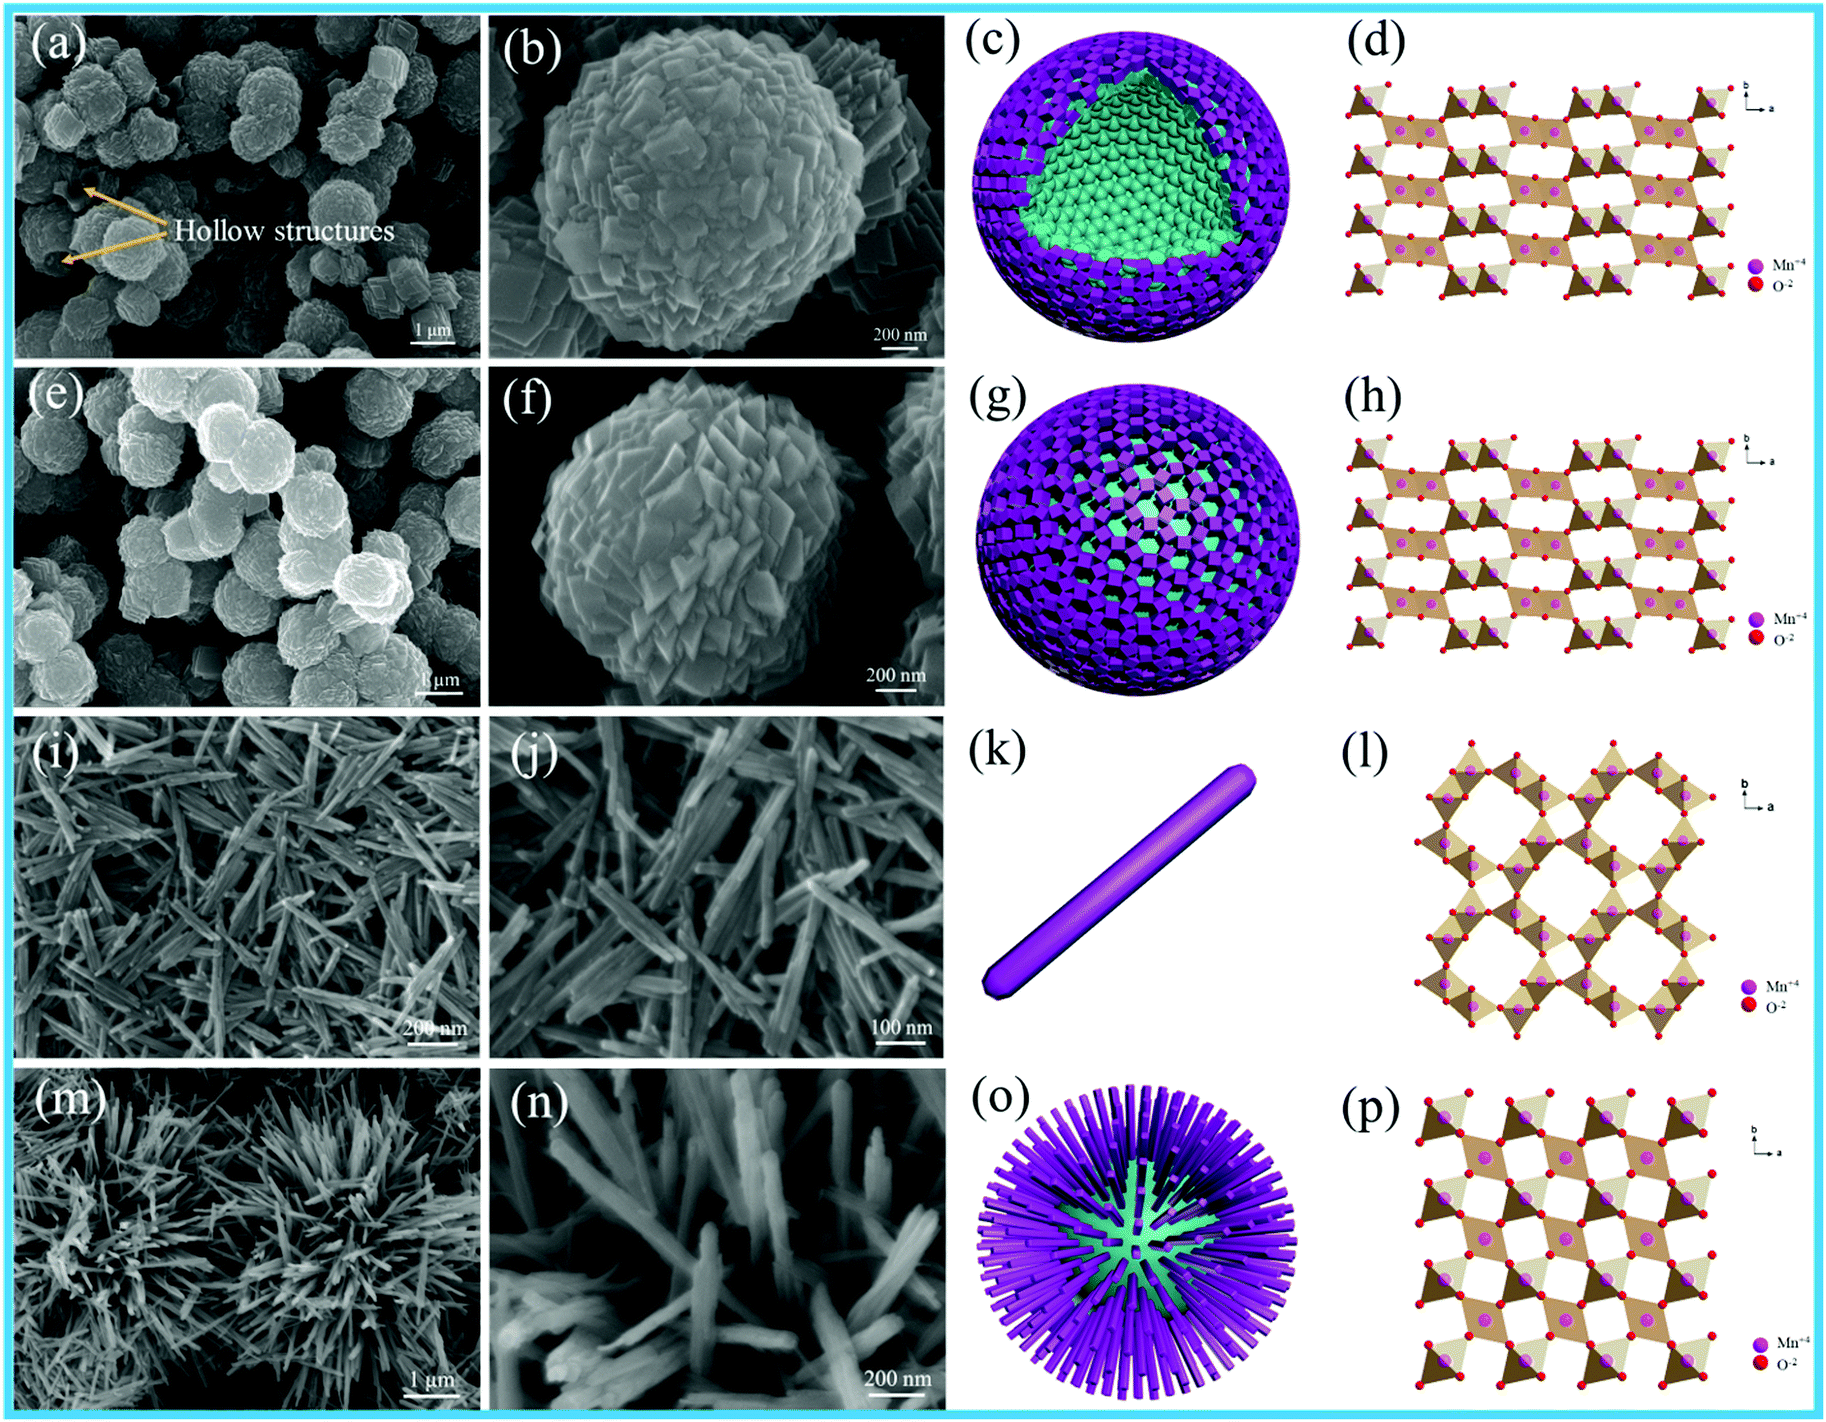 | ||
| Fig. 2 SEM images of different MnO2 samples: (a and b) H-MnO2, (e and f) γ-MnO2, (i and j) α-MnO2, and (m and n) β-MnO2; (c, g, k and o) schematics and (d, h, l and p) crystal structures of H-MnO2, γ-MnO2, α-MnO2 and β-MnO2, respectively. | ||
Fig. 3 shows the TEM images of different MnO2 samples after the loading of Pt NPs. It can be observed that numerous Pt NPs are anchored on the surface of different MnO2 samples, and the interplanar spacing of 0.230 nm is in accordance with the (111) plane of the Pt NPs in these samples. The as-fabricated Pt/H-MnO2 sample presents hollow spheres with the diameter of about 1.5 μm and the wall thickness of 0.25 μm; the rough surface of the cubic-shaped MnO2 consists of many small crystalline particles, and embedded pores can be observed, as shown in Fig. 3a and b. Fig. 3c reveals that the lattice fringes of about 0.479 nm and 0.24 nm can be well indexed to the (200) and (400) planes of γ-MnO2, respectively. In Fig. 3d and e, it can be observed that Pt/γ-MnO2 also has a uniform sphere-like morphology, which is formed by the interconnected cubic structures, and the average diameter is about 1.6 μm. The intraplanar spacing (as shown in Fig. 3f) is approximately 0.240 nm, which is attributed to the (400) plane of γ-MnO2. In addition, Fig. 3g shows that Pt/α-MnO2 displays nanorod structures with the length of about 600–900 nm, which is identical to the morphology of the α-MnO2 support. The interplanar spacing was measured to be about 0.24 nm, assigned to the (211) crystal plane of the α-MnO2 phase, as shown in Fig. 3i. In Fig. 3j, it can be obviously observed that Pt/β-MnO2 exhibits intersected tetragonal nanorods, and the average width of the nanorods is about 20 nm. The lattice fringe with the intraplanar distance of 0.310 nm can be ascribed to the (110) plane of the β-MnO2 crystal structure, as shown in Fig. 3l. Moreover, it can be observed that the upper surfaces of the Pt NPs in Pt/α-MnO2 and Pt/β-MnO2 form partial encapsulation due to the migration of the MnO2 layer; this confirms the generation of forceful SMSIs (as shown in Fig. 3i and l, respectively).
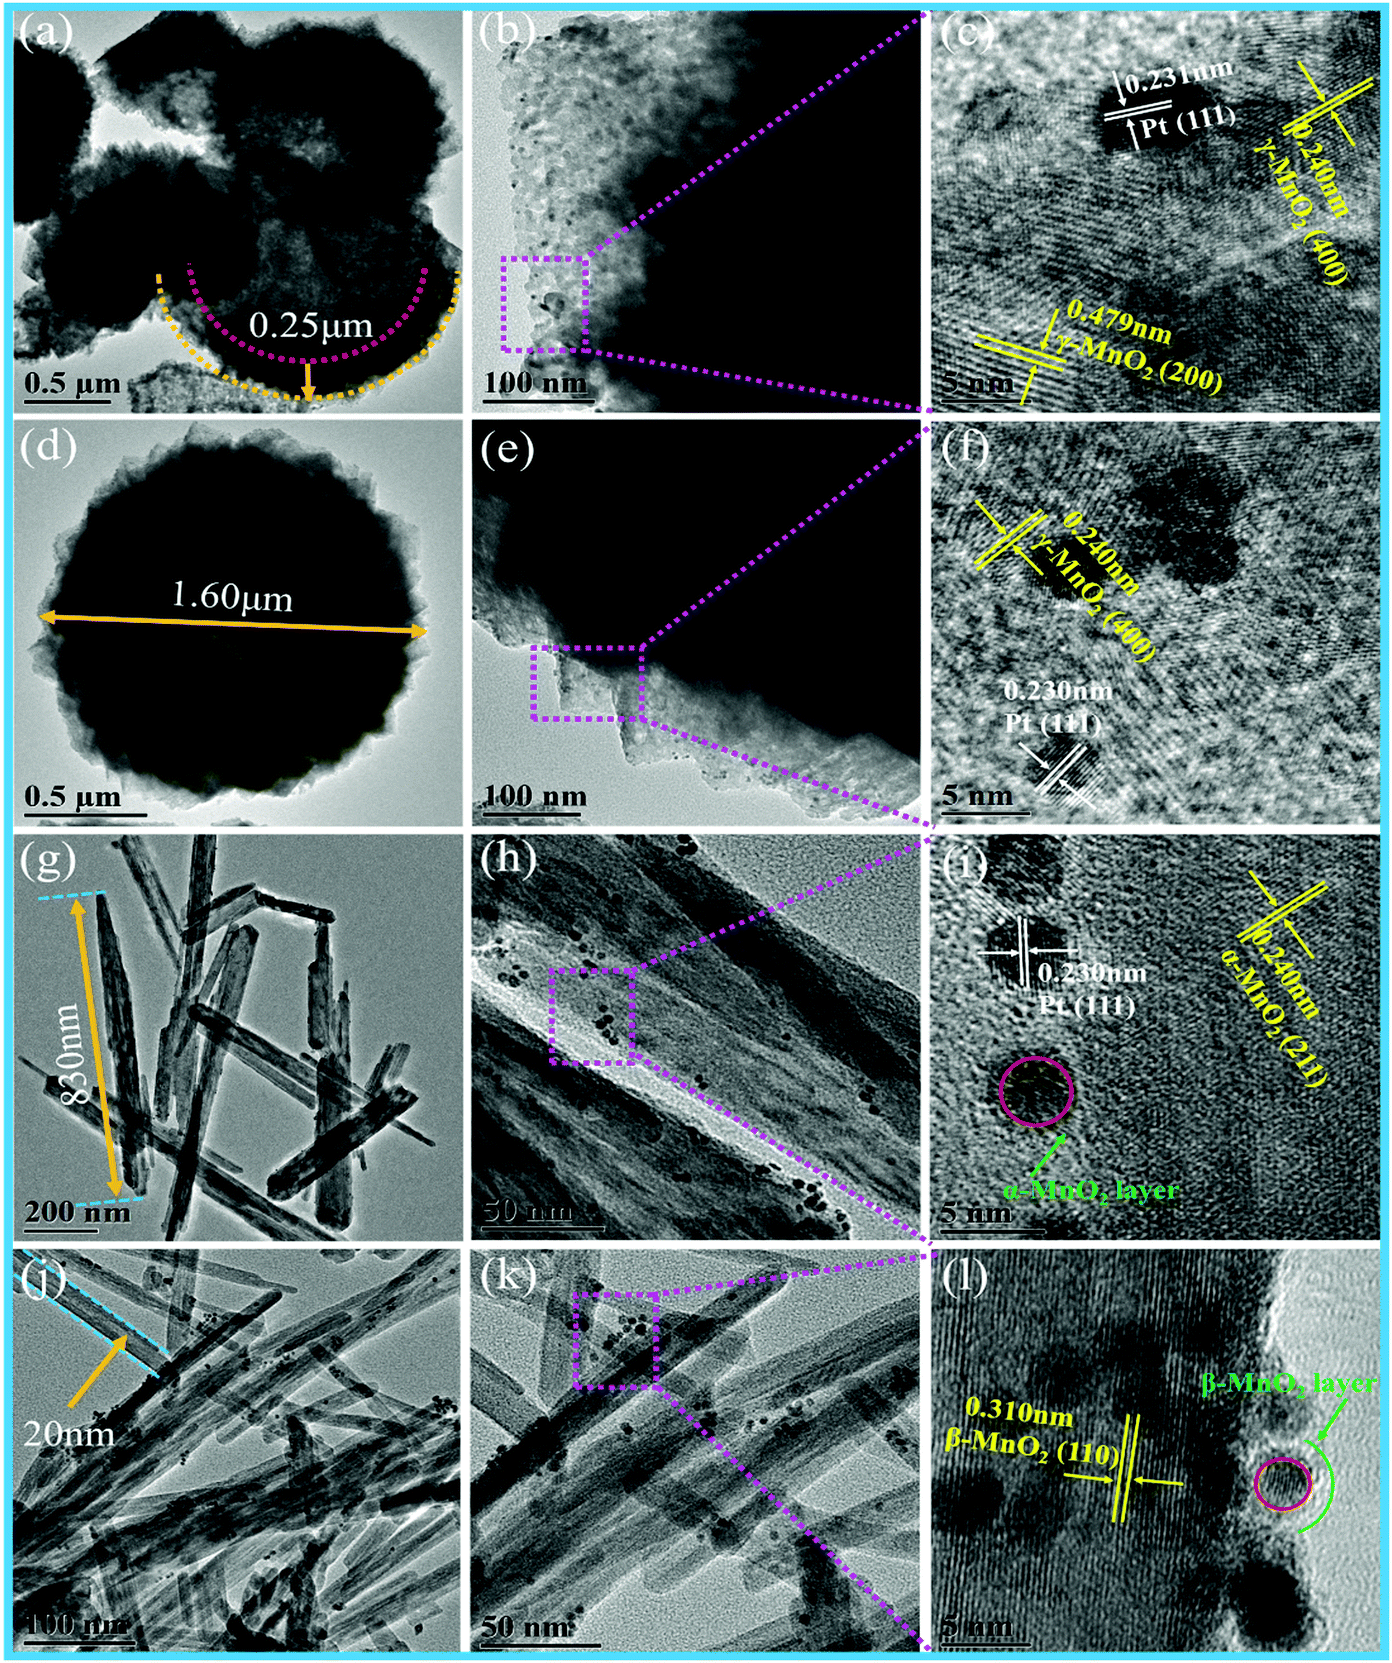 | ||
| Fig. 3 TEM images of different Pt/MnO2 samples: (a–c) Pt/H-MnO2, (d–f) Pt/γ-MnO2, (g–i) Pt/α-MnO2 and (j–l) Pt/β-MnO2. | ||
The complete oxidation of toluene over different MnO2 and Pt/MnO2 catalysts was estimated at the continuous flow rate of 100 mL min−1 and the weight hourly space velocity (WHSV) of 60![[thin space (1/6-em)]](https://www.rsc.org/images/entities/char_2009.gif) 000 mL g−1 h−1, as shown in Fig. 4a and b. T10, T50 and T90 corresponding to the temperatures needed for 10%, 50% and 90% toluene conversion are summarized in Table 1 and Fig. S2 (ESI†). As shown in Fig. 4a, the toluene conversion increases with an increase in temperature, and the H-MnO2 catalyst has highest activity for toluene oxidation among all the MnO2 structures, achieving T10, T50 and T90 at 205, 223, and 230 °C, respectively. The β-MnO2 catalyst presents a relatively poor activity for toluene oxidation, and T50 and T90 obtained using it are 27 and 45 °C, higher than those found in the case of the H-MnO2 catalyst, respectively. The order of T90 for toluene conversion with these MnO2 catalysts is H-MnO2 > γ-MnO2 > α-MnO2 > β-MnO2.
000 mL g−1 h−1, as shown in Fig. 4a and b. T10, T50 and T90 corresponding to the temperatures needed for 10%, 50% and 90% toluene conversion are summarized in Table 1 and Fig. S2 (ESI†). As shown in Fig. 4a, the toluene conversion increases with an increase in temperature, and the H-MnO2 catalyst has highest activity for toluene oxidation among all the MnO2 structures, achieving T10, T50 and T90 at 205, 223, and 230 °C, respectively. The β-MnO2 catalyst presents a relatively poor activity for toluene oxidation, and T50 and T90 obtained using it are 27 and 45 °C, higher than those found in the case of the H-MnO2 catalyst, respectively. The order of T90 for toluene conversion with these MnO2 catalysts is H-MnO2 > γ-MnO2 > α-MnO2 > β-MnO2.
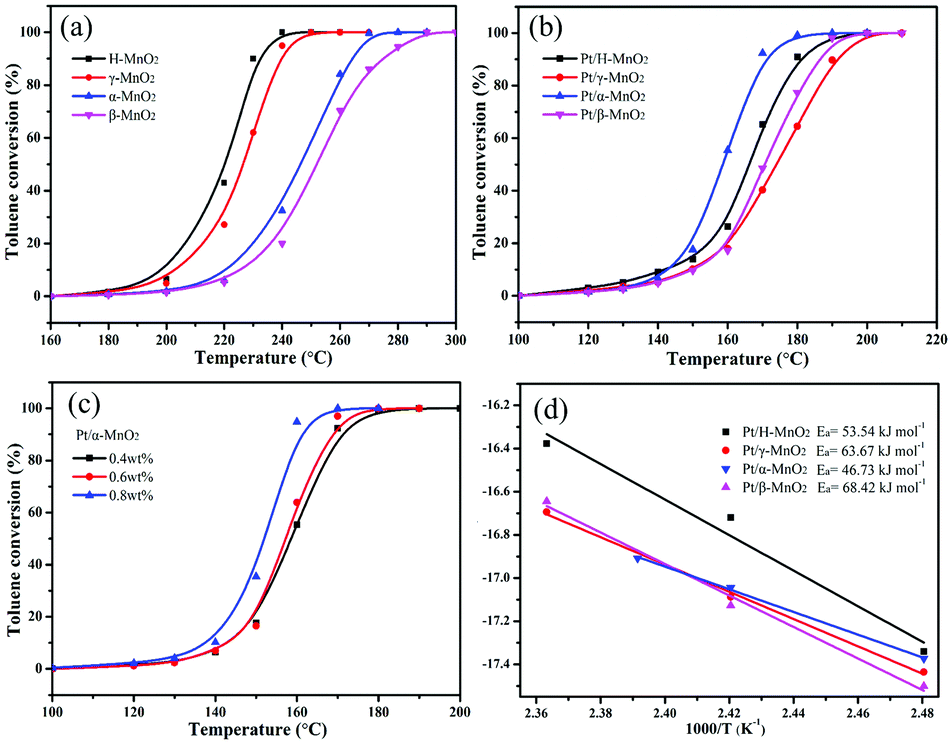 | ||
| Fig. 4 Toluene conversion over different (a) MnO2 and (b) Pt/MnO2 samples, (c) Pt/α-MnO2 with different Pt loadings, and (d) Arrhenius plots for toluene oxidation over different MnO2 and Pt/MnO2 samples. Toluene concentration was 1000 ppm balanced air, and all the reactions were kept at WHSV = 60000 mL g−1 h−1. | ||
| Sample | Pt loading (wt%)ICP | S BET (m2 g−1) | V pore (cm3 g−1) | Pore diameter (nm) | Mn4+/Mn3+ | Oads/Ototal | Pt0/Pttotal | T 10 (°C) | T 50 (°C) | T 90 (°C) |
|---|---|---|---|---|---|---|---|---|---|---|
| H-MnO2 | — | 75.4 | 0.25 | 11.5 | 5.87 | 0.349 | — | 205 | 223 | 230 |
| γ-MnO2 | — | 88.0 | 0.20 | 7.8 | 5.81 | 0.291 | — | 210 | 227 | 238 |
| α-MnO2 | — | 97.6 | 0.35 | 33.8 | 5.62 | 0.264 | — | 220 | 245 | 263 |
| β-MnO2 | — | 21.1 | 0.11 | 25.5 | 4.04 | 0.243 | — | 225 | 250 | 275 |
| Pt/H-MnO2 | 0.38 | 54.0 | 0.23 | 14.1 | 5.74 | 0.346 | 0.765 | 145 | 165 | 180 |
| Pt/γ-MnO2 | 0.39 | 68.6 | 0.23 | 10.5 | 5.99 | 0.312 | 0.739 | 150 | 175 | 190 |
| Pt/α-MnO2 | 0.39 | 71.0 | 0.37 | 39.8 | 7.64 | 0.302 | 0.788 | 145 | 156 | 170 |
| Pt/β-MnO2 | 0.40 | 18.4 | 0.10 | 26.7 | 5.12 | 0.256 | 0.745 | 150 | 170 | 185 |
Particularly, all the Pt-anchored MnO2 catalysts exhibited significantly improved catalytic activities for toluene oxidation when compared with single MnO2 crystal structures, as shown in Fig. 4b. However, the order trend of T90 for toluene conversion over these Pt/MnO2 catalysts obviously changed, which was Pt/α-MnO2 > Pt/H-MnO2 > Pt/β-MnO2 > Pt/γ-MnO2. Apparently, Pt/α-MnO2 exhibited a more outstanding performance with the T10, T50, and T90 values of 145, 156, and 170 °C, respectively, whereas Pt/γ-MnO2 exhibited a lower catalytic performance with the reaction temperatures for toluene conversions being 150, 175 and 190 °C, respectively. Furthermore, Pt/α-MnO2 has a lower activation energy (Ea = 46.73 kJ mol−1) that has been calculated via the Arrhenius plots shown in Fig. 4d. In addition, with an increase in the content (from 0.4 wt% to 0.8 wt%) of the Pt NPs on the surface of α-MnO2, the catalytic activity for toluene oxidation increased, as displayed in Fig. 4c. When 0.8 wt% Pt NPs was loaded on α-MnO2, the T10, T50 and T90 values of this catalyst were 140, 153, and 158 °C, respectively. From the water vapor and cycling results shown in Fig. S3 (ESI†), it was found that the Pt/α-MnO2 catalyst exhibited high catalytic stability and moisture resistance during toluene oxidation. As shown in Fig. S4 (ESI†), after the long-term testing in the presence of moisture, the conversion of toluene over the Pt/α-MnO2 catalyst could still be maintained. The prominent catalytic performance of the Pt/α-MnO2 catalyst can be attributed to its increased oxygen release ability resulting from the highlighted strong metal–support interaction between the Pt NPs and the α-MnO2 support.
The surface area and pore size distributions of the MnO2 and Pt/MnO2 catalysts were further analyzed, as summarized in Fig. S5 (ESI†) and Table 1. Obviously, the as-synthesized MnO2 and Pt/MnO2 samples displayed classical type-IV adsorption–desorption isotherms with type H3 hysteresis loops in the relative pressure range of 0.6–1.0; this indicated the existence of slit-like mesoporous structures in the bulk samples. Among all the MnO2 samples, the β-MnO2 crystal structure had the smallest specific BET surface area and pore volume of 21.1 m2 g−1 and 0.109 cm3 g−1, respectively, whereas α-MnO2 showed the largest specific surface area of 97.6 m2 g−1 and pore volume of 0.346 cm3 g−1. Note that the average pore size distributions of the H-MnO2 and γ-MnO2 samples are narrower than those of the α-MnO2 and β-MnO2 samples; this indicates that both the H-MnO2 and the γ-MnO2 samples have small pores and poor crystallinity; this has been verified by the XRD patterns. Moreover, the average pore size of H-MnO2 is obviously at about 11.5 nm, which is slightly different from that of γ-MnO2 (7.8 nm). Note that the specific surface areas of the as-synthesized Pt/MnO2 catalysts increased when the Pt NPs were embedded on different MnO2 crystal structures when compared with the case of the single MnO2 samples. Moreover, no significant changes were observed in their pore volumes and pore sizes. Pt/α-MnO2 also exhibited largest specific surface area and pore volume among all the Pt-supported catalysts, in which α-MnO2 with higher specific surface area could be more conducive to the immobilization of Pt NPs.
According to the previous studies, the reduction of MnO2 follows a continuous process: MnO2 → Mn2O3 → Mn3O4 → MnO (Mn4+ → Mn3+ → Mn2+).25–27 In the H2-TPR profiles of these MnO2 samples, there are two or three reduction peaks, as shown in Fig. S6a (ESI†). Obviously, β-MnO2 exhibits a maximum H2 consumption peak at 292 °C with a broad peak at 393 °C due to the contribution of H2 in the reduction of MnO2 to Mn3O4 and then to MnO; for the α-MnO2 sample, there is a broad overlapping reduction peak in the range from 200 to 400 °C, whereas the high-temperature reduction peak at 605 °C can be considered to be due to the reduction of some of the surface MnO phase. The main reduction peaks of γ-MnO2 are at about 250 and 377 °C; its first H2 consumption peak due to the reduction of higher metal species (Mn4+) is lower than those of α-MnO2 and β-MnO2. Moreover, a reduction peak occurring at 100–200 °C can be obviously observed, attributed to the reduction of surface oxygen species. In addition, it is clear that the reduction peak of H-MnO2 exhibits a certain similarity to that of γ-MnO2, and the intensity of the reduction peak of the surface oxygen species at 172 °C is increased; this suggests that the gas-phase oxygen can be adsorbed/excited to rich active oxygen, which would contribute to the catalytic reaction of VOC oxidation over H-MnO2.
When different MnO2 crystal structures supported the Pt NPs, the reduction peaks of the Pt/MnO2 products obviously shifted to lower temperature regions, as shown in Fig. S6b (ESI†); the reduction peaks of these Pt/MnO2 samples could be divided into two temperature regions (marked as I and II). The region I, occurring at about 60–150 °C, is attributed to the reduction of a low amount of PtOx and the formation of a strong Mn–O–Pt bond due to a strong metal–support interaction (SMSI) between the surface lattice oxygen of MnO2 and the adjacent Pt NPs.18 The region II located at about 150–350 °C could be attributed to the stepwise reduction of MnO2. In comparison, Pt/α-MnO2 exhibits best low-temperature reducibility, whereas both Pt/γ-MnO2 and Pt/H-MnO2 possess similar reducibility. Moreover, the order of reducibility for the Pt/MnO2 samples is inconsistent with that of the MnO2 structures. The abovementioned results suggest that the difference in the interfacial interactions between the surface unsaturated Pt species and the different MnO2 crystal structures leads to changes in the low-temperature reducibility; moreover, the surface Mn–O bonds are significantly weakened by the Pt NPs due to the formation of SMSIs. The weakening of the surface lattice oxygen would give rise to oxygen mobility and the formation of more active oxygen species.
To further confirm the effects of the formation of strong metal–support interactions on different oxygen species, the O2-TPD and thermogravimetric analyses were carried out, as shown in Fig. S7 (ESI†). Some distinguished desorption peaks are clearly observed: one at below 150 °C, one at about 250–450 °C (I region), and another in the range of 500–650 °C (II region). The first desorption peak at about 107 °C is attributed to the release of surface active oxygen species (Oads, O2− or O22−) that would be weakly bound to the surface of the catalysts; the region I desorption peak is attributed to surface lattice oxygen species (surface Olatt and O2−), and the oxygen desorption peak occurring in the temperature region II generally originates from lattice oxygen species (Olatt and O2−).18,28,29 Hence, according to the first desorption peak, it is noticeable that Pt/α-MnO2 exhibits largest surface oxygen vacancies with highest intensity of the surface-active oxygen species; this is well consistent with the H2-TPR results. On the other hand, the position of the desorption peak I is shifted to a lower temperature (at about 365 °C); this demonstrates enhanced Olatt mobility due to an extremely strong metal–support interaction between α-MnO2 and the Pt NPs when compared with the case of other α-MnO2 and MnO2-supported Pt samples.
Both the α-MnO2 and the Pt/α-MnO2 samples were further characterized by nitrogen/air thermogravimetric analysis (N2-TGA and Air-TGA) to verify the surface active oxygen species that are beneficial for toluene oxidation, as shown in Fig. S8 (ESI†). The first weight losses at about 172 °C for the α-MnO2 and Pt/α-MnO2 catalysts are 1.47 wt% and 2.82 wt% under a N2 atmosphere, respectively, which can be attributed to the desorption of the surface adsorbed oxygen or OH species.30,31 At higher temperatures (200–500 °C), a small weight loss is observed, attributed to the loss of surface lattice oxygen. Moreover, the maximum weight loss for Pt/α-MnO2 due to the bulk lattice oxygen release taking place at above 550 °C was approximately 6.56 wt%, whereas a minor change with a 5.82 wt% weight loss was observed in α-MnO2 since it was relatively stable during the thermal treatment. Importantly, the weight loss for Pt/α-MnO2 was higher than that for α-MnO2 during the heating process; this indicated that the surface oxygen could be much more easily abstracted from Pt/α-MnO2 by nitrogen than from α-MnO2,31 and the presence of Pt NPs in α-MnO2 improves the surface oxygen vacancies of the catalyst. In addition, the temperature values of the weight loss are in accordance with the O2-TPD investigation results. In air, the weight losses for the α-MnO2 and Pt/α-MnO2 catalysts below 180 °C were approximately 1.76 wt% and 1.22 wt%, respectively, and their weight loss trend in the range of 180–500 °C in an air environment was similar to that under a N2 atmosphere. However, compared with the case of the N2 atmosphere, the weight losses of the Pt/α-MnO2 catalyst in the air environment were decreased; this could explain the role of activated oxygen in the reaction process. Since the surface-adsorbed oxygen species coordinate with the oxygen vacancies or the interface of SMSIs are usually considered as the active species in VOC oxidation, this weight loss stage implies that the activated surface-adsorbed oxygen is gradually liberated from the surface of the catalysts. The result is in good agreement with the abovementioned O2-TPD measurement results; this confirms that the Pt NPs anchored on MnO2 can significantly enhance the activation of the surface oxygen species for toluene oxidation.
Fig. S9 (ESI†) shows the Mn 2p and O 1s spectra of different MnO2 and Pt/MnO2 catalysts. As revealed in Fig. S9a (ESI†), the binding energies (BE) at 642.7 and 641.7 eV are ascribed to the surface Mn4+ and Mn3+ species, respectively.32,33 The surface Mn4+/Mn3+ molar ratios calculated by the Mn 2p quantitative analysis are shown in Table 1. Obviously, it can be observed that the Mn4+/Mn3+ molar ratios of these catalysts are distinguishing. H-MnO2 possesses highest surface Mn4+/Mn3+ molar ratio (5.87), whereas β-MnO2 shows lowest molar ratio of surface Mn4+/Mn3+ (4.04). The sequence of the surface Mn4+/Mn3+ ratios for these MnO2 catalysts is as follows: H-MnO2 > γ-MnO2 > α-MnO2 > β-MnO2. Based on a literature study,25 a catalyst with a higher manganese valence (Mn4+) would easily generate abundant surface adsorbed oxygen (Oads) species. As shown in Fig. S9c (ESI†), the binding energies (BE) at around 529.7 and 531.5 eV are ascribed to the surface lattice oxygen (Olatt) and adsorbed oxygen (Oads) species, respectively.20,34,35 The amount of surface Oads species follows the order H-MnO2 (0.349) > γ-MnO2 (0.291) > α-MnO2 (0.264) > β-MnO2 (0.243), which is consistent with the tendency of the surface Mn4+ species.
The supported-Pt samples were further investigated via the XPS measurement; the curves of the surface elements (Mn 2p, O 1s and Pt 4f) are shown in Fig. S9 and S10 (ESI†). The concentrations of the surface Mn4+ and Oads species on Pt/MnO2 are generally increased when compared with those of the single MnO2 supports. Certainly, among these Pt-based samples, the concentrations of the surface Mn4+ and Oads species on Pt/α-MnO2 increased even more dramatically due to the contribution of a remarkable SMSI that leads to the weakening of the surface lattice oxygen species. The Pt 4f spectrum (as shown in Fig. S10, ESI†) reveals that Pt 4f7/2 can be divided into two peaks at 71.3 and 72.4 eV, which are ascribed to the Pt0 and Pt2+ species, respectively.6,36,37 It can be observed that Pt in these Pt/MnO2 samples mainly exist as Pt0in the surface composition, and the percentages of Pt0 are similar for all the samples. In addition, the major peak of Pt 4f7/2 for Pt/α-MnO2 shifts towards a lower binding energy by around 0.3 eV; this can be due to the strong metal–support interaction between the Pt NPs and the α-MnO2 support. It has been reported that the Oads species would play significant roles in the total VOC oxidation.24,25,38,39 This result manifests that the presence of Pt NPs can cause a series of significant changes in the surface structure of the catalysts.
To further analyze the effect of Pt NPs on the crystal structure of MnO2, high-temperature XRD (HT-XRD) tests were carried out at different temperatures. Fig. S11 (ESI†) shows the HT-XRD patterns for the α-MnO2 and Pt/α-MnO2 samples. For the α-MnO2 sample, all the diffraction peaks are ascribed to the characteristic peaks of the α-MnO2 (JCPDS 44-0141) phase, and the intensity of the (211), (321), and (710) reflections of the MnO2 phase gradually increases and slightly shifts to lower angles with an increase in temperature. In addition, other diffraction peaks undergo no significant changes when the heating temperature is increased from 25 °C to 250 °C. In contrast, the (400) and (521) diffraction peaks in the Pt/α-MnO2 samples become weak and obviously shift to lower angles due to the thermal effects of lattice distortion. However, the variation trends of other major diffraction peaks in the Pt/α-MnO2 sample are similar to those in the α-MnO2 sample. Therefore, the overall crystal structure of the MnO2 phase was maintained; however, the local surface-exposed planes that could interact with the Pt NPs were changed. According to the O2-TPD, XPS and TGA results, it has been confirmed that the Pt NPs decorated on the surface of α-MnO2 would greatly improve the surface oxygen vacancies and the mobility of the surface lattice oxygen. In this characterization, the larger shifted value of the angles for the Pt/α-MnO2 catalyst could be attributed to the formation of a strong metal–support interaction. The reduced intensity of the partial diffraction peaks with the increasing temperature could be due to the effect of heating on the surface lattice oxygen (Mn–O or Mn–O–Pt) release dissociation. Hence, α-MnO2 is relatively stable during the heating treatment, whereas the surface chemical elemental states of Pt/α-MnO2 would be easily activated at the active sites at higher temperatures.
Next, the quasi in situ XPS measurement was carried out to characterize the subtle structural rearrangement of the α-MnO2 and Pt/α-MnO2 samples after the N2 and air pre-treatment. The quasi in situ XPS results reveal that there are significant changes in the surface concentration of various elements. When the temperature is increased from 150 °C to 250 °C, the surface Mn4+/Mn3+ molar ratios on the α-MnO2 catalyst decrease under the same atmosphere (Fig. 5 and Fig. S12, ESI†). In addition, its Mn4+/Mn3+ molar ratios after air pre-treatment are higher than those after the N2 pre-treatment. The amount of surface Oads species also decreases with the increasing temperature (Fig. 5 and Fig. S12, Table S1, ESI†); this indicates that the surface-adsorbed oxygen may be gradually liberated at higher temperatures. Significantly, when the N2 pretreatment was switched to the air pretreatment, the amount of surface Oads species similarly indicated a slight decrease, suggesting that the gaseous oxygen species were rearranged into surface lattice oxygen on the catalyst surface during heating. For the Pt/α-MnO2 catalyst, the changes in the surface elements are similar to those for the α-MnO2 catalyst. However, the surface Oads species in the Pt/α-MnO2 catalyst exhibit a sharp decrease due to the presence of gaseous oxygen; this indicates that the gaseous oxygen is more easily activated on the surface of the Pt/α-MnO2 catalyst. The average oxidation state (AOS) of the manganese atom was further calculated according to the binding energy of the Mn 3s patterns (in Fig. S13, ESI†), as shown in Table S1 (ESI†). The quasi in situ Pt 4f XPS (Fig. S14, ESI†) shows that the valence state of the Pt species has not significantly changed.
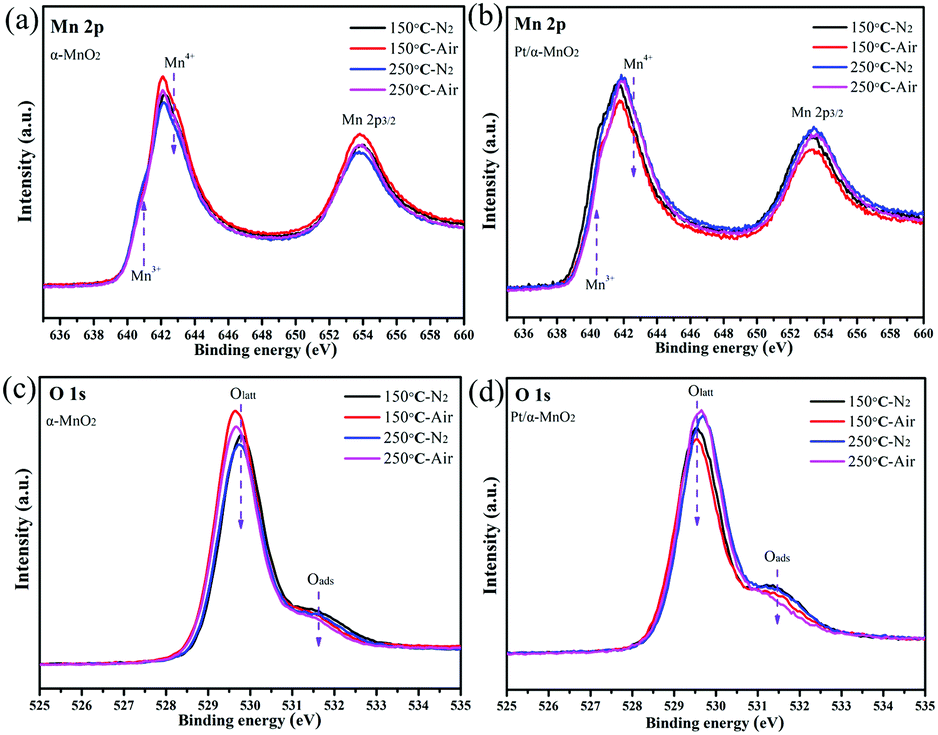 | ||
| Fig. 5 Quasi in situ (a and b) Mn 2p and (c and d) O 1s XPS spectra of α-MnO2 and Pt/α-MnO2 samples at different temperatures (150 and 250 °C) and atmospheres (N2 and air). | ||
To study the formed intermediates and the used oxygen species during the toluene oxidation process, the in situ DRIFTS was used to detect the transient species on the catalyst surface, as shown in Fig. 6 and Fig. S14 (ESI†). Before the adsorption and oxidation process of toluene, the α-MnO2 and Pt/α-MnO2 catalysts were pre-treated by N2 for 1.0 h at 300 °C. The in situ DRIFT spectra of Pt/α-MnO2 exposed to 500 ppm toluene/N2 and toluene/air at 50 °C for different times are shown in Fig. 6a and b. The bands that occur at around 1490 and 1596 cm−1 can be ascribed to ν(C![[double bond, length as m-dash]](https://www.rsc.org/images/entities/char_e001.gif) C) of the skeletal vibrations of the aromatic rings, where the methyl (–CH3) group, the C–H stretching vibration and C–H in-plane bending vibration of the benzene rings have been immediately observed at 3070, 3027 and 1025 cm−1, respectively, suggesting that toluene is adsorbed on the surface of the Pt/α-MnO2 catalyst.40–42 The 1176 cm−1 absorption band is related to the antisymmetric C–C stretching vibration of the benzene ring. The bands at 2950, 2879, 1369, and 1303 cm−1 are ascribed to νas(C–H), νs(C–H) bending vibrations of methylene (–CH2) groups, and the CH2 deformation mode, respectively, suggesting that the CH3 group of toluene has been cleaved into methylene to form benzyl (C6H5–CH2) on the surface of the Pt/α-MnO2 catalyst.28,43,44 The bands at around 1078, 1146, 1167, 1180 and 1213 cm−1 are ascribed to the C–O stretching vibrations. The bands at 1167, 1146 and 1078 cm−1 are the characteristic bands of the typical alkoxide species (C6H5–CH2–O), and the band at 1213 cm−1 belongs to the C–O vibration of the surface phenolate (C6H5–OH).41,45 In addition, the bands at 1412 and 1667 cm−1 are ascribed to the C–O–H and ν(CO) stretching vibrations, respectively, suggesting the formation of benzaldehyde species (C6H5–CHO).41 The band located at 1820 cm−1 corresponds to the ν(CO) stretching vibration of acid anhydride as a by-product. The band centered at 1546 cm−1 is related to the stretching vibration of the formate species (–COO), and the distinct bands located at 3300–3600 and 1627 cm−1 are ascribed to the stretching vibrations of the OH group due to the contribution of toluene derivatives or water, indicating the formation of benzoate species (C6H5–COO) as the key intermediate during toluene oxidation.42 It can be found that the key intermediates on the surface of Pt/α-MnO2 exposed to toluene/N2 and toluene/air are similar (Fig. 6a and b). Various key intermediates can be observed during the adsorption process of toluene, and the band intensities of the key products increase with time; this suggests that the lattice oxygen may be involved in transformation of the adsorbed toluene to other species with or without gas-phase oxygen at lower temperatures.
C) of the skeletal vibrations of the aromatic rings, where the methyl (–CH3) group, the C–H stretching vibration and C–H in-plane bending vibration of the benzene rings have been immediately observed at 3070, 3027 and 1025 cm−1, respectively, suggesting that toluene is adsorbed on the surface of the Pt/α-MnO2 catalyst.40–42 The 1176 cm−1 absorption band is related to the antisymmetric C–C stretching vibration of the benzene ring. The bands at 2950, 2879, 1369, and 1303 cm−1 are ascribed to νas(C–H), νs(C–H) bending vibrations of methylene (–CH2) groups, and the CH2 deformation mode, respectively, suggesting that the CH3 group of toluene has been cleaved into methylene to form benzyl (C6H5–CH2) on the surface of the Pt/α-MnO2 catalyst.28,43,44 The bands at around 1078, 1146, 1167, 1180 and 1213 cm−1 are ascribed to the C–O stretching vibrations. The bands at 1167, 1146 and 1078 cm−1 are the characteristic bands of the typical alkoxide species (C6H5–CH2–O), and the band at 1213 cm−1 belongs to the C–O vibration of the surface phenolate (C6H5–OH).41,45 In addition, the bands at 1412 and 1667 cm−1 are ascribed to the C–O–H and ν(CO) stretching vibrations, respectively, suggesting the formation of benzaldehyde species (C6H5–CHO).41 The band located at 1820 cm−1 corresponds to the ν(CO) stretching vibration of acid anhydride as a by-product. The band centered at 1546 cm−1 is related to the stretching vibration of the formate species (–COO), and the distinct bands located at 3300–3600 and 1627 cm−1 are ascribed to the stretching vibrations of the OH group due to the contribution of toluene derivatives or water, indicating the formation of benzoate species (C6H5–COO) as the key intermediate during toluene oxidation.42 It can be found that the key intermediates on the surface of Pt/α-MnO2 exposed to toluene/N2 and toluene/air are similar (Fig. 6a and b). Various key intermediates can be observed during the adsorption process of toluene, and the band intensities of the key products increase with time; this suggests that the lattice oxygen may be involved in transformation of the adsorbed toluene to other species with or without gas-phase oxygen at lower temperatures.
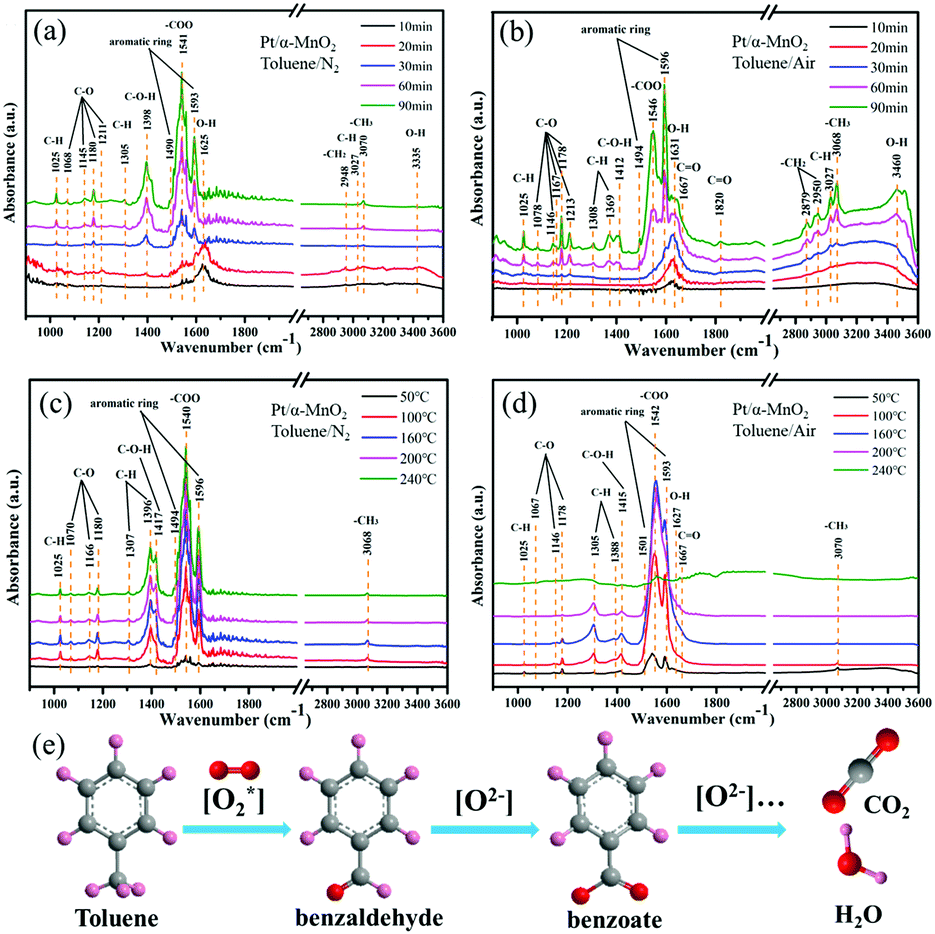 | ||
| Fig. 6 In situ DRIFT spectra of Pt/α-MnO2 exposed to 500 ppm toluene/N2 and toluene/air at 50 °C for (a and b) different times, and at (c and d) different temperatures (50, 100, 160, 200 and 240 °C), respectively; and (e) the schematic of various intermediates during the degradation of toluene. | ||
When the Pt/α-MnO2 catalyst was introduced into toluene/N2 and toluene/air at different temperatures, obvious changes occurred in various species with an increase in temperature, as shown in Fig. 6c and d. The intensity of various bands increases to maximum at 160 °C in toluene/N2 and toluene/air. Subsequently, when the temperature is increased to above 160 °C, the intensity of the bands (toluene and key intermediates) shows no significant change without oxygen (Fig. 6c); on the contrary, the concentration of the key intermediates (benzoate, benzaldehyde and alkoxide species) gradually decreases with an increase in temperature in the presence of gas-phase oxygen. Moreover, the in situ DRIFTS of α-MnO2 under the same conditions (Fig. S15, ESI†) are similar to those of Pt/α-MnO2, in which the major difference is the tendency of the intermediate species to decrease with temperature. The abovementioned results imply that both the gaseous oxygen and the lattice oxygen in the Pt/α-MnO2 and α-MnO2 catalysts can be involved in the initial activation of toluene; however, only gaseous oxygen is available for the deep oxidation of toluene into CO2 and H2O because the gaseous oxygen species can be reconstituted into the surface lattice oxygen on the catalyst surface. It has been confirmed that the weakening of the surface Mn–O bonds and the improved mobility of the lattice oxygen because of the contribution of the Pt NPs play an important role in the catalytic oxidation reaction. According to the in situ DRIFTS characterization, we can predict that the Langmuir–Hinshelwood (L–H) mechanism and the Mars-van Krevelen (MvK) mechanism simultaneously act during the toluene catalytic oxidation on the surface of the MnO2-based catalysts; this has also been reported in the case of CO oxidation.18,46 The reaction pathway could be mainly followed as (Fig. 6e)28,41–45 benzyl radical → benzaldehyde → benzoate → formate species, and finally the complete oxidation into CO2 and H2O.
Conclusions
In summary, we showed that the SMSIs of Pt/MnO2 catalysts significantly depended on different MnO2 crystal structures (α-, β-, γ- and H-MnO2), and different MnO2-based catalysts were applied to the toluene deep oxidation reaction. The shapes of the MnO2 supports not only led to different surface Mn4+ and Oads amounts, low-temperature reducibility, and catalytic behaviors for total toluene oxidation, but also affected the correlation between them and the Pt NPs. Experimental results confirmed that the relationship between the catalyst structure and the catalytic activity was closely associated with the difference in the Pt/MnO2 SMSIs. Among the MnO2 catalysts, the as-synthesized H-MnO2 catalyst with abundant surface Oads species and a well-defined hollow structure exhibited best catalytic activity for total toluene oxidation (T90 = 230 °C). More interestingly, when different MnO2 crystal structures were used as supports, the Pt/α-MnO2 catalyst showed highly superior activity (T90 = 170 °C) for toluene oxidation, whereas Pt/γ-MnO2 exhibited lowest catalytic activity. The improved activity was ascribed to the introduction of Pt NPs to form SMSIs. Due to the special role of the SMSIs in the Pt/MnO2 catalysts, the SMSIs would greatly improve the surface oxygen vacancies and the mobility of the surface lattice oxygen; moreover, they would affect the surface-exposed Pt NPs. The in situ DRIFTS results demonstrated that the lattice oxygen on the catalyst surface could be involved in the initial activation of the toluene molecules to transform them into other species; however, the gaseous oxygen replenished by the oxygen vacancies played an essential role in the deep oxidation of the toluene molecules to CO2 and H2O.Conflicts of interest
There are no conflicts to declare.Acknowledgements
This research was financially supported by the National Natural Science Foundation of China (No. 51878292, 51108187, 51672273, B5151050), the Science and Technology Planning Project of Guangdong Province China (No. 2015B0202236002), and the Guangdong Natural Science Foundation (No. 2016A030311003).Notes and references
- L. F. Liotta, H. Wu, G. Pantaleo and A. M. Venezia, Catal. Sci. Technol., 2013, 3, 3085 RSC.
- W. Tang, W. Xiao, S. Wang, Z. Ren, J. Ding and P.-X. Gao, Appl. Catal., B, 2018, 226, 585–595 CrossRef CAS.
- H. Huang, Y. Xu, Q. Feng and D. Y. C. Leung, Catal. Sci. Technol., 2015, 5, 2649–2669 RSC.
- X. Chen, Z. Zhao, Y. Zhou, Q. Zhu, Z. Pan and H. Lu, Appl. Catal., A, 2018, 566, 190–199 CrossRef CAS.
- E. Yang, E. J. Jang, J. G. Lee, S. Yoon, J. Lee, N. Musselwhite, G. A. Somorjai, J. H. Kwak and K. An, Catal. Sci. Technol., 2018, 8, 3295–3303 RSC.
- R. Peng, S. Li, X. Sun, Q. Ren, L. Chen, M. Fu, J. Wu and D. Ye, Appl. Catal., B, 2018, 220, 462–470 CrossRef CAS.
- G. Liu, Y. Tian, B. Zhang, L. Wang and X. Zhang, J. Hazard. Mater., 2019, 367, 568–576 CrossRef CAS PubMed.
- J. Liu, ACS Catal., 2016, 7, 34–59 CrossRef.
- B. Qiao, A. Wang, X. Yang, L. Allard, Z. Jiang, Y. Cui, J. Liu, J. Li and T. Zhang, Nat. Chem., 2011, 3, 634–641 CrossRef CAS PubMed.
- S. Li, Y. Xu, Y. Chen, W. Li, L. Lin, M. Li, Y. Deng, X. Wang, B. Ge, C. Yang, S. Yao, J. Xie, Y. Li, X. Liu and D. Ma, Angew. Chem., Int. Ed., 2017, 56, 10761–10765 CrossRef CAS PubMed.
- Y. Wang, D. Widmann, M. Heenemann, T. Diemant, J. Biskupek, R. Schlögl and R. J. Behm, J. Catal., 2017, 354, 46–60 CrossRef CAS.
- K. Murata, Y. Mahara, J. Ohyama, Y. Yamamoto, S. Arai and A. Satsuma, Angew. Chem., Int. Ed., 2017, 56, 15993–15997 CrossRef CAS PubMed.
- K. Fujiwara, K. Okuyama and S. E. Pratsinis, Environ. Sci.: Nano, 2017, 4, 2076–2092 RSC.
- S. Tauster, S. Fung and R. Garten, J. Am. Chem. Soc., 1978, 100, 170–175 CrossRef CAS.
- R. Peng, X. Sun, S. Li, L. Chen, M. Fu, J. Wu and D. Ye, Chem. Eng. J., 2016, 306, 1234–1246 CrossRef CAS.
- S. Zhang, Z. Xia, T. Ni, Z. Zhang, Y. Ma and Y. Qu, J. Catal., 2018, 359, 101–111 CrossRef CAS.
- H. Xu, N. Yan, Z. Qu, W. Liu, J. Mei, W. Huang and S. Zhao, Environ. Sci. Technol., 2017, 51, 8879–8892 CrossRef CAS PubMed.
- N. Zhang, L. Li, R. Wu, L. Song, L. Zheng, G. Zhang and H. He, Catal. Sci. Technol., 2019, 9, 347–354 RSC.
- B. Zhang, G. Cheng, W. Ye, X. Zheng, H. Liu, M. Sun, L. Yu, Y. Zheng and X. Cheng, Dalton Trans., 2016, 45, 18851–18858 RSC.
- J. Jia, P. Zhang and L. Chen, Appl. Catal., B, 2016, 189, 210–218 CrossRef CAS.
- D. Jampaiah, V. K. Velisoju, P. Venkataswamy, V. E. Coyle, A. Nafady, B. M. Reddy and S. K. Bhargava, ACS Appl. Mater. Interfaces, 2017, 9, 32652–32666 CrossRef CAS PubMed.
- F. Shi, F. Wang, H. Dai, J. Dai, J. Deng, Y. Liu, G. Bai, K. Ji and C. T. Au, Appl. Catal., A, 2012, 433–434, 206–213 CrossRef CAS.
- B. Bai, J. Li and J. Hao, Appl. Catal., B, 2015, 164, 241–250 CrossRef CAS.
- F. Wang, H. Dai, J. Deng, G. Bai, K. Ji and Y. Liu, Environ. Sci. Technol., 2012, 46, 4034–4041 CrossRef CAS PubMed.
- W. Tang, X. Wu, D. Li, Z. Wang, G. Liu, H. Liu and Y. Chen, J. Mater. Chem. A, 2014, 2, 2544–2554 RSC.
- Z. Sihaib, F. Puleo, J. M. Garcia-Vargas, L. Retailleau, C. Descorme, L. F. Liotta, J. L. Valverde, S. Gil and A. Giroir-Fendler, Appl. Catal., B, 2017, 209, 689–700 CrossRef CAS.
- M. Luo, Y. Cheng, X. Peng and W. Pan, Chem. Eng. J., 2019, 369, 758–765 CrossRef CAS.
- Y. Wang, H. Arandiyan, Y. Liu, Y. Liang, Y. Peng, S. Bartlett, H. Dai, S. Rostamnia and J. Li, ChemCatChem, 2018, 10, 3429–3434 CrossRef CAS.
- B. Li, Q. Yang, Y. Peng, J. Chen, L. Deng, D. Wang, X. Hong and J. Li, Chem. Eng. J., 2019, 366, 92–99 CrossRef CAS.
- L. Ma, C. Y. Seo, X. Chen, K. Sun and J. W. Schwank, Appl. Catal., B, 2018, 222, 44–58 CrossRef CAS.
- P. Li, X. Chen, L. Ma, A. Bhat, Y. Li and J. W. Schwank, Catal. Sci. Technol., 2019, 9, 1165–1177 RSC.
- H. Pan, Y. Jian, C. Chen, C. He, Z. Hao, Z. Shen and H. Liu, Environ. Sci. Technol., 2017, 51, 6288–6297 CrossRef CAS PubMed.
- Y. Wei, J. Liu, W. Su, Y. Sun and Y. Zhao, Catal. Sci. Technol., 2017, 7, 1565–1572 RSC.
- Q. Zhang, S. Mo, B. Chen, W. Zhang, C. Huang and D. Ye, Mol. Catal., 2018, 454, 12–20 CrossRef CAS.
- N. Huang, Z. Qu, C. Dong, Y. Qin and X. Duan, Appl. Catal., A, 2018, 560, 195–205 CrossRef CAS.
- B. Wang, B. Chen, Y. Sun, H. Xiao, X. Xu, M. Fu, J. Wu, L. Chen and D. Ye, Appl. Catal., B, 2018, 238, 328–338 CrossRef CAS.
- X. Weng, Q. Liu, J. J. Feng, J. Yuan and A. J. Wang, J. Colloid Interface Sci., 2017, 504, 680–687 CrossRef CAS PubMed.
- J. Zhang, Y. Li, L. Wang, C. Zhang and H. He, Catal. Sci. Technol., 2015, 5, 2305–2313 RSC.
- S. Mo, S. Li, W. Li, J. Li, J. Chen and Y. Chen, J. Mater. Chem. A, 2016, 4, 8113–8122 RSC.
- H. Sun, Z. Liu, S. Chen and X. Quan, Chem. Eng. J., 2015, 270, 58–65 CrossRef CAS.
- X. Yang, X. Yu, M. Lin, X. Ma and M. Ge, Catal. Today, 2019, 327, 254–261 CrossRef CAS.
- S. Zhao, F. Hu and J. Li, ACS Catal., 2016, 6, 3433–3441 CrossRef CAS.
- Y. T. Lai, T. C. Chen, Y. K. Lan, B. S. Chen, J. H. You, C. M. Yang, N. C. Lai, J. H. Wu and C. S. Chen, ACS Catal., 2014, 4, 3824–3836 CrossRef CAS.
- Y. Wang, W. Deng, Y. Wang, L. Guo and T. Ishihara, Mol. Catal., 2018, 459, 61–70 CrossRef CAS.
- X. Chen, X. Chen, E. Yu, S. Cai, H. Jia, J. Chen and P. Liang, Chem. Eng. J., 2018, 344, 469–479 CrossRef CAS.
- Y. G. Wang, D. C. Cantu, M. S. Lee, J. Li, V. A. Glezakou and R. Rousseau, J. Am. Chem. Soc., 2016, 138, 10467–10476 CrossRef CAS PubMed.
Footnote |
| † Electronic supplementary information (ESI) available: Experimental section, Table S1 and Fig. S1–S15. See DOI: 10.1039/c9nh00303g |
| This journal is © The Royal Society of Chemistry 2019 |