Hydrothermal synthesis and enhanced xylene-sensing properties of pompon-like Cr-doped Co3O4 hierarchical nanostructures
Yujia Lia,
Xiaohui Maa,
Sijia Guob,
Bin Wanga,
Dongming Sunc,
Xindong Zhang*b and
Shengping Ruan*a
aCollege of Electronic Science and Engineering, Jilin University, Changchun 130012, China. E-mail: ruansp@jlu.edu.cn
bState Key Laboratory on Integrated Optoelectronics, Jilin University, Changchun 130012, China. E-mail: xindong@jlu.edu.cn
cInstitute of Metal Research, Chinese Academy of Sciences, Shenyang, 110016, China
First published on 5th February 2016
Abstract
Pompon-like Co3O4 and Cr-doped Co3O4 hierarchical nanostructures were synthesized via a hydrothermal reaction, and a series of different proportions of Cr were doped to investigate the effect of Cr-doping on the gas sensing performance. All the prepared materials were used to fabricate gas sensors, and the result of the gas sensing measurements indicated that the optimum proportion of Cr/Co was 5 at%, whose response (6.38) to xylene (5 ppm) was higher than the others. Further, with increasing Cr ratio, the response to xylene (5 ppm) tended to decline after ascending, with 5 at% (Cr/Co) as the cut-off point, but all sensors made from Cr-doped Co3O4 hierarchical nanostructures showed a higher response to xylene than the pure Co3O4 hierarchical nanostructures, which improved the selectivity of sensors. In addition, it is worth mentioning that all the sensors’ optimum working temperatures were low, requiring a smaller heating current and low power consumption.
1. Introduction
The air is the most important element for human life, but now the quality of air is increasingly deteriorating. Besides many factory chimneys and car exhaust cylinders on the street, new furniture and paint also send out some harmful substances. As a representative of a common indoor pollutant, excessive xylene can cause huge damage to human health and induce horrible diseases such as colon cancer, rectal cancer and lung cancer.1 So, air quality monitoring appears to be necessary for environmental sustainability and human health, and it is of great significance to develop a reliable and effective gas sensor. There are a lot of detecting systems or methods to be applied in daily life and production, such as the optical waveguide technique,2 optical planar Bragg grating sensors,3 biosensors,4 chemical sensors,5 and magnetoelastic sensors,6 etc. Compared with them, gas sensors have attracted great attention due to their low cost, portability, convenient fabrication, and detectable possibility of large number of gases.7As a typical metal oxide semiconductor (MOS), Co3O4 is applied in many fields for its great properties, including as supercapacitors,8 in lithium-ion batteries,9,10 energy storage,11 electrochromic devices,12 water oxidation,13 catalysts,14,15 magnetic materials,16 and gas sensing.17,18 As for gas-sensing application, Co3O4 nanostructures with different morphologies have been prepared through various methods, such as nanocubes prepared by a microwave-assisted solvothermal method,19 nanofibers by electrospinning,20,21 nanoflowers by a hydrothermal method,22 nanospheres by a solvothermal method,23 and nanoparticles by plasma-enhanced chemical vapor deposition.24 Among them, hydrothermal synthesis has its unique advantages compared with the other methods, and its simple equipment requirements make the whole process easier to operate and suitable for industrial realization. The uniformity and controllability of the products give the material more a suitable morphology to achieve a higher response or lower detection limit. Meanwhile, hydrothermal synthesis also allows surface modification and uniform doping, which are two typical ways to improve sensing performance, as has been reported.25,26
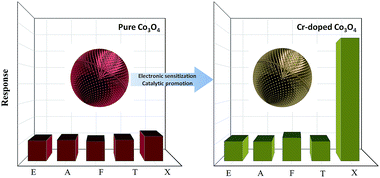
In this work, we prepared pompon-like Co3O4 via a hydrothermal synthesis, the topography of which provided a large surface area, and the different proportions of Cr doping were conducted to enhance the material’s sensing properties (Fig. 1). Both a large surface area and Cr-doping are considered to provide more active sites, where the oxidation reaction between the material and target gas occurs readily or vigorously. To investigate the best doping ratio, a series of experiments with different proportions of Cr doping were implemented. As for the effect of Cr-doping, it is considered that the gas-sensing properties of the prepared material benefit a lot from its catalytic oxidation of methyl groups.
2. Experimental section
2.1 Chemical reagents
Cobaltous acetate tetrahydrate (Co(CH3COO)2·4H2O, Xilong Chemical Reagent Co.), L-lysine (C6H14N2O2, China, the Chemical Reagent Co., Ltd), chromium(III) 2,4-pentanedionate (Cr(C5H7O2)3, Xiya Reagent Research Center), anhydrous ethanol (CH3CH2OH, Beijing Chemicals Co.). All of these chemicals were of analytic grade and used without further purification.2.2 Preparation of pompon-like Co3O4 and Cr-doped Co3O4 hierarchical nanostructures
The undoped Co3O4 hierarchical nanostructures were synthesized by a hydrothermal reaction as reported with some modification.27 Cobaltous acetate tetrahydrate (0.249 g) was dissolved in a mixture of anhydrous ethanol (45 mL) and deionized water (5 mL). After adding L-lysine (0.292 g), the solution was homogenized by ultrasonic treatment for 5 min. Then the precursor solution was transferred into a Teflon-lined stainless steel autoclave with a volume of 100 mL, which was heated and maintained at 180 °C for 10 h. When cooling down to room temperature, the resulting product was centrifuged and washed several times with ethanol until the supernatant was almost colorless, and then dried at 60 °C for 24 h, after which the resulting product showed a morphology of spherical flowers. The obtained powders were calcined at 600 °C for 2 h, and converted into pompon-like hierarchical nanostructures.In order to investigate the effect of Cr doping on the gas sensing performance, a series of different proportions of Cr were added into the precursor solution, ranging from 1 at% to 7 at% (Cr/Co = 1, 2, 3, 4, 5, 6 and 7 at%), and the resulting products had a similar appearance with the as-prepared undoped Co3O4 hierarchical nanostructures.
2.3 Sample characterization
X-ray diffraction (XRD) analysis was conducted on a Scintag XDS-2000 X-ray diffractometer with Cu Kα radiation (λ = 1.5418 Å). X-ray photoelectron spectroscopy (XPS) data were obtained from a VG ESCALAB MK II spectrometer with a Mg KR excitation (1253.6 eV). Scanning electron microscopy (SEM) was performed on a SHIMADZU SSX-550 (Japan) instrument. Surface area and pore size distribution were evaluated using Brunauer–Emmett–Teller (BET) and Barrett–Joyner–Halenda (BJH) methods, respectively, and surface area data were obtained from a Micromeritics Gemini VII 2390 instrument.2.4 Sensor fabrication and measurement
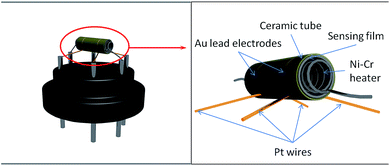
An alumina ceramic tube (length = 4 mm, external diameter = 1.2 mm, internal diameter = 0.6 mm) with two ring-like Au electrodes on its surface (electrode width = 0.65 mm, separation = 0.2 mm) was used for gas sensing.The fabrication process of the gas sensor was as follows: the as-prepared sample was mixed with deionized water at a weight ratio of 4![[thin space (1/6-em)]](https://www.rsc.org/images/entities/char_2009.gif) :
:![[thin space (1/6-em)]](https://www.rsc.org/images/entities/char_2009.gif) 1 to form a paste. Then the paste was coated on a ceramic tube to form a sensing film (with a thickness of about 300 μm). The ceramic tube had two Au electrodes previously printed, each of which was attached by a Pt lead wire. A spiral heating wire made of Ni–Cr alloy was inserted through the hollow center of the ceramic tube to control the operating temperature. All six wire ends were welded to a pedestal with six pins. The structure of the device is shown in Fig. 2. The completed sensor was aged by heating it for two days.
1 to form a paste. Then the paste was coated on a ceramic tube to form a sensing film (with a thickness of about 300 μm). The ceramic tube had two Au electrodes previously printed, each of which was attached by a Pt lead wire. A spiral heating wire made of Ni–Cr alloy was inserted through the hollow center of the ceramic tube to control the operating temperature. All six wire ends were welded to a pedestal with six pins. The structure of the device is shown in Fig. 2. The completed sensor was aged by heating it for two days.
The gas sensing performance data of the fabricated sensors were obtained from a gas sensing test by a Chemical gas sensor-8 (CGS-8) intelligent gas sensing analysis system (Beijing Elite Tech Co., Ltd, China) under room conditions (17 °C, 43 RH%). The values of sensor resistance were acquired by the analysis system automatically. The detecting atmosphere was a mixture of air and target gas in a certain concentration, made by injecting a saturated target gas or liquid into the test chamber of 20 L through a rubber plug with a microinjector. After being heated to be stable in air, the resistance of the sensors was Ra, and once they had reached a new constant value in the detecting atmosphere, the resistance was Rg. The response value (R) was defined as R = Rg/Ra (p-type semiconductor). The above process was for the sensor’s response, and then the test chamber was opened to enable the sensor to recover in air. The time spent by the sensor to achieve 90% of the total resistance change was defined as the response time (target gas adsorption) or the recovery time (target gas desorption).
3. Results and discussion
3.1 Characterization of Co3O4 and Cr-doped Co3O4 hierarchical nanostructures
The crystal phase of the Co3O4 and Cr-doped Co3O4 hierarchical nanostructures was identified by X-ray diffraction (XRD), and all samples exhibited similar XRD patterns containing the Co3O4 phase (JCPDS# 43-1003) (Fig. 3). No secondary phase was observed in the Cr-doped Co3O4 hierarchical nanostructures. The absence of Cr-related peaks in the Cr-doped Co3O4 samples was attributed to the incorporation of Cr into the Co3O4 lattice, although the possibility of a Cr-related secondary phase with low crystallinity or a secondary phase below the detection limit of the XRD cannot be excluded.In order to investigate the incorporation of Cr in Co3O4 and the physical and chemical state of the components, a sample was further analyzed by X-ray photoelectron spectroscopy (XPS) (Fig. 4). From the curve shown in Fig. 4b, it can be observed that the peak intensities centred at 781 eV and 796 eV respectively correspond to Co 2p1/2 and Co 2p3/2, whose energy difference splitting was 15.0 eV, indicting the existence of both Co2+ and Co3+.28 As depicted in Fig. 4c, the peaks of Cr 2p1/2 and Cr 2p3/2 are clearly at 586.5 eV and 578.5 eV, which indicates that Cr is doped into Co3O4. Fig. 4d shows the peak intensity of O 1s. The binding energy for the C 1s peak (284.7 eV) was used as an internal reference.
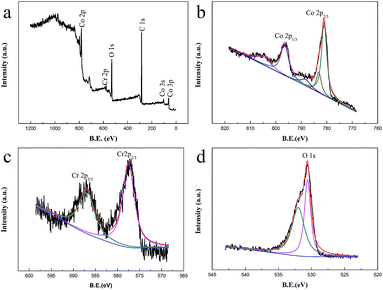 | ||
| Fig. 4 XPS spectra of 5 at% Cr-doped Co3O4 hierarchical nanostructures: (a) full spectrum; (b) Co 2p; (c) Cr 2p; (d) O 1s. | ||
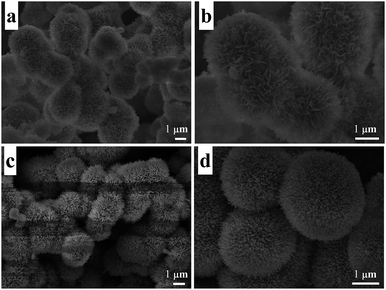
The morphology and structure of the samples were observed by scanning electron microscopy (SEM). Fig. 5a shows a low-magnification SEM image of the precursor without heat treatment, and Fig. 5b is the high-magnification SEM image. A flower-like structure assembled by many petals can be observed which has a diameter of about 2 μm. Fig. 5c and d show the low-magnification and high-magnification SEM images of the sample after heat treatment at 600 °C, and the “flower” has been converted to be a pompon-like structure with a lot of branches on the surface. As secondary structures, the petals and branches are in the size range of 50–100 nm. This hierarchical nanostructure is considered to provide porosity and increase the specific surface area. For further confirmation, the typical BET surface area and pore size distribution of a sample were determined by measuring the corresponding nitrogen adsorption–desorption isotherms, which are shown in Fig. 6. It can be observed that the curve presents a type III isotherm with an H3 hysteresis loop at a high relative pressure, according to the Brunauer–Deming–Deming–Teller (BDDT) classification, which indicates the presence of silt-like mesopores (20–120 nm) in the specimens. The specific area of the sample was determined to be 20.53 m3 g−1. The inset is the pore size distribution of the sample, and most pores fall into the size range of 40–60 nm.
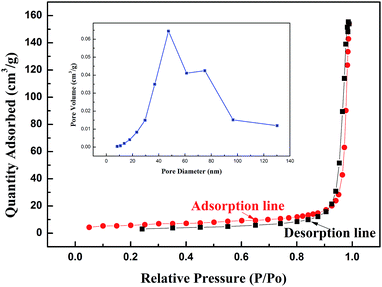 | ||
| Fig. 6 Typical N2 adsorption–desorption isotherms and pore-size distribution curve (inset) of 5 at% Cr-doped Co3O4 hierarchical nanostructures. | ||
3.2 Gas-sensing performance
It is acknowledged that for a semiconductor sensor, the response to a gas is usually dependent on the operating temperature. The response to 5 ppm xylene of all the sensors was tested at different temperatures from 80 °C to 210 °C, and the changing trends are depicted in Fig. 8a. The sensor based on pure Co3O4 exhibits the highest response to 5 ppm xylene at 161 °C, and the responses of all the sensors based on Cr-doped Co3O4 have a tendency to rise before falling, and the temperature 139 °C was taken as the cut-off point, so the optimum temperature of the sensor based on pure Co3O4 was determined to be 161 °C, and for all the sensors based on Cr-doped Co3O4 it was 139 °C. Then, at their respective optimum temperatures, the responses to 5 ppm toluene, formaldehyde, ethanol, acetone, etc., were measured to determine the selectivity of the sensors (Fig. 7). Among the different gases, all the sensors showed a higher response to xylene over the others, and as for the selectivity (the ratio of the highest response and the second high response), details are listed in Table 1. R1 is the highest response (to xylene), and “R2” is the second response. In the R2 column, T is for toluene, E is for ethanol, F is for formaldehyde, and A is for acetone. Compared with pure Co3O4, every Cr-doped Co3O4 showed an improvement in selectivity. On the other hand, with increasing ratio of Cr, the response to xylene of the sensors showed a tendency to rise before falling, and when the ratio of Cr was 5 at%, both the sensor’s response to xylene and its selectivity were at a maximum. So 5 at% was determined to be the best ratio of Cr-doping. The optimum temperature and response were compared with some reports already published for sensor response to xylene, shown in Table 2. | ||
| Fig. 7 Response to 5 ppm various gases of the sensors based on pure and different Cr-doped Co3O4 at their optimum operating temperature. | ||
| Ratio of Cr | Operating temperature (°C) | R1 | R2 | S (R1/R2) |
|---|---|---|---|---|
| 0 at% | 161 | 1.29 | 1.10 (T) | 1.17 |
| 1 at% | 139 | 2.18 | 1.33 (T) | 1.64 |
| 2 at% | 139 | 2.75 | 1.13 (E) | 2.43 |
| 3 at% | 139 | 3.69 | 1.30 (T) | 2.84 |
| 4 at% | 139 | 4.53 | 1.07 (F) | 4.23 |
| 5 at% | 139 | 6.38 | 1.20 (F) | 5.32 |
| 6 at% | 139 | 5.25 | 1.32 (A) | 3.98 |
| 7 at% | 139 | 4.69 | 1.1 (T,E) | 4.26 |
| No. | Materials | Concentration | Temp. (°C) | Response | Ref. |
|---|---|---|---|---|---|
| 1 | Co3O4 nanocubes | 100 ppm (xylene) | 200 | 6.45 | 19 |
| 2 | CuO flowers | 1000 ppm (xylene) | 260 | 3.6 | 29 |
| 3 | C-doped WO3 nanofibers | 50 ppm (xylene) | 370 | 199 | 30 |
| 4 | Pd functionalized WO3 nanowires | 1000 ppm (xylene) | 300 | 2.65 | 31 |
| 5 | Rh-catalyzed WO3 hollow spheres | 20 ppb (p-xylene) | 400 | 1.49 | 32 |
| 6 | SnO2 doped WO3 hollow microspheres | 100 ppm (xylene) | 300 | 46.91 | 33 |
| 7 | Pd-loaded SnO2 yolk–shell | 5 ppm (o-xylene) | 350 | 17.1 | 34 |
| 8 | Ag@SnO2 core–shell NPs | 5 ppm (p-xylene) | 300 | 16.17 | 35 |
| 9 | Mixed SnO2 NPs and MWCNTs | 3.6 ppm (xylene) | 380 | 8.64 | 36 |
| 10 | Au@NiO yolk–shell NPs | 5 ppm (p-xylene) | 350 | 7.93 | 37 |
| 11 | Mesoporous α-Fe2O3 nanostructures | 1000 ppm (xylene) | 340 | 17.54 | 38 |
| 12 | Cr-doped Co3O4 hierarchical nanostructures | 5 ppm (xylene) | 139 | 6.38 | This work |
The response and recovery behaviour is also a significant property for gas sensors. The response and recovery processes of different sensors in different concentrations of xylene gas are shown in Fig. 8c and d. All the responses reached a constant value fast, and step shaped obviously. All response times (Tres) were in the range of 15–30 s, and recovery times (Trec) in the range of 10–30 s, which indicates the pure and Cr-doped Co3O4 show excellent response–recovery properties.
In order to find out the relationship between the response value and the gas concentration, all the sensors were evaluated in different xylene concentrations ranging from 1 ppm to 100 ppm, as presented in Fig. 8b. The responses rise sharply in the concentration range of 1–20 ppm, and this approximate linear relationship (y = 1.9512x + 0.7682) between the response and xylene concentration shows the superiority of the sensors in the low concentration range. When the xylene concentration exceeds 20 ppm, the response of the sensors tends to saturate gradually, and the responses rise slowly or even become flat over 20 ppm. The detection limit of xylene for the sensor based on 5 at% Cr-doped Co3O4 hierarchical nanostructures is 1.15 ppm, when the criterion for gas detection is set to Rg/Ra > 3.39 All the above results clearly show that sensors based on Cr-doped Co3O4 hierarchical nanostructures are suitable for sensing in the low concentration range of 1–20 ppm.
3.3 Possible gas-sensing mechanism
Typically, a sensing mechanism can be explained through the theory of the resistance change of the sensor caused by the adsorption and desorption of gas molecules on the surface of the sensing material. When the sensor based on Cr-doped Co3O4 is exposed to air, oxygen molecules will adsorb onto the surface of the Cr-doped Co3O4 material to generate chemisorbed oxygen species (O2−, O− and O2−) by capturing electrons from the sensing material, so one effect of the aging process is to normalize the sensor, a stable state of the sensing material whose surface adsorbs oxygen ions from the air. When the sensor is surrounded by the detecting gas, the chemisorbed oxygen species will react with the gas molecules, the process of which is accompanied by electronic gain and loss, and the resistance of the sensor changes to shape a response step. The greater the amount of electronic gain and loss, the higher the response. The reaction equations involved in the above process are listed as follows:| O2(gas) ↔ O2(ads) | (1) |
| O2(ads) + e− ↔ O2(ads)− | (2) |
| O2(ads)− + e− ↔ 2O(ads)− | (3) |
| O(ads)− + e− ↔ O(ads)2− | (4) |
Co3O4 is a typical p-type semiconductor, which is mainly a hole carrier, and the resistance decreases with increasing hole concentration. The adsorption of negatively charged oxygen on the surface at the sensing temperature induces the accumulation of holes near the sensor surface. In this configuration, when the sensor is exposed to a reducing analyte gas, the reducing gas is oxidized by the negatively charged oxygen, thus conduction occurs along the conductive shell layers.
In general, a variety of gases will react with oxygen ions, so the pure and Cr-doped Co3O4 responded to many gases. But to xylene, the response of Cr-doped Co3O4 stands out, for the reason that the entry of Cr introduces active centres, which promote the reaction between oxygen ions and xylene molecules as depicted in Fig. 9, similar to Zn-doped SnO2,40 and the catalytic oxidation of methyl groups by Cr-doping has been reported.41 Regarding the substitution of Cr at the Co3+ site, it has to be mentioned that the ionic size of Cr3+ (0.615 Å) with the coordination number (CN) of 6 is approximately equal to the size of Co3+ (0.610 Å or 0.545 Å) with CN = 6. When xylene was introduced, the following reactions may occur on the surface of Cr-doped Co3O4:
 | (5) |
 | (6) |
 | ||
| Fig. 9 Diagram illustrating the influence of chromium substitution in the Co3O4 lattice phase on the area of intergrain contacts. | ||
The chemisorbed oxygen species react with the xylene due to the catalytic effect of the Cr-doped Co3O4, and the electrons captured by the chemisorbed oxygen species are returned to the sensing material. Consequently, the recombination between electrons and holes increased the resistance.
4. Conclusions
Pompon-like pure and Cr-doped Co3O4 hierarchical nanostructures were synthesized, characterized, and utilized for the fabrication of a xylene-sensing sensor. The effect of the proportion of Cr was investigated, and results showed 5 at% (Cr/Co) was the optimum ratio under which the pompon-like Cr-doped Co3O4 hierarchical nanostructures reached the highest response to 5 ppm xylene. The doping of Cr induced a significant enhancement in the detection of xylene, and also improved the selectivity of the material compared with the pure Co3O4 hierarchical nanostructures. In short, the presently constructed Cr-doped Co3O4 hierarchical nanostructures have potential in the application of xylene sensing.Acknowledgements
This work was supported by the National Natural Science Foundation of China (Grant No. 61404058 and 11574110), Project of Science and Technology Plan of Changchun City (Grant No. 14KG020) and Opened Fund of the State Key Laboratory on Integrated Optoelectronics (No. IOSKL2013KF10).Notes and references
- M. Gérin, J. Siemiatycki, M. Désy and D. Krewski, Am. J. Ind. Med., 1998, 34, 144–156 CrossRef.
- P. Nizamidin, A. Yimit, I. Nurulla and K. Itoh, ISRN Spectrosc., 2012, 2012, 1–6 CrossRef.
- M. Girschikofsky, M. Rosenberger, S. Belle, M. Brutschy, S. R. Waldvogel and R. Hellmann, Sens. Actuators, B, 2012, 171–172, 338–342 CrossRef CAS.
- B. Applegate, S. Kehrmeyer and G. Sayler, Appl. Environ. Microbiol., 1998, 64, 2730–2735 CAS.
- K.-Y. Choi, J.-S. Park, K.-B. Park, H. J. Kim, H.-D. Park and S.-D. Kim, Sens. Actuators, B, 2010, 150, 65–72 CrossRef CAS.
- T. Baimpos, L. Gora, V. Nikolakis and D. Kouzoudis, Sens. Actuators, A, 2012, 186, 21–31 CrossRef CAS.
- S. J. Pearton, F. Ren, Y.-L. Wang, B. H. Chu, K. H. Chen, C. Y. Chang, W. Lim, J. Lin and D. P. Norton, Prog. Mater. Sci., 2010, 55, 1–59 CrossRef.
- D. Wang, Q. Wang and T. Wang, Inorg. Chem., 2011, 50, 6482–6492 CrossRef CAS PubMed.
- D. Wang, Y. Yu, H. He, J. Wang, W. Zhou and H. D. Abruña, ACS Nano, 2015, 9, 1775–1781 CrossRef CAS PubMed.
- W. Hao, S. Chen, Y. Cai, L. Zhang, Z. Li and S. Zhang, J. Mater. Chem. A, 2014, 2, 13801–13804 CAS.
- X. Xia, J. Tu, Y. Zhang, X. Wang, C. Gu, X.-b. Zhao and H. J. Fan, ACS Nano, 2012, 6, 5531–5538 CrossRef CAS PubMed.
- T. Maruyama and S. Arai, J. Electrochem. Soc., 1996, 143, 1383–1386 CrossRef CAS.
- L.-J. Zhou, Y. Zou, G.-D. Li, X. Zou, J. Zhao, M. Fan, Y. Liu and D. Wang, RSC Adv., 2014, 4, 22951 RSC.
- F. Li, J. Chen, Q. Zhang and Y. Wang, Green Chem., 2008, 10, 553 RSC.
- X. Zhou, Z. Xia, Z. Tian, Y. Ma and Y. Qu, J. Mater. Chem. A, 2015, 3, 8107–8114 CAS.
- K. Deori and S. Deka, CrystEngComm, 2013, 15, 8465 RSC.
- L. F. Liotta, H. Wu, G. Pantaleo and A. M. Venezia, Catal. Sci. Technol., 2013, 3, 3085 CAS.
- S. Moon, N. M. Vuong, D. Lee, D. Kim, H. Lee, D. Kim, S.-K. Hong and S.-G. Yoon, Sens. Actuators, B, 2016, 222, 166–172 CrossRef CAS.
- C. Sun, X. Su, F. Xiao, C. Niu and J. Wang, Sens. Actuators, B, 2011, 157, 681–685 CrossRef CAS.
- Q. Feng, X. Li, J. Wang and A. M. Gaskov, Sens. Actuators, B, 2016, 222, 864–870 CrossRef CAS.
- F. Qu, C. Feng, C. Li, W. Li, S. Wen, S. Ruan and H. Zhang, Int. J. Appl. Ceram. Technol., 2014, 11, 619–625 CrossRef CAS.
- L. T. Hoa, J. S. Chung and S. H. Hur, Sens. Actuators, B, 2016, 223, 76–82 CrossRef CAS.
- J. Park, X. Shen and G. Wang, Sens. Actuators, B, 2009, 136, 494–498 CrossRef CAS.
- D. Barreca, D. Bekermann, E. Comini, A. Devi, R. A. Fischer, A. Gasparotto, M. Gavagnin, C. Maccato, C. Sada, G. Sberveglieri and E. Tondello, Sens. Actuators, B, 2011, 160, 79–86 CrossRef CAS.
- L. Zhu, D. Zhang, Y. Wang, C. Feng, J. Zhou, C. Liu and S. Ruan, RSC Adv., 2015, 5, 28105–28110 RSC.
- Y. Lin, W. Wei, Y. Li, F. Li, J. Zhou, D. Sun, Y. Chen and S. Ruan, J. Alloys Compd., 2015, 651, 690–698 CrossRef CAS.
- S. J. Hwang, K. I. Choi, J. W. Yoon, Y. C. Kang and J. H. Lee, Chemistry, 2015, 21, 5872–5878 CrossRef CAS PubMed.
- J. Xu, P. Gao and T. S. Zhao, Energy Environ. Sci., 2012, 5, 5333–5339 CAS.
- C. Yang, F. Xiao, J. Wang and X. Su, Sens. Actuators, B, 2015, 207, 177–185 CrossRef CAS.
- L. Deng, X. Ding, D. Zeng, S. Zhang and C. Xie, IEEE Sens. J., 2012, 12, 2209–2214 CrossRef CAS.
- F. Chávez, G. F. Pérez-Sánchez, O. Goiz, P. Zaca-Morán, R. Peña-Sierra, A. Morales-Acevedo, C. Felipe and M. Soledad-Priego, Appl. Surf. Sci., 2013, 275, 28–35 CrossRef.
- K.-I. Choi, S.-J. Hwang, Z. Dai, Y. C. Kang and J.-H. Lee, RSC Adv., 2014, 4, 53130–53136 RSC.
- Y. Gui, F. Dong, Y. Zhang, Y. Zhang and J. Tian, Mater. Sci. Semicond. Process., 2013, 16, 1531–1537 CrossRef CAS.
- Y. J. Hong, J. W. Yoon, J. H. Lee and Y. C. Kang, Chemistry, 2014, 20, 2737–2741 CrossRef CAS PubMed.
- P. Rai, S. M. Majhi, Y.-T. Yu and J.-H. Lee, RSC Adv., 2015, 5, 17653–17659 RSC.
- K.-Y. Choi, J.-S. Park, K.-B. Park, H. J. Kim, H.-D. Park and S.-D. Kim, Sens. Actuators, B, 2010, 150, 65–72 CrossRef CAS.
- P. Rai, J. W. Yoon, H. M. Jeong, S. J. Hwang, C. H. Kwak and J. H. Lee, Nanoscale, 2014, 6, 8292–8299 RSC.
- Y. Li, Y. Cao, D. Jia, Y. Wang and J. Xie, Sens. Actuators, B, 2014, 198, 360–365 CrossRef CAS.
- F. Qu, Y. Wang, Y. Wang, J. Zhou and S. Ruan, RSC Adv., 2014, 4, 24211 RSC.
- Y. Wang, D. Jiang, W. Wei, L. Zhu, L. Shen, S. Wen and S. Ruan, RSC Adv., 2015, 5, 50336 RSC.
- H. J. Kim, J. W. Yoon, K. I. Choi, H. W. Jang, A. Umar and J. H. Lee, Nanoscale, 2013, 5, 7066–7073 RSC.
| This journal is © The Royal Society of Chemistry 2016 |

