
Synthesis and properties of the derivatives of triphenylamine and 1,8-naphthalimide with the olefinic linkages between chromophores†
Dalius Gudeikaa,
Gjergji Sinib,
Vygintas Jankauskasc,
Galyna Sycha and
Juozas V. Grazulevicius*a
aDepartment of Polymer Chemistry and Technology, Kaunas University of Technology, Radvilenu pl. 19, LT-50254 Kaunas, Lithuania. E-mail: juozas.grazulevicius@ktu.lt; Fax: +370 37 300152; Tel: +370 37 300193
bLaboratoire de Physicochimie des Polymères et des Interfaces, EA 2528 Université de Cergy-Pontoise, 5 mail Gay-Lussac, 95031 Cergy-Pontoise, France
cDepartment of Solid State Electronics, Vilnius University, Sauletekio aleja 9, LT-10222 Vilnius, Lithuania
First published on 23rd December 2015
Abstract
Two donor–acceptor type molecules consisting of triphenylamine and 1,8-naphthalimide moieties with the olefinic linkages between chromophores were synthesized by Heck reaction. The compounds obtained are capable of forming molecular glasses with glass transition temperatures of 56 and 75 °C recorded for mono- and di-substituted derivatives of triphenylamine, respectively. They exhibit high thermal stabilities with 5% weight loss temperatures of 350 and 363 °C. Fluorescence quantum yields of the dilute solutions of the synthesized compounds range from 0.065 to 0.72 while those of the solid films are 0.028 and 0.034. The Stokes shifts increased with the increase of the solvent polarity. Cyclic voltammetry measurements revealed close values of the solid state ionization potentials (5.22 and 5.27 eV) and of electron affinities (−3.20 and −3.18 eV). For the layer of the monosubstituted derivative of triphenylamine core hole mobility was found to be 2.1 × 10⁻³ cm2 V−1 s−1. Good intrinsic hole transport parameters were theoretically estimated in the frame of Marcus theory, and the impact of polaron-type hole transport in these materials is discussed.
Introduction
Compounds having intramolecular charge transfer (ICT) properties usually consist of electron donating (D) and electron accepting (A) groups linked through a π-conjugated bridge which makes it possible to reduce the band gap between ionization potential and electron affinity values. Donor–π–acceptor (D–π–A) type organic compounds are regarded as promising organic semiconducting materials due to their broad absorption in the visible region resulting from ICT, easily tuned electronic energy levels and band gaps through adjusting the acceptor, donor, and π-conjugated bridge moieties.1,2So far, among the different classes of organic π-conjugated systems reported, the derivatives of electron donating triphenylamine (TPA) have been widely investigated as hole transporting materials for organic light emitting diodes (OLEDs) and other optoelectronic devices.3–7 Owing to the noncoplanarity of the phenyl rings, TPA derivatives can be viewed as 3D systems and their combination with linear π-conjugated systems can be expected to lead to amorphous molecular materials with good hole-transporting capability.8–12 It is well known that the central nitrogen atom is responsible for the donor behavior of arylamine compounds which are widely investigated and used in various optoelectronic and electronic devices, such as dye-sensitized solar cells,13 OLEDs,14 organic field-effect transistors,15 non-linear optical devices,16 and sensors.17 Numerous experimental and theoretical studies were carried out in order to find correlations between the structure and properties of the derivatives of TPA.18–22
So far, the use of the concept of A–D system in 1,8-naphthalimide chemistry was rather limited. Much attention has been paid to the design and synthesis of new 1,8-naphthalimide architectures. The optical, photophysical, photoelectrical, electrochemical properties of 1,8-naphthalimide derivatives are determined by the nature of the substituents. Linking of electron donating groups at C-4 position of the naphthalic ring gives a “push–pull” electronic configuration and generate ICT excited states.23–25 This ICT character leads to a large excited-state dipole moment and broad absorption and emission bands at longer wavelengths. ICT transition is highly solvent dependent, and the photophysical properties of the compounds with ICT character, such as the wavelengths of the maxima of absorption and emission spectra, the fluorescence lifetimes as well as the fluorescence quantum yields, are all affected by the properties of solvents.26
Recently, we reported on the synthesis of the electroactive compounds containing electron donating TPA fragments as cores and electron accepting 1,8-naphthalimide moieties as arms.27–29 Introduction of ethenyl or ethynyl units as spacers helped the compounds to acquire planarity.
In this work, two new charge transporting derivatives TPA and 1,8-naphthalimide with the olefinic linkages between electrophores were designed and synthesized with the aim of getting the further information of the structure–properties relationship of the donor–acceptor derivatives.
Experimental methods
Instrumentation
Melting points (Mp) of the compounds were estimated using Electrothermal Mel-Temp apparatus. 1H NMR and 13C NMR spectra were obtained on Varian Unity Inova (300 MHz for 1H, 75.4 MHz for 13C). Mass (MS) spectra were recorded with Waters ZQ 2000. Elemental analysis was carried out with an Exeter Analytical CE-440 Elemental Analyzer. Infrared (IR) spectra were recorded using Perkin Elmer Spectrum GX spectrometer. Differential scanning calorimetry (DSC) measurements were carried out using a Perkin-Elmer DSC-7 series thermal analyzer at a heating rate of 10 °C min−1 under nitrogen flow. Thermogravimetric analysis (TGA) was performed on a Mettler Toledo TGA/SDTA 851e. UV spectra were recorded with Hitachi U-3000 spectrometer. Fluorescence measurements of the dilute solutions and of the solid films of the compounds were performed using spectrometer FS980. For these measurements, the dilute solutions of the investigated compounds were prepared by dissolving them in a spectral grade solvent at 10−5 M concentration. The drop-casting from THF solutions (10−3 M) was employed to prepare thin solid films of the compounds. Fluorescence quantum yields (ΦF) of the solutions were estimated by using integrated sphere method.30 Cyclic voltammetry (CV) measurements were carried out by a three-electrode assembly cell from Bio-Logic SAS and a micro-AUTOLAB Type III potentiostat-galvanostat. The measurements were carried out in a solution of dry dichloromethane containing 0.1 M tetrabutylammonium hexafluorophosphate (n-Bu4NPF6) at 25 °C, scan rate 50 mV s−1, sample concentration 10−5 M. The potentials were measured against Ag/AgNO3 as reference electrode, platinum wire was used as counter electrode. The experiments were calibrated with the standard ferrocene/ferrocenium (Fc/Fc+) redox system.31The ionization potentials (IPPE) of the layers of the compounds were measured by the electron photoemission method in air.32 The samples were fabricated by means of vacuum deposition of the compounds onto Al coated glass substrate under vacuum below 5 × 10⁻⁶ mbar. The negative voltage of 500 V was supplied to the sample substrate. Then the layers were illuminated with the monochromatic light from the deep UV deuterium light source ASBN-D130-CM and CM110 1/8m monochromator. The counter-electrode was connected to the input of the 6517B Keithley electrometer for the photocurrent measurement. The photocurrent was strongly dependent on the incident light photon energy. An energy scan of the incident photons was performed while increasing the photon energy. In this scan direction, no electrons were emitted until the photon energy exceeded the ionization potential (IPPE) of the compounds.
Hole mobilities (μh) of the layers of the compounds and of their molecular mixtures with bisphenol Z polycarbonate (PC-Z) were estimated by xerographic time-of-flight (XTOF) method as described earlier.33 The electric field was created by positive corona charging. The charge carriers were generated at the layer surface by illumination with pulses of nitrogen laser (pulse duration was 1 ns, wavelength 337 nm). As a result of pulsed illumination the layer surface potential decreased down to 1–5% of the initial potential. The capacitance probe connected to the wide frequency band electrometer measured the rate of the surface potential decrease dU/dt. The transit time tt for the samples with the transporting material was determined from the kink of the curve of the dU/dt transient in log–log scale. The hole-drift mobility was calculated by using the formula μ = d2/U0tt, where d is the layer thickness, and U0 the surface potential at the moment of illumination. The layers were casted from the solutions of compounds 4, 5 in THF. The substrates were glass plates with a conductive polyester films with an Al layer. After coating and drying at the room temperature the samples were heated at 80 °C for 1 h. The thickness of the charge-transporting layers varied in the range of 2.8–6.0 μm.
Materials
4-Bromo-1,8-naphthalic anhydride, 2-ethylhexylamine were purchased from TCI, triphenylamine, triethylamine (TEA), palladium acetate(II) (Pd(OAc)2), tri(o-tolyl)phosphine (P(o-tolyl)3), acrolein diethyl acetal, tetrabutylammonium acetate (n-Bu4NOAc), N-bromosuccinimide (NBS) were purchased from Aldrich and used as received. Dimethylformamide (DMF, Lachema) was dried by distillation over CaH2. THF was dried and distilled over sodium and benzophenone. Dichloromethane (POCH), ethyl acetate and n-hexane (Penta) were purified and dried using the standard procedures.344-Bromo-N-(2-ethylhexyl)-1,8-naphthalimide (BrIM),35 mp = 82–83 °C, N,N-diphenyl-4-bromoaniline (1a),36 mp = 106–107 °C, bis(4-bromophenyl)phenylamine (1b),37 (E)-4-(4-(diphenylamino)phenyl)acrylaldehyde, (2a),38 mp = 97–98 °C, N-(4-((E)-buta-1,3-dienyl)phenyl)-N-phenylbenzenamine (2b),39 (E)-4-{4-[(E)-4-formyl-1-ethenyl]-(4,4′-(diphenylamino)phenyl)}acrylaldehyde (3a),40 mp = 121–122 °C were prepared according to the published procedures.
![[thin space (1/6-em)]](https://www.rsc.org/images/entities/char_2009.gif) :1) to obtain amorphous compound 3b with the yield of 0.24 g (52%). Rf = 0.32 (n-hexane/ethyl acetate, 9:1); 1H NMR (300 MHz, CDCl3, 25 °C, δ, ppm): 7.32–7.25 (m, 6H, –Ar), 7.14–7.11 (m, 2H, 2×–CH
:1) to obtain amorphous compound 3b with the yield of 0.24 g (52%). Rf = 0.32 (n-hexane/ethyl acetate, 9:1); 1H NMR (300 MHz, CDCl3, 25 °C, δ, ppm): 7.32–7.25 (m, 6H, –Ar), 7.14–7.11 (m, 2H, 2×–CH![[double bond, length as m-dash]](https://www.rsc.org/images/entities/char_e001.gif) C
C![[H with combining low line]](https://www.rsc.org/images/entities/char_0048_0332.gif) –CHCH2), 7.09–7.05 (m, 3H, –Ar, 2×–CCH–CHCH2), 6.79–6.66 (m, 8H, –Ar, 2×–CHCH–CCH2), 5.32 (d, 2H, J = 10.1 Hz, –CHCH–CHC2), 5.16 (d, 2H, J = 10.1 Hz, –CHCH–CHC2). 13C NMR (75.4 MHz, CDCl3, 25 °C, δ, ppm): 141.4, 141.2, 134.7, 130.8, 128.9, 127.4, 126.4, 124.5, 123.3, 122.7, 118.4, 115.6. MS (APCI+, 20 V): m/z: 350 ([M + H]+). IR, (KBr), cm−1: 3025 ν (CHar); 2958, 2878 ν (CHaliphatic); 1655, 1581, 1498 ν (CCar); 1358, 1325, 1266 ν (C–N); 967 γ (trans, –CHCH–CHCH2); 772, 754, 688 γ (CHar). Elemental analysis calc (%) for C26H23N: C 89.36, H 6.63, N 4.01; found C 89.33, H 6.67, N 4.04.:8, V:V) as an eluent to obtain 4 as red crystals with the yield of 0.42 g (54%). It was recrystallized from the mixture of solvents of the eluent. Rf = 0.41 (n-hexane/ethyl acetate, 8:1); mp = 182–183 °C. 1H NMR spectrum (300 MHz, CDCl3, 25 °C, δ, ppm): 8.64 (dd, 1H, J1 = 7.2 Hz, J2 = 2.8 Hz, –Ar), 8.57 (dd, 1H, J1 = 4.8 Hz, J2 = 2.8 Hz, –Ar), 8.55 (d, 1H, J = 4.8 Hz, –Ar), 7.97 (d, 1H, J = 7.2 Hz, –Ar), 7.78 (dd, 1H, J1 = 8.5 Hz, J2 = 7.2 Hz, –Ar), 7.47–7.33 (m, 6H, –Ar), 7.29–7.23 (m, 2H, –CHC–CCH–), 7.19–7.12 (m, 4H, –Ar, –CCH–CHC–), 7.10–6.99 (m, 5H, –Ar), 6.82 (d, 1H, J = 8.5 Hz, –Ar), 4.33–4.03 (m, 2H, –CHaliph), 2.04–1.93 (m, 1H, –CHaliph), 1.49–1.26 (m, 8H, –CHaliph), 1.02–0.86 (m, 6H, –CHaliph). 13C NMR (75.4 MHz, CDCl3, 25 °C, δ, ppm): 164.8, 148.6, 147.3, 141.3, 137.8, 134.2, 133.5, 131.8, 129.3, 129.3, 129.2, 129.1, 128.9, 128.0, 127.2, 126.4, 125.8, 125.8, 125.8, 123.5, 123.2, 123.1, 122.7, 122.6, 122.5, 121.3, 44.6, 37.2, 31.8, 29.1, 25.3, 23.6, 14.4, 11.9. IR, (KBr), cm−1: 3032 ν (CHar); 2956, 2928, 2858 ν (CHaliphatic); 1697 ν (COimide); 1660, 1583, 1505, 1488 ν (CCar); 1354, 1332, 1274 ν (C–N); 988 γ (trans, –CHCH–CHCH); 778, 754, 693 γ (CHar). MS (APCI+, 20 V): m/z: 605 ([M + H]+). Elemental analysis calc (%) for C42H40N2O2: C 83.41, H 6.67, N 4.63, O 5.29; found C 83.44, H 6.65, N 4.59.:8, v:v) as an eluent to obtain 5 as red crystals with the yield of 0.51 g (37%). It was recrystallized from the mixture of solvents of the eluent. Rf = 0.39 (n-hexane/ethyl acetate, 8:1); mp = 155–156 °C. 1H NMR (300 MHz, CDCl3, 25 °C, δ, ppm): 8.62 (dd, 2H, J1 = 7.7 Hz, J2 = 4.9 Hz, –Ar), 8.55 (dd, 3H, J1 = 9.8 Hz, J2 = 4.9 Hz, –Ar), 7.96 (dd, 2H, J1 = 7.7 Hz, J2 = 4.9 Hz, –Ar), 7.80–7.75 (m, 3H, –Ar), 7.48–7.39 (m, 6H, –Ar), 7.35–7.28 (m, 4H, –Ar, 2×–CHC–CCH–), 7.26–7.15 (m, 5H, –Ar, 2×–CCH–CHC–), 7.13–6.99 (m, 4H, –Ar), 6.62 (d, 2H, J = 9.8 Hz, –Ar), 4.19–4.08 (m, 4H, –CHaliph), 2.01–1.91 (m, 2H, –CHaliph), 1.44–1.30 (m, 16H, –CHaliph), 1.00–0.85 (m, 12H, –CHaliph). 13C NMR (75.4 MHz, CDCl3, 25 °C, δ, ppm): 165.3, 148.2, 143.9, 141.2, 140.5, 137.8, 137.3, 133.2, 131.9, 129.3, 129.3, 128.2, 128.2, 127.8, 127.5, 126.2, 125.9, 125.6, 125.3, 125.2, 123.2, 123.2, 122.7, 122.4, 122.3, 44.3, 37.2, 31.9, 29.3, 25.3, 23.4, 14.3, 11.3. IR, (KBr), cm−1: 3048 ν (CHar); 2953, 2926, 2862 ν (CHaliphatic); 1699 ν (COimide); 1659, 1582, 1501, 1479 ν (CCar); 1353, 1330, 1278 ν (C–N); 981 γ (trans, –CHCH–CHCH); 779, 751, 697 γ (CHar). MS (APCI+, 20 V): m/z: 965 ([M + H]+). Elemental analysis calc (%) for C66H65N3O4: C 82.21, H 6.79, N 4.36, O 6.64; found C 82.25, H 6.72, N 4.33.
–CHCH2), 7.09–7.05 (m, 3H, –Ar, 2×–CCH–CHCH2), 6.79–6.66 (m, 8H, –Ar, 2×–CHCH–CCH2), 5.32 (d, 2H, J = 10.1 Hz, –CHCH–CHC2), 5.16 (d, 2H, J = 10.1 Hz, –CHCH–CHC2). 13C NMR (75.4 MHz, CDCl3, 25 °C, δ, ppm): 141.4, 141.2, 134.7, 130.8, 128.9, 127.4, 126.4, 124.5, 123.3, 122.7, 118.4, 115.6. MS (APCI+, 20 V): m/z: 350 ([M + H]+). IR, (KBr), cm−1: 3025 ν (CHar); 2958, 2878 ν (CHaliphatic); 1655, 1581, 1498 ν (CCar); 1358, 1325, 1266 ν (C–N); 967 γ (trans, –CHCH–CHCH2); 772, 754, 688 γ (CHar). Elemental analysis calc (%) for C26H23N: C 89.36, H 6.63, N 4.01; found C 89.33, H 6.67, N 4.04.:8, V:V) as an eluent to obtain 4 as red crystals with the yield of 0.42 g (54%). It was recrystallized from the mixture of solvents of the eluent. Rf = 0.41 (n-hexane/ethyl acetate, 8:1); mp = 182–183 °C. 1H NMR spectrum (300 MHz, CDCl3, 25 °C, δ, ppm): 8.64 (dd, 1H, J1 = 7.2 Hz, J2 = 2.8 Hz, –Ar), 8.57 (dd, 1H, J1 = 4.8 Hz, J2 = 2.8 Hz, –Ar), 8.55 (d, 1H, J = 4.8 Hz, –Ar), 7.97 (d, 1H, J = 7.2 Hz, –Ar), 7.78 (dd, 1H, J1 = 8.5 Hz, J2 = 7.2 Hz, –Ar), 7.47–7.33 (m, 6H, –Ar), 7.29–7.23 (m, 2H, –CHC–CCH–), 7.19–7.12 (m, 4H, –Ar, –CCH–CHC–), 7.10–6.99 (m, 5H, –Ar), 6.82 (d, 1H, J = 8.5 Hz, –Ar), 4.33–4.03 (m, 2H, –CHaliph), 2.04–1.93 (m, 1H, –CHaliph), 1.49–1.26 (m, 8H, –CHaliph), 1.02–0.86 (m, 6H, –CHaliph). 13C NMR (75.4 MHz, CDCl3, 25 °C, δ, ppm): 164.8, 148.6, 147.3, 141.3, 137.8, 134.2, 133.5, 131.8, 129.3, 129.3, 129.2, 129.1, 128.9, 128.0, 127.2, 126.4, 125.8, 125.8, 125.8, 123.5, 123.2, 123.1, 122.7, 122.6, 122.5, 121.3, 44.6, 37.2, 31.8, 29.1, 25.3, 23.6, 14.4, 11.9. IR, (KBr), cm−1: 3032 ν (CHar); 2956, 2928, 2858 ν (CHaliphatic); 1697 ν (COimide); 1660, 1583, 1505, 1488 ν (CCar); 1354, 1332, 1274 ν (C–N); 988 γ (trans, –CHCH–CHCH); 778, 754, 693 γ (CHar). MS (APCI+, 20 V): m/z: 605 ([M + H]+). Elemental analysis calc (%) for C42H40N2O2: C 83.41, H 6.67, N 4.63, O 5.29; found C 83.44, H 6.65, N 4.59.:8, v:v) as an eluent to obtain 5 as red crystals with the yield of 0.51 g (37%). It was recrystallized from the mixture of solvents of the eluent. Rf = 0.39 (n-hexane/ethyl acetate, 8:1); mp = 155–156 °C. 1H NMR (300 MHz, CDCl3, 25 °C, δ, ppm): 8.62 (dd, 2H, J1 = 7.7 Hz, J2 = 4.9 Hz, –Ar), 8.55 (dd, 3H, J1 = 9.8 Hz, J2 = 4.9 Hz, –Ar), 7.96 (dd, 2H, J1 = 7.7 Hz, J2 = 4.9 Hz, –Ar), 7.80–7.75 (m, 3H, –Ar), 7.48–7.39 (m, 6H, –Ar), 7.35–7.28 (m, 4H, –Ar, 2×–CHC–CCH–), 7.26–7.15 (m, 5H, –Ar, 2×–CCH–CHC–), 7.13–6.99 (m, 4H, –Ar), 6.62 (d, 2H, J = 9.8 Hz, –Ar), 4.19–4.08 (m, 4H, –CHaliph), 2.01–1.91 (m, 2H, –CHaliph), 1.44–1.30 (m, 16H, –CHaliph), 1.00–0.85 (m, 12H, –CHaliph). 13C NMR (75.4 MHz, CDCl3, 25 °C, δ, ppm): 165.3, 148.2, 143.9, 141.2, 140.5, 137.8, 137.3, 133.2, 131.9, 129.3, 129.3, 128.2, 128.2, 127.8, 127.5, 126.2, 125.9, 125.6, 125.3, 125.2, 123.2, 123.2, 122.7, 122.4, 122.3, 44.3, 37.2, 31.9, 29.3, 25.3, 23.4, 14.3, 11.3. IR, (KBr), cm−1: 3048 ν (CHar); 2953, 2926, 2862 ν (CHaliphatic); 1699 ν (COimide); 1659, 1582, 1501, 1479 ν (CCar); 1353, 1330, 1278 ν (C–N); 981 γ (trans, –CHCH–CHCH); 779, 751, 697 γ (CHar). MS (APCI+, 20 V): m/z: 965 ([M + H]+). Elemental analysis calc (%) for C66H65N3O4: C 82.21, H 6.79, N 4.36, O 6.64; found C 82.25, H 6.72, N 4.33.Computational details
The calculations in this study were carried out in the frame of density functional methods (DFT).41 B3LYP42,43 functional was used for the calculation of molecular properties, whereas the ωB97X-D44 functional was used during the geometry optimizations of dimers constituted from like molecules. The geometry of all molecules in their neutral and cationic states were optimized without symmetry constraints by using the 6-31G(d,p) basis set. The vertical ionization potentials (Ip) were calculated at the neutral state geometry as energy difference between neutral and cation species. All calculations were performed by using the Gaussian 09 program.45The absorption spectra of compounds 4 and 5 were obtained by means of time dependent DFT (TDDFT)46–50 calculations at the B3LYP/6-31G(d,p) level. The theoretical absorption bands were obtained by using Gaussview (version 5) software.51
The internal reorganization energies (λi) for holes were calculated by mean of the following eqn (1):52
 | (1) |
 for instance, being the energy of the cationic species (M+) in the geometry of the neutral molecule (M).
For each model dimer, the HOMO–HOMO electronic couplings were calculated at the B3LYP/6-31G(d,p) level, by using the fragment orbital method (also known as the “direct calculation” or “two state model”).53–55
Results and discussion
Synthesis and characterization
Scheme 1 shows the synthetic routes to the target compounds. The first step was condensation of 4-bromo-1,8-naphthalic anhydride (BrA) with 2-ethylhexylamine in DMF which gave 4-bromo-N-(2-ethylhexyl)-1,8-naphthalimide (BrIM). Compounds 1a,b were prepared by bromination of TPA with NBS. The reactions of 1a,b with acrolein diethyl acetal afforded cinnamaldehydes 2a,b. Compounds 3a,b were prepared by the reactions of cinnamaldehydes 2a,b with methyltriphenylphosphonium bromide. The final steps were Heck reactions of BrIM with 3a,b in the presence of palladium(II) acetate and tri(o-tolyl)phosphine to obtain the target compounds 4 and 5. All the derivatives were characterized by 1H and 13C NMR, mass spectrometries and elemental analysis. The target compounds (4, 5) were found to be soluble in various organic solvents such as dichloromethane (DCM), chloroform, tetrahydrofuran (THF), toluene and etc. | ||
| Scheme 1 The synthetic routes to 4, 5. | ||
Thermal properties
The thermal properties of compounds 4, 5 were investigated by thermogravimetric analysis (TGA) and differential scanning calorimetry (DSC) under a nitrogen atmosphere. The values of glass transition temperatures (Tg), melting points (Tm) and 5% weight loss temperatures (TID-5%) are summarized in Table 1.Compounds 4 and 5 were isolated after the synthesis as crystalline compounds, however they could be transformed into the glassy state by heating from the melts. Their behavior in DSC experiments was similar, therefore DSC curves of only one compound (4) are given in Fig. 1a. TID-5% for 4 and 5 were observed at 350 and 363 °C, respectively (Fig. 1b). These values indicate the relatively high thermal stability of the compounds. TID-5% increased with increase of the number of naphthalimide arms. These results are in agreement the previously reported data on the thermal stability of the other derivatives of naphthalimide and TPA.27,28
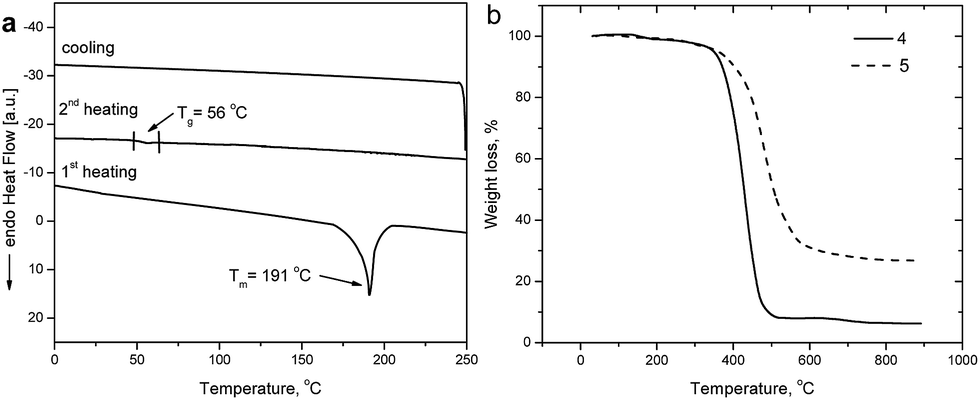 | ||
| Fig. 1 (a) DSC thermograms of 4; (b) TGA curves of 4 and 5. | ||
In the first heating scans compounds 4 and 5 revealed endothermic melting peaks at 191 and 159 °C, respectively. No crystallization was observed during the cooling scans. In the second heating scans compounds 4 and 5 showed glass transitions at 56 and 75 °C, respectively and no crystallization was observed on the following heating. Tg values of 4 and 5 were slightly lower than those of the earlier reported corresponding derivatives of naphthalimide and TPA with the different (shorter) linkages between the chromophores.27–29
Geometry and electronic properties of model compounds
The geometrical structures of the model compounds M4 and M5 are shown in Fig. 2. While the three N–C bonds are situated in the same plane (“N-plane”), a propeller-like geometry is found around the TPA N atoms. Ph-“N-plane” dihedral angles are larger for the non-substituted versus substituted phenyl groups (−44.5 and −34.3°, respectively in the case of compound M4, and −46.5 and −37.7° in the case of M5). The effect of TPA-butadiene linking appears through shortening of N–C(Ph) distances and decreasing of Ph-“N-plane” dihedral angles. However, there is less free room for two short N–C distances in the case of M5 as compared to M4, which is consequently reflected in larger Ph-“N-plane” dihedral angles for M5. The butadiene moieties lie in the same plane as the internal TPA phenyl groups, but form dihedral angles of roughly 25° with the naphthalimide group(s). | ||
| Fig. 2 Geometrical structures of model compounds M4 and M5, containing methyl groups instead of ethyl-hexyl ones (B3LYP/6-31G(d,p) level in “gas phase”). | ||
HOMO and LUMO of model compounds M4 and M5 are given in Fig. 3. Both HOMOs are basically localized on the TPA and butadiene moieties (Fig. 3), with the dominant contribution coming from the TPA moiety. Similarly, the naphthalimide and butadiene moieties are found to contribute to the LUMOs, with practically no contribution from the TPA core.
 | ||
| Fig. 3 HOMO and LUMO representations of compounds M4 and M5. The red dashed circles delimit the TPA moiety. | ||
The energies of the frontier orbitals are given in Table 2. Both HOMO and LUMO energies decrease with increasing number of naphthalimide-butadiene-groups. This is the expected result for LUMO energies, due to some degree of interaction between the two branches. The decrease in HOMO energy seems to depend on two effects: while the attractor effect of naphthalimide groups may contribute to this effect, the increasing Ph-“N-plane” dihedral angles in the order M4 < M5 also plays in the same sense. However, the evolution of LUMO energy is faster than for HOMO, so that the HOMO–LUMO gap is by 0.08 eV smaller for M5 than for M4.
| Compound | Eoxonset vs. Fca/V | Eredonset vs. Fca/V | IPCVb (eV) | EACVb (eV) | Eelcgc (eV) | Eoptgd (eV) | IPPEe (IPV) (eV) | εHOMOf (eV) | εLUMOf (eV) | EH–Lg (eV) |
|---|---|---|---|---|---|---|---|---|---|---|
| a Eoxonset and Eredonset measured vs. Fc/Fc+.b Ionization potentials and electron affinities estimated according to IPCVc = (Eoxonset + 4.8) [eV]. EACV = −(Eredonset + 4.8)[eV] (where, Eoxonset and Eredonset are the onset reduction and oxidation potentials versus the Fc/Fc+). Eoxonset and Eredonset of Fc/Fc+ measured in DCM solution containing 0.1 M n-Bu4NPF6 was 0.275 V vs. Fc/Fc+.c Eelcg = |IPCV| − |EACV|, where Eelcg is the electrochemical band gap.d The optical band gap estimated from the onset wavelength of optical absorption of dilute solution, according to the formula: Eoptg = E/e, where e = 1.6 × 10⁻¹⁹ C, E = hc/λedge h = 6.63 × 10⁻³⁴ J s, and c = 3.0 × 10⁸ m s−1, in which the λedge is the onset value of absorption spectra in long wave direction.e IPPE corresponds to the electron photoemission IP values. IPV are the theoretical vertical IP (given in parentheses).f HOMO (εHOMO) and LUMO (εLUMO) energies.g HOMO–LUMO gap (EH–L) for model compounds M4 and M5 (B3LYP/6-31G(d,p), gas phase). | ||||||||||
| 4 | 0.45 | −1.60 | 5.25 | −3.20 | 2.05 | 2.12 | 5.47 (6.09) | −5.02 | −2.49 | 2.53 |
| 5 | 0.42 | −1.63 | 5.22 | −3.18 | 2.04 | 2.09 | 5.49 (5.98) | −5.09 | −2.64 | 2.45 |
Electrochemical and photoelectron emission properties
The electrochemical properties of compounds 4 and 5 were investigated by CV. As it is shown in Fig. 4 compounds 4 and 5 showed ambipolar redox behavior with only one quasi-reversible oxidation and reduction couple waves around −1.5 and 1.5 V respectively (vs. Ag/AgNO3). The results of the electrochemical measurements are listed in Table 2. The reduction peak is predetermined by withdrawing nature of naphthalimide moieties, while one quasi-reversible oxidation peak is predetermined by the electron donating nature of TPA moiety.14 Compound 5 possesses the slightly lower onset oxidation potential than compound 4. In the reductive potential region, the reduction processes started at −1.60 and −1.63 V, for compounds 4 and 5, respectively. As a result, electrochemical band gaps of compounds 4 and 5 were found to be comparable (2.05 and 2.04 eV, respectively). These values are somewhat lower than the corresponding optical band gap (Eoptg) values observed for the solutions of 4, 5 (Table 2). Similar Eoptg and Eelcg values were also observed for the previously reported TPA and naphthalimide derivatives.26,27 The solid state ionization potentials (IPCV) of 4 and 5 were found to be very close, 5.25 and 5.22 eV, respectively. A similar observation applies to electron affinities (EACV) of −3.20 and −3.18 eV, respectively. These values are comparable to those of the other derivatives of TPA and naphthalimide.27,28 | ||
| Fig. 4 CV curves of 4 and 5 (10−5 M solutions in CH2Cl2 with 0.1 M n-Bu4NPF6). | ||
The solid state ionization potentials (IPPE) of the synthesized compounds were also estimated by the electron photoemission technique under ambient conditions. Fig. 5 shows the electron photoemission spectra of the films of compounds 4 and 5. Comparable values of IPPE of 5.47 and 5.49 eV were established for compounds 4 and 5 by extrapolation of the linear parts of the spectra to zero photocurrent. The ionization potentials established by electron photoemission spectrometry were slightly higher than those estimated by CV, also exhibiting an opposite trend. Importantly, the values of IPPE of 4 and 5 were found to be by ca. 0.15 eV lower than those of the earlier reported derivatives of TPA and naphthalimide in which the chromophores were linked via the linkages containing the single and double bonds.25–27 Thus, the layers of compounds 4 and 5 are expected to exhibit lower injection barriers of holes from the electrode and therefore they could be more suitable for the electroluminescent devices.56
 | ||
| Fig. 5 Electron photoemission spectra of the solid films of compounds 4 and 5. | ||
The theoretical IPV values for M4 and M5 (6.09 and 5.98 eV, Table 2) exhibit a larger difference (−0.11 eV) as compared to IPCV and IPPE values (−0.03 and 0.02 eV, respectively). This might be due to the decreased dihedral angles and their variations in the solid state, making the influence of this factor on the HOMO energy being less important than in the gas phase (see section Geometry and electronic properties of model compounds).
Optical and photophysical properties
Absorption and fluorescence (FL) spectra of the dilute solutions (10−5 mol L−1) in non-polar toluene and of the solid films of the derivatives of TPA and naphthalimide (4 and 5) are shown in Fig. 6. The wavelengths of the absorption maxima, molar extinction coefficients (ε), the wavelengths of fluorescence maxima, fluorescence quantum yields (ΦF), Stokes shifts observed for the dilute solutions in seven different organic solvents are summarized in Table 3. | ||
| Fig. 6 UV-vis (dashed thin line) spectra of 10−5 M solutions of 4, 5 in toluene; normalized fluorescence spectra of the dilute solutions in toluene (thick, solid line), and of the solid films (dashed grey line). The long-wavelength absorption maxima wavelengths were used as excitation wavelengths. | ||
| Solvent (viscosity ×10−3 Pa s/dipole moment (D)) | 4 | 5 | ||||
|---|---|---|---|---|---|---|
| λabsa/nm (ε/M−1 cm−1) | λemb/nm (ΦF)c | Stokes shift/nm, cm−1 | λabsa/nm (ε/M−1 cm−1) | λemb/nm (ΦF)c | Stokes shift/nm, cm−1 | |
| a λabs – absorption maximum.b λem – emission maximum.c ΦF – quantum yield. | ||||||
| Cyclohexane (0.898/0) | 457 (1.43) | 523, 563 (0.51) | 106, 4120 | 466 (2.57) | 527, 567 (0.72) | 101, 3823 |
| Toluene (0.552/0.36) | 460 (1.88) | 594 (0.40) | 134, 4904 | 443 (2.76) | 583 (0.21) | 107, 5421 |
| THF (0.461/1.75) | 461 (1.34) | 686 (0.14) | 225, 7115 | 476 (1.69) | 696 (0.081) | 220, 6641 |
| Acetone (0.304/2.88) | 463 (1.27) | 753 (0.15) | 295, 8318 | 464 (1.45) | 752 (0.067) | 288, 8254 |
| Acetonitrile (0.3409/3.92) | 465 (0.86) | 758 (0.13) | 294, 8313 | 468 (1.23) | 755 (0.065) | 284, 8122 |
| Solid film | 528 | 640 (0.034) | 112, 3315 | 532 | 644 (0.028) | 112, 3269 |
The theoretical absorption spectra (Fig. S3, see ESI†) indicate that the absorption bands in the range between 300 and 355 nm correspond to π–π* transitions mixing together local TPA and local naphthalimide, with different degree of ICT transitions. The low energy absorption bands between 457 and 491 nm correspond to HOMO → LUMO transitions. Given the dominant localization of these orbitals on the TPA and naphthalimide moieties, respectively, an intramolecular charge transfer (ICT) can be deduced for this band in both compounds (Fig. 3 and S3, ESI†). This band exhibits bathochromic and hyperchromic shifts with the increase of the number of naphthalimide moieties. The absorption maxima of the solid films of compounds 4 and 5 show red shifts of 68 and 56 nm, respectively with respect of those of dilute toluene solutions. This observation indicates that there are significant conformational changes of compounds 4 and 5 in the solid state with respect of those characteristic of the dilute solutions. Using the onset wavelengths of the absorption bands, the optical band gaps (Eoptg) were estimated for compounds 4 and 5. Eoptg of compound 5 was evaluated at 2.22 eV, which is by 0.06 eV lower than that of the derivative 4 (2.28 eV). This observation can be explained the faster decrease of LUMO versus HOMO energy in compound 5 as compared to 4. The values of Eoptg observed for the solid films 4 and 5 were found to be by ca. 0.15 eV lower than those of the dilute solutions.
The emission maxima of the dilute toluene solutions of compounds 4, 5 appear in the yellow-orange region at 594 and 583 nm (Fig. 6). Broad and structureless FL spectra were obtained for the solid films of 4, 5. Their maxima peaking at 640 and 644 nm, respectively exhibit considerable red shifts with respect to the spectra of the dilute solutions. The Stokes shift for all solutions decrease with the increase of the number of naphthalimide arms (Table 3), but remain constant (112 nm) for the solid films of compounds 4 and 5.
In a previous work we reported on derivatives of TPA and naphthalimide in which the chromophores were linked via the linkages containing single bonds28 (Fig. 7).
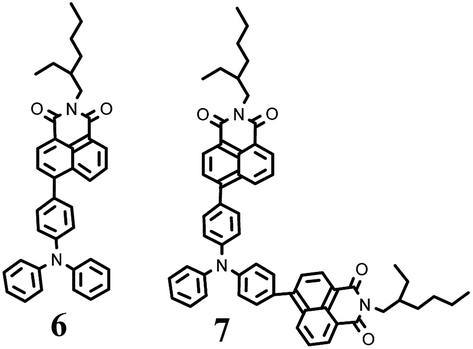 | ||
| Fig. 7 Structures of the previously reported compounds 6 and 7.28 | ||
The dilute solutions of 4 and 5 in cyclohexane were found to exhibit red-shifted absorption by 44 and 56 nm as compared to those of compounds 6 and 7. The fluorescence intensity maxima of the dilute solutions of compounds 4 and 5 also exhibited considerable red shifts (of 93 and 102 nm, respectively) relative to those of the solutions of 6 (470 nm) and 7 (465 nm).28
To investigate in detail the effect of solvatochromism of compounds 4 and 5, the spectral changes induced by solvent polarity were estimated by comparison of the absorption and FL spectra of each compound using five solvents of different polarity with dielectric constants ranging from 2.02 to 37.50, including cyclohexane (dipole moment = 0 D), toluene (0.36 D), THF (1.75 D), acetone (2.91 D), and acetonitrile (3.92 D).
Fig. 8 shows the effect of solvent polarity on FL spectra of the dilute solutions of compounds 4, 5.
 | ||
| Fig. 8 FL spectra of the dilute solutions (10−5 M) of compounds 4 (a) and 5 (b) in cyclohexane, toluene, THF, acetone and acetonitrile. The long-wavelength absorption maxima wavelengths were used as excitation wavelengths. | ||
FL spectra of the dilute solutions of compounds 4, 5 in cyclohexane show three peaks, which can be associated with the transitions from the lowest vibrational excited state to three different vibrational ground states (0 → 0, 0 → 1, and 0 → 2).57,58 As the solvent polarity increased, the FL spectra of the studied compounds become structureless and exhibit only a single broad band. The solutions of compounds 4, 5 in polar solvents show red shifted FL intensity maxima compared to those observed for the solutions in nonpolar solvents. This suggests ICT occurring from the less polar ground state to the more polar excited state.59 Indeed, triplet state calculations of model compounds M4 and M5 in the geometry of the ground state result in large dipole moments of 14.4 and 12 D, respectively, as compared to 8.1 and 7.1 D, respectively for the singlet ground state. This is also supported by the increasing Stokes shifts with the increasing solvent polarity, in turn indicating that the polar excited state is more stabilized in the polar solvents.
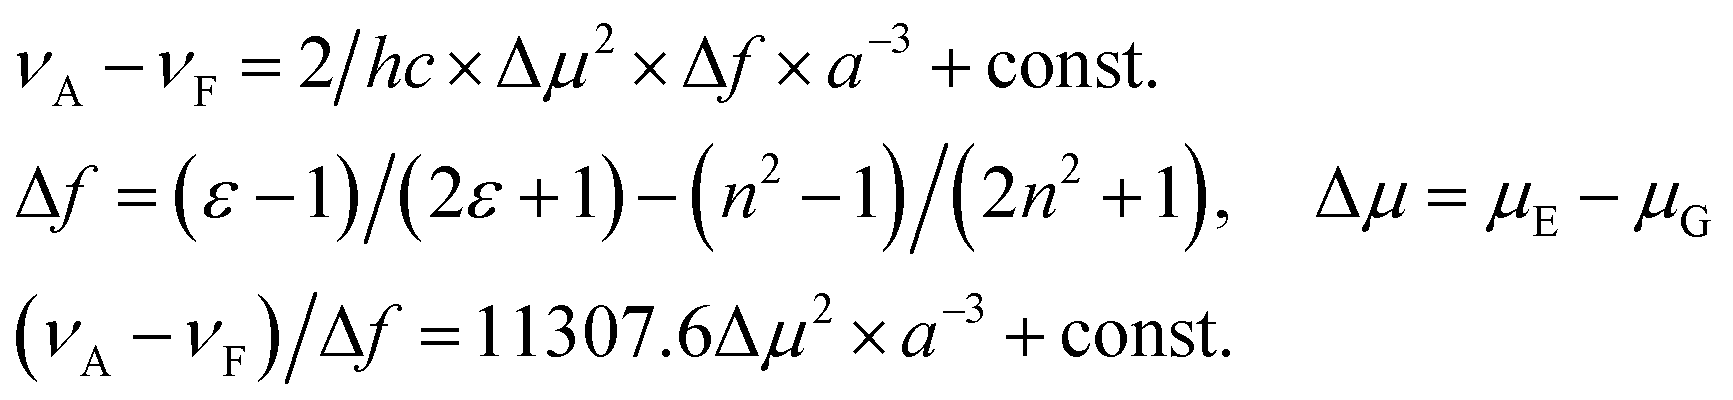
The spectral dependency on the solvent polarity was studied on the basis of the Lippert–Mataga model. The Lippert–Mataga polarity parameter (Δf, also called orientation polarizability parameter) was considered as a measure of the polarity of the different solvents used. It was calculated according to the following eqn (2):60
 | (2) |
The Lippert–Mataga plot has to be linear, provided the solvent–solute interactions are dipolar. Fig. 9a suggests linear correlations between the Stokes shift of compounds 4, 5 and the solvent orientation polarizability.
 | ||
| Fig. 9 (a) Dependences of Stokes shifts Δν of compounds 4, 5 (c = 10−5 M) on the orientation polarizability Δf. The solid lines correspond to the linear fits. (b) Plots of the wavelengths of fluorescence intensity maxima of 4, 5 versus ET(30) polarity parameter of the different solvents. | ||
For the description of solvatochromism of compounds 4 and 5, the Reichardt–Dimroth equation was additionally used 3:61
| νA − νF = m4ENT + const. | (3) |
The values of ΦF of the solutions of the synthesized compounds in different solvents were also estimated. They are summarized in Table 3. Viscosity of the solvents as well as the polarity seems to have influence on ΦF of the compounds. The highest ΦF values (0.51 and 0.72 for 4 and 5, respectively, Table 3) were found in the case of cyclohexane solutions with the highest viscosity and the lowest dipole moment (0 D) of the solvent (0.898 × 10⁻³ Pa s). Higher fluorescence quantum efficiencies were observed for the solutions in non-polar solvents compared to those in polar solvents, with the lower viscosity values and with the lowest emission intensity found in acetonitrile (Table 3). This is probably due to the enhanced ICT from the TPA to the naphthalimide moieties through the olefinic spacers. Indeed, ICT is considered to reduce the quantum yield due to more pronounced relaxation and nonradiative decay of the excited states.62 The globally smaller ΦF values for compound 5 as compared to 4 (except for the cyclohexane solution) seem to comfort the above assumption, as the red shifted ICT for 5 are expected to enhance the nonradiative decay as compared to 4. However, enhancement of exciplex formation with increasing solvent polarity may additionally contribute to the decreased quantum yields, which is supported by the smallest ΦF values found for both compounds in the less polar solid state (0.034 and 0.028 for 4 and 5, respectively, Table 3).
Hole transport properties
The charge transporting properties of the compounds were probed by the xerographic time-of-flight (XTOF) method. For the layers of compounds 4 and 5 hole mobilities were found to be 2.1 × 10⁻³ and 2.2 × 10⁻⁴ cm2 V−1 s−1 at the electric fields of 2.4 × 10⁵ and 6.1 × 10⁵ V cm−1, respectively. The layers of the molecular mixtures of compounds 4 and 5 with PC-Z (50%) were also prepared. Charge transporting characteristics of compounds 4 and 5 are summarized in Table 4.XTOF transients exhibited dispersive charge transport for all the samples and the transient-time (tt) values were determined from the kinks of photocurrent curves in double logarithmic plots (Fig. 10a). As such, these hole mobilities are expected to characterise the fastest carriers instead of the steady state hole transport of these materials. However, the dependence of the square root of the applied electric field (E) on the logarithm of hole mobility (μh) was found to be linear for all the samples investigated (Fig. 10b). Such electric field dependence on hole mobility follows the nearly universal Poole–Frenkel relationship (μ = μ0exp(αE1/2)). This relationship is usually observed in disordered organic systems63 and can be attributed to effects of energetic and positional disorder on the hopping conduction in amorphous organic solids. Carrier transport in an amorphous organic solid that can be commonly described by Marcus theory64 is generally associated with charge carriers hopping along channels of localized hopping sites. Due to disorder phenomena, the distribution of the hoping site energies (width of the density of states, DOS) is generally large, so that the charge transport in amorphous materials is generally disorder dominated. In order to estimate the role of the polaronic-type transport, we compare the intrinsic properties of compounds 4 and 5. In the frame of Marcus theory, the charge hopping rates between identical molecules basically depend on the intramolecular reorganization energy (λi), and the electronic couplings between the HOMOs of adjacent molecules (limited to a monoelectronic approximation). In order to evaluate the electronic couplings, a selected number of dimers were constructed from the model compounds M4 and M5 (Fig. 11 and S4, ESI†). Our calculations indicate: (i) decreasing intramolecular reorganization energy from 0.23 to 0.14 eV for compounds 4 and 5, respectively, which predicts evolution of hole mobility in opposite sens as compared to the experimental results. (ii) Non-negligible HOMO–HOMO electronic couplings of roughly 0.01–0.08 eV were calculated (Table 5), suggesting good intrinsic properties for hole transport. However, increased average intermolecular distances and decreased HOMO–HOMO electronic couplings were found for compound 5 as compared to 4, suggesting a slight advantage for the hole transport in layers of compound 4.
 | ||
| Fig. 10 Transient photocurrents for the layer of compound 4 at different applied sample voltages (a); electric field dependencies of hole drift mobilities for the layers of 4 and 5 (b). | ||
 | ||
| Fig. 11 Selected choice of dimers constructed from the model compounds M4 and M5, obtained at the ωB97XD/6-31G(d,p) level in gas phase. The dimer indicated as “naphthalimide-over-bridge”, for instance, corresponds to naphthalimide moiety over the butadiene one. See Fig. S4 (ESI†) for additional dimer types for the model compound M4. | ||
| Dimer-naphthalimide-over-naphthalimide | Dimer-naphthalimide-over-bridge | Dimer-cofacial | Dimer-TPA-over-bridge | Dimer-TPA-over-TPA | Dimer-naphthalimide-over-TPA | ||
|---|---|---|---|---|---|---|---|
| t (eV) | 4 | 0.006 | 0.035 | 0.083 | 0.043 | 0.028 | 0.007 |
| 5 | — | 0.024 | 0.072 | 0.008 | — | — | |
| Δ(5 − 4) | — | −0.011 | −0.011 | −0.035 | — | — | |
| d (Å) | 4 | 3.496 | 3.611 | 3.650 | 3.843 | 3.804 | 3.694 |
| 5 | — | 3.668 | 3.727 | 3.938 | — | — | |
| Δ(5 − 4) | — | 0.057 | 0.078 | 0.095 | — | — |
All in all, the evolutions of intramolecular reorganization energy parameter and electronic couplings should roughly cancel out, thus suggesting negligible influence of polaronic type mechanism on the hole transport in these materials. Note that the enhanced space extension of HOMO distribution in M5 as compared to M4 (Fig. 3) would suggests enhanced possibilities for efficient electronic couplings between HOMOs on relatively distant adjacent molecules, but this would be in opposite agreement with the experimental trend of hole mobilities. Both parameter trends thus result in polaronic-type transport predictions which are unable to account for the larger hole mobility by one order of magnitude in 4 as compared to 5. The increased hole mobility observed in compound 4 is then likely to be due to the smaller degree of disorder in the layers of this compounds as compared to 5, which could stem form two effects: (i) due to a larger dipole moment of M4 as compared to M5 (8.1 and 7.1 D, respectively) and probably due to a smaller steric repulsion, stronger intermolecular interactions can be supposed for compound M4, assumably resulting in denser molecular packing in the layers of this compound. Indeed, the calculated average intermolecular distances for some selected dimers are systematically smaller for M4 than for M5 (Table 5). Interestingly, the increasing intermolecular interaction energies and the reduced intermolecular distances were recently shown to result in reduced geometrical randomness and decreased distribution of HOMO energies.29 (ii) The number of dihedral angles between groups contributing to HOMO is larger in compound 5 (Fig. 3). This suggests enhanced impact of geometrical deformations on the HOMO energy, which are expected to negatively impact the hole mobility by means of increasing width of DOS. Both factors predict larger value of the σ parameter (standard deviation of the DOS distribution) for 5 as compared to 4, which seems consistent with the larger α value of 5 (Table 4). Nevertheless, the hole mobilities observed for 4 and 5 were found to be comparable to those of the other compounds consisting of TPA core and naphthalimide arms.27–29
Conclusions
Solution-processable derivatives of triphenylamine and 1,8-naphthalimide with the olefinic linkages between chromophores were synthesized by Heck reaction. Their thermal, optical, electrochemical and photoelectrical properties were studied and discussed in terms of the correlation with the chemical structures and compared with those of the earlier reported derivatives of triphenylamine and 1,8-naphthalimide with the single bonds between chromophores. The compounds showed high thermal stability with the 5% weight loss temperatures of 350 and 363 °C. They form glasses with glass transition temperatures of 56 and 75 °C. The solution of the compound with two 1,8-naphthalimide moieties in cyclohexane exhibits the emission quantum yield of 0.72. Due to pronounced electron donor–acceptor character, the compounds showed solvatochromic red shifts of fluorescence up to 158 nm with significant reduction of the emission yield. The ionization potential values of the synthesized compounds measured by the cyclic voltammetry are 5.22 and 5.27 eV and electron affinities – −3.20 and −3.18 eV. The ionization potentials estimated by electron photoemission technique were found to be 5.47 and 5.49 eV. Xerographic time-of-flight hole mobility of the layer of N-(4-((E)-buta-1,3-dienyl)phenyl)-N-phenyl-(N-(2-ethylhexyl)-1,8-naphthalimide) exceeds 2.1 × 10⁻³ cm2 V−1 s−1 at the electric field of 2.4 × 10⁵ V cm−1. The trend in intrinsic hole transport parameters predicted by theoretical estimations in the frame of Marcus theory is opposite to the experimental one, suggesting for these materials disorder dominated hole transport.Acknowledgements
This article was prepared under the support of the European Social Fund Agency implementing measure VP1-3.1-ŠMM-08-K of the Human Resources Development Operational Programme of Lithuania 2007–2013 third priority “Strengthening of capacities of researchers and scientists” (project No. VP1-3.1-ŠMM-08-K-01-013). Dr D. Volyniuk is thanked for the help in ionization potential measurements.Notes and references
- C. Q. Ma, M. Fonrodona, M. C. Schikora, M. M. Wienk, R. A. J. Janssen and P. Bauerle, Adv. Funct. Mater., 2008, 18, 3323 CrossRef CAS.
- A. Pron, P. Gawrys, M. Zagorska, D. Djurado and R. Demadrille, Chem. Soc. Rev., 2010, 39, 2577 RSC.
- S. Chen, X. Xu, Y. Liu, G. Yu, X. Sun, W. Qiu, Y. Ma and D. Zhu, Adv. Funct. Mater., 2005, 15, 1541 CrossRef CAS.
- Z. Li, Z. Wu, W. Fu, P. Liu, B. Jiao, D. Wang, G. Zhou and X. Hou, J. Phys. Chem. C, 2012, 116, 20504 CAS.
- N. Metri, X. Sallenave, C. Plesse, L. Beouch, P. H. Aubert, F. Goubard, C. Chevrot and G. Sini, J. Phys. Chem. C, 2012, 116, 3765 CAS.
- S. A. Bagnich, S. Athanasopoulos, A. Rudnick, P. Schroegel, I. Bauer, N. C. Greenham, P. Strohriegl and A. Köhler, J. Phys. Chem. C, 2015, 119, 2380 CAS.
- H. Choi, S. Paek, N. Lim, Y. H. Lee, M. K. Nazeeruddin and J. Ko, Chem.–Eur. J., 2014, 20, 10894 CrossRef CAS PubMed.
- J. Li, D. Liu, Z. R. Hong, S. W. Tong, P. F. Wang, C. W. Ma, O. Lengyel, C. S. Lee, H. L. Kwong and S. Lee, Chem. Mater., 2003, 15, 1486 CrossRef CAS.
- C. Lambert, J. Schelter, T. Fiebig, D. Mank and A. Trifonov, J. Am. Chem. Soc., 2005, 127, 10600 CrossRef CAS PubMed.
- S. Roquet, A. Cravino, P. Leriche, O. Aleveque, P. Frere and J. Roncali, J. Am. Chem. Soc., 2006, 128, 3459 CrossRef CAS PubMed.
- A. Leliege, J. Grolleau, M. Allain, P. Blanchard, D. Demeter, T. Rousseau and J. Roncali, Chem.–Eur. J., 2013, 19, 9948 CrossRef CAS PubMed.
- Z. J. Ning and H. Tian, Chem. Commun., 2009, 37, 5483 RSC.
- M. Greatzel, Acc. Chem. Res., 2009, 42, 1788 CrossRef PubMed.
- Z. Jiang, T. Ye, C. Yang, D. Yang, M. Zhu, C. Zhong, J. Qin and D. Ma, Chem. Mater., 2011, 23, 771 CrossRef CAS.
- T. Lee, C. L. Landis, B. M. Dhar, B. J. Jung, J. Sun, A. Sarjeant, J. J. Lee and H. E. Katz, J. Am. Chem. Soc., 2009, 131, 1692 CrossRef CAS PubMed.
- R. Zalesny, O. Loboda, K. Iliopoulos, G. Chatzikyriakos, S. Couris, G. Rotas, N. Tagmatarchis, A. Avramopoulos and M. G. Papadopoulos, Phys. Chem. Chem. Phys., 2010, 12, 373 RSC.
- K. Ghosh, G. Masanta, R. Fröhlich, I. D. Petsalakis and G. Theodorakopoulos, J. Phys. Chem. B, 2009, 113, 7800 CrossRef CAS PubMed.
- T. T. Bui, L. Beouch, X. Sallenave and F. Goubard, Tetrahedron Lett., 2013, 54, 4277 CrossRef CAS.
- H. Zhou, Z. Zheng, G. Xu, Z. Yu, X. Yang, L. Cheng, X. Tian, L. Kong, J. Wu and Y. Tian, Dyes Pigm., 2012, 94, 570 CrossRef CAS.
- M. G. Vivas, D. L. Silva, J. Malinge, M. Boujtita, R. Zalesny, W. Bartkowiak, H. Agren, S. Canuto, L. de Boni, E. Ishow and C. R. Mendonca, Sci. Rep., 2014, 4, 1 CAS.
- J. Liang, C. Zhu and Z. Cao, Phys. Chem. Chem. Phys., 2013, 15, 13844 RSC.
- M. Planells, A. Abate, D. J. Hollman, S. D. Stranks, V. Bharti, J. Gaur, D. Mohanty, S. Chand, H. J. Snaith and N. Robertson, J. Mater. Chem. A, 2013, 1, 6949 CAS.
- E. B. Veale and T. Gunnlaugsson, J. Org. Chem., 2008, 73, 8073 CrossRef CAS PubMed.
- D. Gudeika, J. V. Grazulevicius, D. Volyniuk, R. Butkute, G. Juska, A. Miasojedovas, A. Gruodis and S. Jursenas, Dyes Pigm., 2015, 114, 239 CrossRef CAS.
- D. Gudeika, R. R. Reghu, J. V. Grazulevicius, G. Buika, J. Simokaitiene, A. Miasojedovas, S. Jursenas and V. Jankauskas, Dyes Pigm., 2013, 9, 895 CrossRef.
- A. Furstenberg and E. Vauthey, Photochem. Photobiol. Sci., 2005, 4, 260 Search PubMed.
- D. Gudeika, A. Michaleviciute, J. V. Grazulevicius, R. Lygaitis, S. Grigalevicius, V. Jankauskas, A. Miasojedovas, S. Jursenas and G. Sini, J. Phys. Chem. C, 2012, 116, 14811 CAS.
- D. Gudeika, J. V. Grazulevicius, G. Sini, A. Bucinskas, V. Jankauskas, A. Miasojedovas and S. Jursenas, Dyes Pigm., 2014, 106, 58 CrossRef CAS.
- D. Gudeika, J. V. Grazulevicius, D. Volyniuk, G. Juska, V. Jankauskas and G. Sini, J. Phys. Chem. C, 2015, 119, 28335 CAS.
- J. C. Mello, H. F. Wittmann and R. H. Friend, Adv. Mater., 1997, 9, 230 CrossRef.
- G. Gritzner and J. Kuta, Pure Appl. Chem., 1984, 56, 461 CrossRef.
- E. Miyamoto, Y. Yamaguchi and M. Yokoyama, Electrophotography, 1989, 28, 364 CAS.
- E. Montrimas, V. Gaidelis and A. Pazera, Lith. J. Phys., 1996, 6, 569 Search PubMed.
- L. M. Harwood, C. J. Moody and J. M. Percy, Experimental organic chemistry: preparative and microscale, Blackwell Science, 1998 Search PubMed.
- D. Gudeika, R. Lygaitis, V. Mimaite, J. V. Grazulevicius, V. Jankauskas, M. Lapkowski and P. Data, Dyes Pigm., 2011, 91, 13 CrossRef CAS.
- X. Yang, Y. Zhao, X. Zhang, R. Li, J. Dang, Y. Li, G. Zhou, Z. Wu, D. Ma, W. Y. Wong, X. Zhao, A. Ren, L. Wang and X. Hou, J. Mater. Chem., 2012, 22, 7136 RSC.
- M. L. Keshtov, M. I. Buzin, P. V. Petrovskii, E. E. Makhaeva, V. S. Kochurov, D. V. Marochkin and A. R. Khokhlov, Polym. Sci., Ser. B, 2011, 53, 257 CrossRef CAS.
- F. Terenziani, C. le Droumaguet, O. Mongin, C. Katan and M. Blanchard-Desce, Nonlinear Opt., Quantum Opt., 2006, 35, 69 CAS.
- M. Mitsuyuki, M. Tetsuro and S. Atsuro, Jpn. Kokai Tokkyo Koho, JP pat. 09297415 A, 19971118, 1997 Search PubMed.
- J. Pei, M. Liang, J. Chen, Z. L. Tao and W. Xu, Acta Phys.-Chim. Sin., 2008, 24, 1950 CrossRef CAS.
- W. Kohn and L. Sham, Phys. Rev., 1965, 140, A1133 CrossRef.
- C. T. Lee, W. T. Yang and R. G. Parr, Phys. Rev. B: Condens. Matter Mater. Phys., 1988, 37, 785 CrossRef CAS.
- A. D. Becke, J. Chem. Phys., 1993, 98, 5648 CrossRef CAS.
- J. D. Chai and M. Head-Gordon, Phys. Chem. Chem. Phys., 2008, 10, 6615 RSC.
- M. J. Frisch, G. W. Trucks, H. B. Schlegel, G. E. Scuseria, M. A. Robb, J. R. Cheeseman, G. Scalmani, V. Barone, B. Mennucci, G. A. Petersson, H. Nakatsuji, M. Caricato, X. Li, H. P. Hratchian, A. F. Izmaylov, J. Bloino, G. Zheng, J. L. Sonnenberg, M. Hada, M. Ehara, K. Toyota, R. Fukuda, J. Hasegawa, M. Ishida, T. Nakajima, Y. Honda, O. Kitao, H. Nakai, T. Vreven, J. A. Montgomery, J. E. Peralta, F. Ogliaro, M. Bearpark, J. J. Heyd, E. Brothers, K. N. Kudin, V. N. Staroverov, T. Keith, R. Kobayashi, J. Normand, K. Raghavachari, A. Rendell, J. C. Burant, S. S. Lyengar, J. Tomasi, M. Cossi, N. Rega, J. M. Millam, M. Klene, J. E. Knox, J. B. Cross, V. Bakken, C. Adamo, J. Jaramillo, R. Gomperts, R. E. Stratmann, O. Yazyev, A. J. Austin, R. Cammi, C. Pomelli, J. W. Ochterski, R. L. Martin, K. Morokuma, V. G. Zakrzewski, G. A. Voth, P. Salvador, J. J. Dannenberg, S. Dapprich, A. D. Daniels, O. Farkas, J. B. Foresman, J. V. Ortiz, J. Cioslowski and D. J. Fox, Gaussian 09, Revision B.01, Gaussian Inc., Wallingford CT, 2010 Search PubMed.
- E. K. U. Gross and W. Kohn, Phys. Rev. Lett., 1985, 55, 2850 CrossRef CAS PubMed.
- E. Runge and E. K. U. Gross, Phys. Rev. Lett., 1984, 52, 997 CrossRef CAS.
- E. K. U. Gross and W. Kohn, Adv. Quantum Chem., 1990, 21, 255 CrossRef CAS.
- R. Bauernschmitt and R. Ahlrichs, Chem. Phys. Lett., 1996, 256, 454 CrossRef CAS.
- M. E. Casida, C. Jamorski, K. C. Casida and D. R. Salahub, J. Chem. Phys., 1998, 108, 4439 CrossRef CAS.
- R. Dennington II, T. Keith and J. Millam, GaussView, Version 5, Semichem Inc., Shawnee Mission KS, 2009 Search PubMed.
- J. L. Bredas, D. Beljonne, V. Coropceanu and J. Cornil, Chem. Rev., 2004, 104, 4971 CrossRef CAS PubMed.
- M. D. Newton, Chem. Rev., 1991, 91, 767 CrossRef CAS.
- E. F. Valeev, V. Coropceanu, D. A. da Silva, S. Salman and J. L. Bredas, J. Am. Chem. Soc., 2006, 128, 9882 CrossRef CAS PubMed.
- K. Senthilkumar, F. C. Grozema, F. M. Bickelhaupt and L. D. A. Siebbeles, J. Chem. Phys., 2003, 119, 9809 CrossRef CAS.
- H. Xu, R. Meng, C. Xu, J. Zhang, G. He and Y. Cui, Appl. Phys. Lett., 2003, 83, 1020 CrossRef CAS.
- J. Franck, J. Chem. Soc., Faraday Trans., 1926, 21, 536 RSC.
- E. Condon, Phys. Rev., 1926, 27, 640 Search PubMed.
- E. Ishow, G. Clavier, F. Miomandre, M. Rebarz, G. Buntinx and O. Poizat, Phys. Chem. Chem. Phys., 2013, 15, 13922 RSC.
- P. R. Bangal, S. Panja and S. Chakravorti, J. Photochem. Photobiol., A, 2001, 139, 5 CrossRef CAS.
- C. Reichardt and T. Welton, Solvents and solvents effects in organic chemistry, Wiley-VCH, Weinheim, 4th edn, 2011 Search PubMed.
- J. Sung, P. Kim, Y. O. Lee, J. S. Kim and D. Kim, J. Phys. Chem. Lett., 2011, 2, 818 CrossRef CAS.
- H. Bassler, Int. J. Mod. Phys. B, 1994, 8, 847 CrossRef.
- R. A. Marcus, Rev. Mod. Phys., 1993, 65, 599 CrossRef CAS.
Footnote |
| † Electronic supplementary information (ESI) available: 1H NMR and 13C NMR spectra of compounds, theoretical absorption spectra of model compounds, selected choice of dimers constructed from the model compound. See DOI: 10.1039/c5ra24820e |
| This journal is © The Royal Society of Chemistry 2016 |