
Nanocatalyst shape and composition during nucleation of single-walled carbon nanotubes†
Jose L. Gomez-Ballesterosa,
Juan C. Burgosa,
Pin Ann Linbc,
Renu Sharmac and
Perla B. Balbuena*a
aDepartment of Chemical Engineering, Texas A&M University, College Station, TX 77843-3122, USA. E-mail: balbuena@tamu.edu
bCenter for Nanoscale Science and Technology, National Institute of Standards and Technology, Gaithersburg, MD 20899-6203, USA
cUniversity of Maryland – IREAP, College Park, MD 20742, USA
First published on 7th December 2015
Abstract
The dynamic evolution of nanocatalyst particle shape and carbon composition during the initial stages of single-walled carbon nanotube growth by chemical vapor deposition synthesis is investigated. Classical reactive and ab initio molecular dynamics simulations are used, along with environmental transmission electron microscope video imaging analyses. A clear migration of carbon is detected from the nanocatalyst–substrate interface, leading to a carbon gradient showing enrichment of the nanocatalyst layers in the immediate vicinity of the contact layer. However, as the metal nanocatalyst particle becomes saturated with carbon, a dynamic equilibrium is established, with carbon precipitating on the surface and nucleating a carbon cap that is the precursor of nanotube growth. A carbon composition profile decreasing towards the nanoparticle top is clearly revealed by the computational and experimental results that show a negligible amount of carbon in the nanoparticle region in contact with the nucleating cap. The carbon composition profile inside the nanoparticle is accompanied by a well-defined shape evolution of the nanocatalyst driven by the various opposing forces acting upon it both from the substrate and from the nascent carbon nanostructure. This new understanding suggests that tuning the nanoparticle–substrate interaction would provide unique ways of controlling the nanotube synthesis.
Introduction
The availability of large-scale arrays of semiconducting nanotubes with specific structures and perfect alignment would constitute a revolutionary step in the field of electronics allowing for smaller dimensions, higher efficiency, and speed of operation in devices such as field-effect transistors (FET).1–3 However, such structures are currently lacking,4 limiting the incorporation of single-walled carbon nanotubes (SWCNTs) into electronic circuits. Approaches to overcome this limitation include separation via assisted dispersion,5 electrophoresis,6 ion exchange chromatography7 and density-gradient ultracentrifugation,8,9 allowing separation by electronic behavior (metallic or semiconducting)5,6,8 or specific chiral structure.7,9 Alternatively, controlling the nanotube structure during synthesis via control of the catalyst structure is considered a promising strategy.10 The structure and properties of SWCNTs are believed to be defined during the catalyzed synthesis process. Once the nascent cap is fully formed, its structure is maintained throughout growth, provided the reaction conditions do not drastically change11 and major rearrangements do not occur in the catalytic nanoparticle.12 The existence of a correlation between nanocatalyst structure and the nascent nanotube cap, previously observed and reported as the template effect,13–15 can play a crucial role defining the nanotube structure and may allow for the development of strategies to control SWCNT morphology during the synthesis process.SWCNTs are typically synthesized by catalytic chemical vapor deposition (C-CVD), a process carried out with floating or supported transition metal nanocatalysts (Fe, Co, Ni, Cu, etc.) and hydrocarbons, ethanol, or CO as precursors.16,17 SWCNT growth has been observed on both pure metal18–21 and carbide nanoparticles22–25 posing questions about the stability of such phases and their role in the nucleation process and motivating investigation of the catalyst structural evolution during nanotube formation. One of the hypotheses proposed to explain nanotube growth is the vapor–liquid–solid mechanism (VLS);26 in which carbon atoms diffuse into a liquid nanoparticle followed by nucleation on the catalyst surface and growth. Evidence for this mechanism comes from observation of fluctuations in the nanoparticle shape24,27 and decrease in the melting point of nanoparticles.28 In contrast, direct observations of stable crystalline facets during nucleation and growth25 indicate that the catalyst nanoparticle may be in a solid state in which its shape may fluctuate, but is stabilized by the forces acting upon it. In the case of supported nanocatalysts, metal oxide substrates are typically used and observed to influence the nanoparticle shape,23,29 and the nanotube mode of growth and anchorage in some cases.30 The nucleation of small carbon islands on the particle surface of floating Ni and Fe catalysts has been investigated with density functional theory (DFT), focusing on the thermodynamics of carbon dissolution, precipitation and coalescence31,32 and the stability of carbide33 compared to that of metal particles34 during nucleation. Although some insights into the role of dissolved C as the driving force for nucleation have been introduced from these previous studies, most of them were focusing on static analyses of floating catalysts. However, a more thorough description of variations in the structure and composition of the particle due to the effect of interactions with the nascent cap and the support can be obtained from the dynamic evolution of the catalyst and nanotube during nucleation.
In the present work, we focus on the evolution of the structure of the catalyst nanoparticle during the early stages of carbon dissolution and nucleation of SWCNTs. Variations in shape, atomic ordering, and carbon concentration profile are studied by a combination of reactive molecular dynamics (RMD) and ab initio molecular dynamics (AIMD) simulations and analyses of real-time atomic-resolution videos taken in an environmental transmission electron microscope (ETEM). We look closely at the interactions of the nanoparticle with the substrate and the nucleating nanotube cap, and their effect on the nanoparticle structural parameters.
Computational details
Our approach employs two types of molecular simulations. Classical reactive molecular dynamics (RMD) simulations emulate the catalytic growth of single-walled carbon nanotubes in the tens of nanoseconds time scale, whereas ab initio molecular dynamics (AIMD) simulations allow observation of short time phenomena (order of tens of ps) providing detailed information on the chemical nature of the interactions of the involved species. In the RMD simulations the carbon–carbon interactions are described by a reactive bond order potential35 that includes corrections with respect to the original potential developed by Brenner and collaborators.36 The modifications consist of an extended parameterization that regulates carbon–carbon interactions inside catalyst nanoparticles. On the other hand, the metal–carbon interactions are represented through a reactive potential35 according to the Tersoff scheme37 that takes into account the hybridization states of C atoms and distinguishes among dissolved and surface C atoms, according to atomic coordination criteria. Metal–metal interactions are described by the many-body Sutton–Chen potential38 which has been successfully used to describe several properties of transition metals.39–41 The metal–support interaction is parameterized: the adsorption strength of the catalyst nanoparticle to its support is set to 370 meV per atom (6.11 eV nm−2), an energy value which lies within the range reported for catalytic transition metal clusters supported on ceramic substrates such as Ag/MgO (1.43 eV nm−2 to 3.99 eV nm−2),42,43 Pb/MgO (4.81 eV nm−2),43 and Cu/MgO (11.98 eV nm−2).44,45 The initial RMD system is formed by a carbide-like catalyst nanoparticle deposited on a rectangular monolayer substrate model. The substrate was placed at the bottom of a periodic box of the same cross sectional area as the area of the support, 3.98 nm wide (x-direction) and 3.88 nm deep (y-direction). A catalyst nanoparticle with the composition of cobalt carbide is then deposited on top of the substrate. The initial composition of the carbide-like particle is Co2C; however its structure is that which results when 80 carbon atoms are dissolved into the pure metal catalyst made of 160 cobalt atoms. The vacuum of the periodic box is set in 50 nm height, providing the necessary volume to bring the pressure down to values as low as ≈18 kPa. This value represents the lowest nonzero pressure that can be achieved in the precursor gas phase; it results in supplying one single precursor atom into the periodic box. The temperature and the volume of the system are kept constant throughout the simulation. The atomic velocities of the system are adjusted to a target temperature of 650 °C through a thermostat.35 The integration of the equations of motion is done through the predictor–corrector algorithm, using an integration time step of 0.5 fs until a total simulation time of 50 ns has been reached.In addition, the interactions between a Co2C nanoparticle and an MgO substrate are studied through AIMD simulations carried out using the Vienna ab initio simulation package (VASP)46–50 with the Perdew–Burke–Ernzerhof exchange–correlation functional.51 The projected augmented wave (PAW) pseudopotentials52,53 were employed to describe the electron–ion core interactions. The plane wave describing the valence electron density was expanded up to a cutoff energy of 400 eV. Γ-point sampling of the Brillouin zone is used for integration in reciprocal space. The partial occupancies were assigned considering a Gaussian smearing with a 0.05 eV width. Before performing AIMD, the structures were allowed to relax using a conjugate gradient algorithm until the energy difference was lower than 10−3 eV between consecutive relaxation steps and 10−4 eV between electronic self-consistent steps. AIMD simulations were carried out using the NVT ensemble at 600 °C with the Nosé thermostat and a time step of 1 fs. Atomic charges were estimated using the Bader analysis of charges,54,55 in which the total charge of an atom is defined by the electron density enclosed by zero-flux surfaces. The AIMD model consists of a faceted Co2C nanoparticle containing 24 Co atoms and 12 C atoms (approximately 0.7 nm in diameter) deposited on a 1.5 nm × 1.5 nm five-layer periodic slab of MgO substrate. This model emulates a supported nanoparticle at an early stage in the nanotube growth process, prior to the nucleation of the carbon structure at typical growth conditions: 600 °C and ultra-low C pressure. The (200) surface facet of MgO and the (020) (only Co atoms at the interface) and (210) (Co and C atoms at the interface) facets of Co2C were considered, as they have been observed and reported from environmental transmission electron microscopy (ETEM) studies.25 Relaxation of the individual structures was performed allowing surface atoms to find positions of lower energy. In the case of MgO, the number of layers was selected based on convergence of the surface energy. In all cases of MgO relaxation, the two bottom layers were fixed at the bulk structure while the top layers were allowed to relax. Two different configurations (nanoparticle located epitaxial and almost non-epitaxial with respect to the MgO substrate) were used for each of the (020) and (210) surface orientations.
In situ experimental details
An environmental transmission electron microscope (ETEM), operated at 300 kV, was employed to capture images of SWCNT growth. Acetylene (C2H2) and CoxMo1−x/MgO were used as carbon precursors and a catalyst–support, respectively. The catalyst–support was prepared by wet chemical method as described previously.56 The catalyst–support system was first heated to 750 °C in oxygen (100 Pa) to remove impurities such as gaseous hydrocarbon adsorbed on the surface of the catalyst–support system. This step also resulted in oxidizing the metal nanoparticles, but they became reduced prior to CNT formation.25 Then the sample was cooled down to a SWCNT growth temperature at 650 °C in vacuum (10−4 Pa) for 10 minutes before 0.01 Pa C2H2 was introduced. Atomic-resolution real-time videos were then acquired at 10 frames per second and used for phase identification.25Results and discussion
Carbon distribution in the catalyst nanoparticle
Carbon atoms in RMD simulations are initially added at a partial pressure of 820 kPa to the catalytic surface, where atoms diffuse into the catalyst. The solubility of C atoms in the nanoparticle at this pressure is extremely high and the C concentration inside the nanoparticle rapidly reaches the Co![[thin space (1/6-em)]](https://www.rsc.org/images/entities/char_2009.gif) :C ratio in Co2C. In order to create the initial Co2C model for the RMD simulations, the high-pressure (820 kPa) precursor gas flow is stopped as soon as the desired composition is obtained. This system is then exposed to low pressure conditions (18 kPa) for nucleation and growth. The steep decrease in the reaction pressure reverses the tendency of C atoms to saturate the Co clusters allowing initially dissolved C atoms to precipitate onto the catalyst surface. As this precipitation continues, the concentration of C atoms within the catalyst stabilizes. A relatively stable solution is reached at 15 ns, when the diffusion in both directions, in and out of the catalyst, becomes even, keeping constant (≈40 atoms) the total amount of carbon dissolved in the metal nanoparticle (Fig. 1). The end of the C stabilization period marks the start of the cap nucleation stage, where the precipitated carbon, along with new catalyzed carbon, combine to initiate the formation of carbon chains and networks on top of the catalyst surface. Throughout this process, changes in shape and local composition take place in the catalyst nanoparticle, as a result of the dynamics of the C atoms diffusing in and out and association of C atoms on the surface. Variations in C composition of the particle throughout the nucleation process are driven by local differences in C chemical potential: dissolved carbon, carbon precipitated to the particle surface and carbon at the edges of the islands with unsaturated bonds. Therefore as the nanotube begins to nucleate, a decrease in the subsurface carbide species is expected due to variations in the local environment of C atoms and changes in the metal–carbon interaction.32 This decrease in C concentration reportedly prevents the formation of new islands on the catalyst surface, and favors coalescence of the existing carbon formations on the surface.31
:C ratio in Co2C. In order to create the initial Co2C model for the RMD simulations, the high-pressure (820 kPa) precursor gas flow is stopped as soon as the desired composition is obtained. This system is then exposed to low pressure conditions (18 kPa) for nucleation and growth. The steep decrease in the reaction pressure reverses the tendency of C atoms to saturate the Co clusters allowing initially dissolved C atoms to precipitate onto the catalyst surface. As this precipitation continues, the concentration of C atoms within the catalyst stabilizes. A relatively stable solution is reached at 15 ns, when the diffusion in both directions, in and out of the catalyst, becomes even, keeping constant (≈40 atoms) the total amount of carbon dissolved in the metal nanoparticle (Fig. 1). The end of the C stabilization period marks the start of the cap nucleation stage, where the precipitated carbon, along with new catalyzed carbon, combine to initiate the formation of carbon chains and networks on top of the catalyst surface. Throughout this process, changes in shape and local composition take place in the catalyst nanoparticle, as a result of the dynamics of the C atoms diffusing in and out and association of C atoms on the surface. Variations in C composition of the particle throughout the nucleation process are driven by local differences in C chemical potential: dissolved carbon, carbon precipitated to the particle surface and carbon at the edges of the islands with unsaturated bonds. Therefore as the nanotube begins to nucleate, a decrease in the subsurface carbide species is expected due to variations in the local environment of C atoms and changes in the metal–carbon interaction.32 This decrease in C concentration reportedly prevents the formation of new islands on the catalyst surface, and favors coalescence of the existing carbon formations on the surface.31
 | ||
| Fig. 1 Number of carbon atoms inside the catalyst nanoparticle obtained from simulations. The red curve corresponds to the atoms forming the initial carbide composition that remain dissolved in the nanoparticle. The blue curve represents the sum of all dissolved atoms: those remaining from the initial carbide composition and the new ones incorporated from the gas phase. The purple line indicates the time when a CoxCy solution reaches a relatively stable global composition. | ||
Evolution of catalyst nanoparticle shape
Besides the global concentration of carbon atoms, a detailed analysis of the local concentration of carbon within the catalyst provides information about the routes of carbon dissolution and diffusion during SWCNT nucleation and growth. Z-density profiles are generated from the RMD trajectories by computing the number of atoms of a given species present in successive planes parallel to the substrate; each of the planes are stacked in the direction perpendicular to the substrate, thus defining the location of atomic layers. Z-density plots herein reported contain profiles for both carbon and metal atoms, where the height of each peak represents the population of the species in each layer. However, the Co:C ratio does not exclusively determine the presence of a nucleating carbide phase. Other factors such as the nearest neighbor distances and structural stability of the metallic solvent atoms could be indicators of carbide nucleation. Thus, Z-density profiles are used to obtain information about time evolution of the catalyst nanoparticle shape as they are related to the total number of peaks observed in the carbon and metal profiles. For instance, during the process of stabilization of the carbon concentration, the height of the first metal peak increases and the total number of peaks decreases (Fig. 2: 5 ns to 7.5 ns). The higher metal peak in contact with the substrate reveals the spread of metal atoms on the substrate leading to a reduction in the number of atomic layers in the catalyst nanoparticle.
 | ||
| Fig. 2 Z-density profiles for metal atoms forming the catalyst nanoparticle. Each curve corresponds to profiles calculated over 2.5 ns intervals. The number of peaks and the height of each peak provide information about the catalyst nanoparticle shape. The substrate is located at z = 0. The time interval corresponds to the C stabilization stage (see Fig. 1). | ||
As the global carbon concentration stabilizes and the carbon cap nucleation starts, the catalyst nanoparticle undergoes minimal variations in its shape. During cap nucleation, the metal atoms decrease their tendency to spread on the substrate surface finding some structural stability, although some nanocatalyst height reduction is still seen in this period, as shown in Fig. 3a. The end of the nucleation stage takes place once the carbon cap completely covers the top of the catalyst surface (Fig. 3a at 34 ns). When this event occurs, the catalyst nanoparticle finally stops spreading on the support and starts recovering some height as result of a counteracting force coming from the cap, which pulls the metal and dissolved carbon atoms upwards (Fig. 3a). This phenomenon can be associated with step flow mechanisms observed through in situ experiments using an environmental TEM in which the catalyst particle undergoes a reversible deformation right before the cap lifts off.27,57 This elongation will be eventually followed by a shape recovery as result of the cap release.27
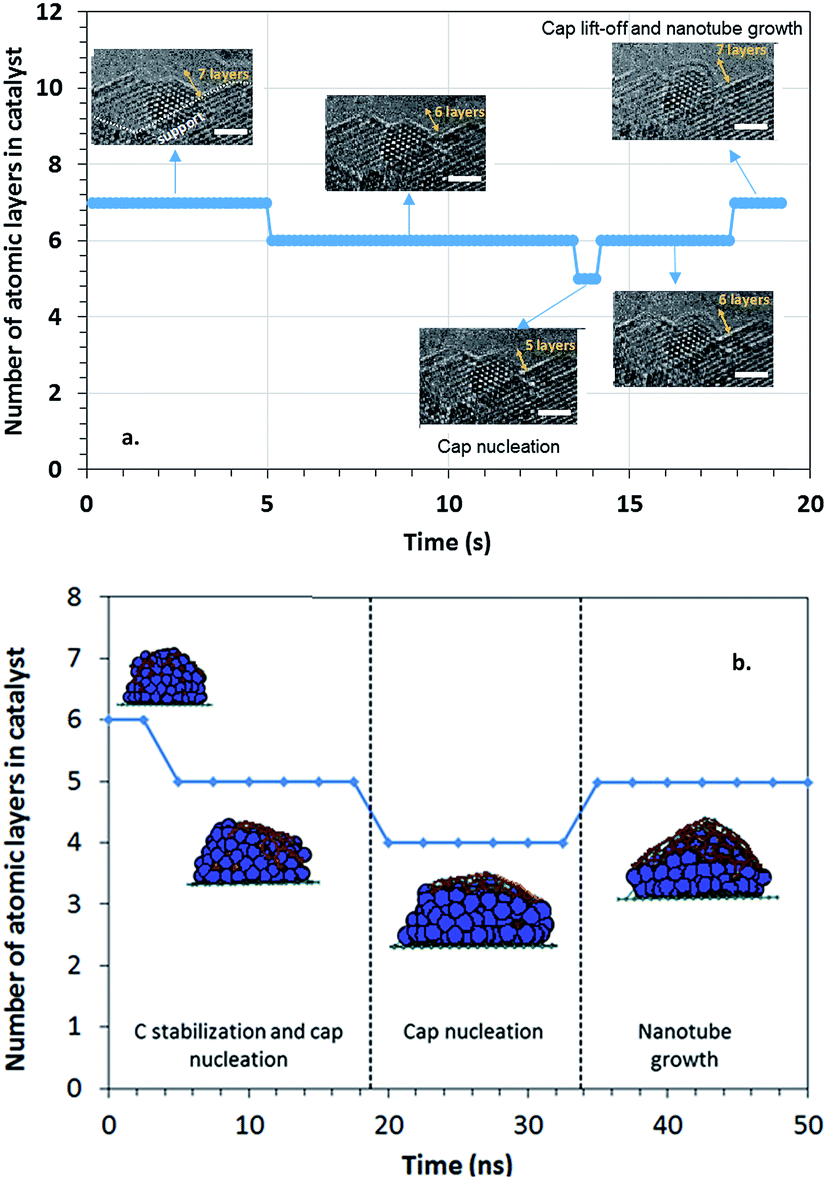 | ||
| Fig. 3 Shape evolution of the catalyst nanoparticle during the various nucleation and growth stages. (a) RMD simulations illustrate that during carbon stabilization, the metal layer in contact with the substrate tends to wet the substrate (first ≈ 15 ns). Carbon nucleation starts before carbon stabilization is reached and leads to further reduction in the number of layers of the nanocatalyst particle. The slight vertical elongation of the nanocatalyst particle coincides with the beginning of the growth stage. (b) In qualitative agreement with the simulated results, in situ experimental observations show that the nanocatalyst particle spreads laterally with decreasing number of atomic layers before the cap nucleation ends (at approximately 13 s). The bar is 1 nm. | ||
We have recorded the catalyst shape dynamics in real-time using environmental TEM. Fig. 3b shows that the catalyst spreads laterally, as shown by the decrease in the number of atomic layers, before cap nucleation. During cap nucleation at the catalyst nanoparticle surface (time period 13.6 s to 14.2 s), the catalyst nanoparticle height reduces the most. Then the catalyst stops spreading and its height recovers one atomic layer when the cap forms fully and starts to lift off. The catalyst shape evolution in our in situ observations (Fig. 3b) qualitatively agrees with the simulated results, even though they are in different time scales (Fig. 3a) and different precursor pressures. The accelerated dynamics employed in our simulation model35 are able to represent well the behavior observed in the experiments due to the ability to model the mechanisms involved in the nucleation process (e.g. C dissolution, C bulk and surface diffusion, and C precipitation to the particle surface). These are simultaneously responsible for the changes in shape and composition in the nanoparticle.
Reshaping effects on the catalytic nanoparticle during SWCNT nucleation can thus be summarized as (a) spreading of the nanoparticle on the substrate and a concomitant decrease in the number of layers while the global C composition is stabilized and the carbon cap nucleates; and (b) elongation of the nanoparticle as the newly formed cap lifts off. Such events can seemingly be attributed to the interplay between the interactions of the carburized nanoparticle with the substrate and with the nascent cap. Previous RMD studies varying the substrate–catalyst adhesion energy Eadh29,58 showed that the strength of interaction between the substrate and the nanocatalyst plays an important role in determining the dynamics of the nanoparticle shape. In this work, we performed AIMD simulations of Co2C nanoparticles deposited on MgO substrates aimed to emulate the experimental setting. As explained above, based on our previous work,25 Co2C(020) and Co2C(210) the two facets potentially in contact with the support, are taken as the base model for the calculations. The initial configurations were constructed by bringing into contact the relaxed structures of a Co2C slab cleaved along the (020) and (210) planes, exhibiting a pure Co termination and a Co–C termination respectively, with a five-layer MgO slab cleaved along the (200) plane. Changes in the nanoparticle shape and relative atomic distribution with respect to the substrate are observed as a result of the temperature-induced dynamics at 600 °C. Two initial configurations were considered for each termination differing in their relative location with respect to the substrate: (i) most of the Co atoms are located on top of Mg atoms (indicated by the numeral 1 preceding the facet type), (ii) most of the Co atoms are located in positions other than on top of Mg atoms (indicated by the numeral 2). However after a period of equilibration, interfacial Co atoms are displaced from their original position preferring locations atop O atoms at the substrate interface in all cases (Fig. S3†). Such behavior has been observed and described from calorimetric measurements43 and theoretical calculations of transition metal clusters on the (100) facet of MgO44,45 suggesting a covalent interaction between O and Co. The current AIMD simulations indicate that although the facets in the initial models are not kept, systems based on the same surface facet maintain structural similarities among them. These AIMD simulations, where the nanoparticle–substrate effect is separated from that of the nascent cap–nanoparticle, reveal that the nanoparticle shape is in part influenced by the nanoparticle–substrate interaction strength, which in turn is determined by the structure of the facet in contact with the substrate. After an equilibration period, the substrate induces a redistribution of C atoms in the catalyst that differs from the initially organized carbide structure, as C atoms, displaced from their original locations, intercalate among pure Co and Co–C layers (Fig. 4). Moreover, the (020)-based nanoparticles tend to adopt a rounded cubic shape, whereas the (210) ones rearrange into an egg-shape. In the absence of a driving force, no C aggregation or precipitation on the nanoparticle surface is observed. In all cases, the nanoparticle–substrate interface contains predominantly Co atoms, with the migrated C atoms appearing between the Co layer in contact with the substrate and the adjacent Co layer. This Co-enrichment of the layer in contact with the substrate (Fig. 4) is in agreement with that observed in the RMD simulations (Fig. S1 and S2†).
 | ||
| Fig. 4 Z-density profiles for Co and C atoms forming the supported nanoparticle from AIMD simulations of Co2C nanoparticles on MgO substrates. Initial configurations of (a) Co2C(020), and (b) Co2C(210). (c–f) Density profiles after 3 ps. Changes in the catalyst shape are evidenced by irregularities in the height, distribution and extension of the peaks. Overall, the atomic distribution in the supported nanoparticle models evolves toward a first layer of pure Co in contact with the substrate, followed by alternations between a layer with Co and C in almost equal proportion and another of pure Co. The substrate is located at z = 0.0 nm. | ||
In order to quantify the nanoparticle–substrate interactions, we estimate the strength of adhesion of the nanoparticle to the support surface per Co atom at the interface, Eadh, in the cases studied. We calculated the energy of adhesion by subtracting the energies of the individual components of the system (ECo2C and EMgO) frozen in their interacting configuration from the energy of the combined system ECo2C/MgO divided by the number of Co atoms at the interface NCo as illustrated in eqn (1).
 | (1) |
Fig. 5 shows the calculated energies of adhesion per Co-atom for each of the models considered. Since the values are normalized, a direct comparison between energies of adhesion can be established. The calculated values are comparable to the experimental and theoretical values reported between transition-metal clusters and an MgO support; the strength is in the moderate to strong range.43,45
 | ||
| Fig. 5 Energy of adhesion per Co atom for each configuration of the two surface facets studied: (020) and (210). The insets next to each label illustrate the nanoparticle–substrate interface for each case depicted with Mg atoms in green, O atoms in red, Co atoms in blue and C atoms in brown. Due to the fact that the nanoparticle–substrate interface contains predominantly Co atoms, only one C atom depicted as a small brown sphere is shown in the 1-020 system. | ||
For a given nanoparticle facet in contact with the substrate (for example (020) or (210)), the calculated adhesion energies do not depend on the specific initial location of such facet with respect to the substrate lattice. In contrast, nanoparticles exposing different facets display different nanoparticle–substrate adhesion energies. In spite of these energetic differences, Fig. 4 and S4† show that both (020) and (210) based structures on MgO evolve towards similar composition of the nanoparticle contact layer (pure Co) and comparable distances between Co and substrate atoms. In addition, a smaller number of Co atoms is found at the contact layer in the (210)-based structures and these atoms are subject to a stronger interaction with the substrate compared to the (020)-based ones.
A closer look at the interactions between the substrate and the Co2C nanoparticle models can be obtained from an estimation of partial atomic charges and charge transfer between atoms at the interface (Fig. S5†). Atomic charges in the substrate atoms show equal magnitudes (≈1.38 e, a.u.) with positive and negative signs for Mg and O respectively, indicating a neutral net charge in the substrate. No significant difference in the average charge distribution was found between substrate atoms at the interface and in the bulk of the support.
Average partial charges for Co atoms near the substrate–nanoparticle interface which are evaluated separately from atoms elsewhere in the nanoparticle, exhibit a slightly higher average positive charge (0.39 e, a.u. and 0.44 e, a.u.) than Co atoms in the rest of the nanoparticle (0.28 e, a.u. and 0.27 e, a.u.) in the (210)-based nanoparticles. The opposite trend is observed for the (020)-based structures. Similarly, C atoms located closer to the substrate bear charges with higher magnitude (more negative) than C atoms located elsewhere. These results suggest that this polarization of the nanoparticle atoms close to the interface with the ionic crystal substrate may contribute to the stronger interaction of the (210)-based nanoparticles (≈1.4 eV per Co atom) compared to the (020) case (≈1 eV per Co atom). Altogether, as carbon is being dissolved in the nanoparticle and the nucleation process begins, the nanoparticle shape (described in terms of the number of layers and the relative distribution of atoms therein) is dependent on the strength of interaction of the nanoparticle with the substrate. This interaction is shown to be related to the extent of the electron transfer between the interfacial metal atoms and their neighboring C and O atoms (Fig. 6), which in turn is affected by the way metal atoms are distributed at the interface. As the nucleation stage starts and the nanotube cap is formed, a competition between the nanoparticle–cap and the nanoparticle–substrate interactions will arise which leads to particle reshaping as shown in Fig. 3. Moreover, carbon redistribution inside the nanoparticle is also induced by nucleation as discussed next.
 | ||
| Fig. 6 Accumulation (orange) and depletion (purple) of electron density in 2-(020) and 1-(210). Regions of electron accumulation are located around O atoms (red) and the interface with the nanoparticle. Regions of depletion are located around Co atoms (blue) across the layer in contact with the substrate revealing charge transfer from the nanoparticle to the substrate (Co → O). Mg atoms and C atoms are depicted in green and brown respectively. | ||
Carbon gradient inside the catalyst during cap nucleation stage
Changes in the local distribution of C atoms are observed in both ETEM images and RMD simulations during the cap nucleation stage after the global carbon concentration stabilizes. Z-density profiles from RMD simulations (Fig. 7 and S1†) are used to generate carbon concentration profiles (Fig. 8) for various time frames of the nucleation stage. The C atoms are highly concentrated near the catalyst support, and depleted away from it (Fig. 7). The ratio of C to metal is quantified by the peak heights of carbon and metal in the Z-density profile at each layer position (Z-density profiles for different time frames in Fig. S1†). The analysis of carbon concentration does not include the pure metal contact layer (negligible carbon concentration) which is due to a strong repulsion exerted by the support potential over carbon atoms, as shown from the DFT analysis (Fig. 5 and 6) where the interfacial energies are dominated by the Co–O interactions. This repulsion leads to a pure metal phase near to the nanoparticle–support interface, and a highly concentrated carbon–metal solution in the immediately adjacent layer. The carbon concentration decreases almost linearly in the perpendicular direction out of the support plane, passing through different stoichiometric carbide compositions (Fig. 8). At the top of the catalyst (layer 3 in Fig. 8), the cluster is almost depleted in carbon as the cap is being formed on the nanocatalyst surface. The carbon to metal ratio drops to as low as 0.1 (Fig. 8). Metal subsurfaces depleted of C have also been observed during graphene growth on Ni(111) surfaces using X-ray photoelectron spectroscopy (XPS) suggesting that the presence of C free subsurface layers may act as catalyst for both diffusion of C from the bulk and desorption at the surface for incorporation of C to the graphene.59 Classical molecular dynamics and DFT static optimizations of Ni and Fe floating catalysts during nucleation of SWCNTs have also demonstrated variations of the C concentration in the particle.31,33 In contrast with what is observed here with supported catalysts, the relative C distribution for the floating catalysts is found to be more homogenous throughout the nanoparticle31 and different carbide configurations are reportedly similar in stability, indicating that carbide intermediate species with different configurations may be likely to co-exist.33 | ||
| Fig. 7 Z-density profiles for two intervals of 2.5 ns within the nucleation stage in RMD simulations. The location of the peaks indicates the presence of a high atomic density in a 0.01 nm thick slice, parallel to the support plane located at z = 0. | ||
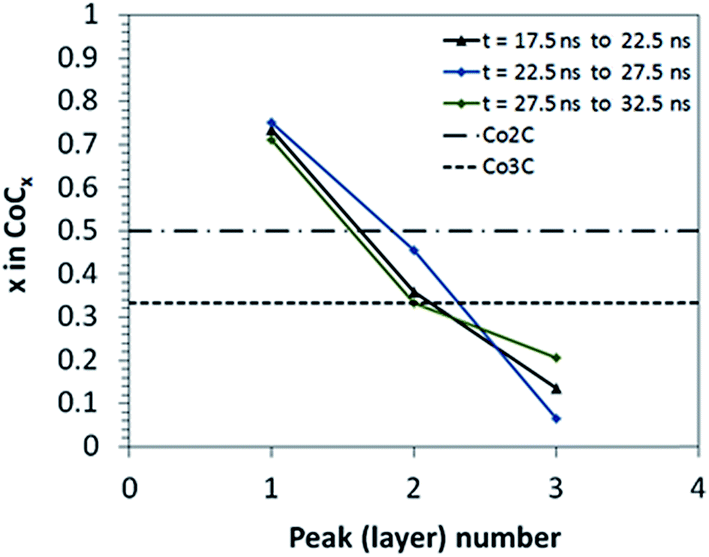 | ||
| Fig. 8 Local concentration profiles of carbon atoms relative to metal atoms at the nucleation stage from RMD simulations. Each concentration curve corresponds to an interval of 5 ns, computed as an average of concentrations obtained from two consecutive Z-density profiles of 2.5 ns each. The concentration points are obtained from Z-carbon density profiles reported in Fig. 7 and S1.† Layers are numbered 1 to 3 from the bottom to the top layer. The horizontal lines indicate the C/Co atomic ratio of two known carbide phases: Co2C and Co3C. | ||
AIMD simulations of a graphene seed deposited on top of the supported Co2C/MgO nanoparticles show a similar trend (Fig. 9). Three atomic layers can be identified: the bottom layer containing Co atoms located atop O atoms in the substrate, a middle layer containing C atoms and a top layer consisting of Co atoms in contact with the graphene seed after 1/3 of the C atoms from inside the nanoparticle are incorporated into the graphene structure that adopts a cap shape. In agreement with the C concentration profile discussed in Fig. 8, C atoms are distributed in the middle layer and between layers with decreasing local composition from bottom to top (i.e. 4 C atoms between layers 1 and 2, 3 C atoms in layer 2 and 1 C atom between layers 2 and 3). The global composition of C in the nanoparticle changes from Co2C to Co3C due to the incorporation of C atoms to the graphene, which also allows the graphene fragment to reorganize its structure including pentagons and inducing curvature into the structure. Typical meta-stable carbides present in the bulk Co–C phase diagram (e.g. Co2C and Co3C) can be formed following saturation of carbon in the solid solution, accompanied by carbon precipitation as graphene.60 Our model emulates the limit of ultra-low pressure during growth, therefore diminishing the dynamics of C migration and incorporation of C to the graphene, and causing the global Co–C stoichiometry inside the nanoparticle to be stabilized as Co3C.
 | ||
| Fig. 9 Snapshot from AIMD simulations (t = 3 ps) of the Co2C/MgO + graphene model with insets for the carburized nanoparticle with graphene (top right) and top view of the contact layer of Co atoms deposited on MgO (bottom right). Color code: Mg atoms in green, O atoms in red, Co atoms in blue and C atoms in brown. | ||
This analysis suggests that the carbon cap forms out of carbon atoms supplied from the nanocatalyst particle topmost layer, which in turn compensates its depletion taking carbon atoms from lower layers via diffusion, as observed in RMD simulations. The linear concentration gradient depicted in Fig. 8 is then roughly kept throughout the nucleation stage, exhibiting a wide range of carbon concentrations, including Co2C and Co3C carbide stoichiometric relations in the heart of the catalyst nanoparticle. The nucleation process ends with the formation of a graphitic carbon cap extended all over the top catalyst, which covers at least the two topmost layers of metal.
Furthermore, we use atomic-resolution images extracted from real-time videos to measure the distances between atomic columns and angles between them to identify the metal and or carbide phase present during growth. We have established an image process scheme to locate the position the atomic columns by template matching. For each atomic column, the distances between neighboring atom columns were averaged, and these values were used to identify the structure and thereby composition of the area (Co or Co-carbide). Prior to CNT formation, CoO nanoparticles are reduced to Co during C2H2 exposure before converting to Co3C and then to Co2C, as reported earlier.25 Moreover, nanoscale chemical analysis confirmed that the Mo, though present in the catalyst–support system, was not present in any of the nano-particles, whether these nanoparticles were active or inactive for SWCNT growth. Therefore the role of Mo is not clear at this point and therefore not included in our simulations. However, during the nucleation process (13.4 s to 14.24 s), the images show the presence of Co-carbides (Co2C or Co3C) in the layers close to the support, and a depletion of carbon away from the support (mostly pure Co) (Fig. 10), which is in agreement with our RMD and AIMD results. Similar results have been predicted by combining TEM images and concentration profiles obtained by numerically solving a steady-state diffusion equation for Ni nanoparticles during plasma enhanced CVD. Precipitation rates were predicted to be higher just below the gas–metal surface in correlation with the concentration gradient.61 In our simulation studies, small fluctuations of the C concentration profile with time are observed, suggesting that precipitation rates and thus nanotube growth rates may also fluctuate due to changes in carbon solubility and diffusion in different regions of the nanoparticle.
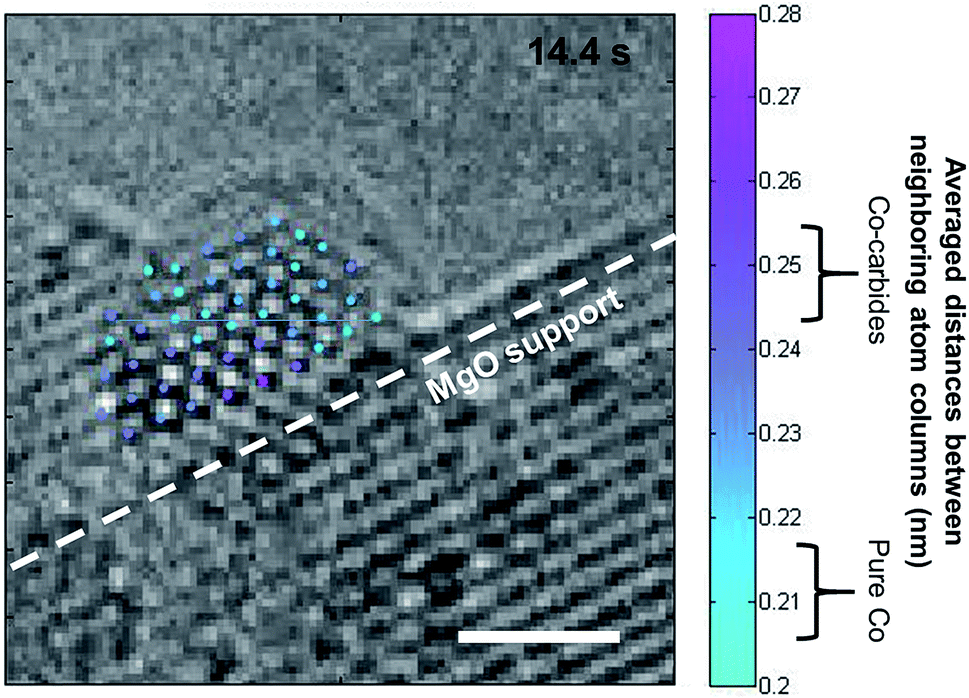 | ||
| Fig. 10 Atomic-resolution image in the cap nucleation stage. Atom columns of the catalyst nanoparticle are located and colored according to their average distances between neighboring atom columns (gradient color maps from light blue to purple). Regions of Co-carbides and pure Co in the particle show the carbon depletion zone away from the MgO support and covered by the carbon cap. Scale bar is 1 nm. | ||
Conclusions
The dynamic evolution of supported Co carbide nanoparticles (Co2C/MgO) during the nucleation stage of single-walled carbon nanotube growth was explored using reactive- and ab initio molecular dynamics simulations coupled with in situ environmental transmission electron microscopy imaging. Changes in the nanocatalyst shape and composition are examined throughout the nucleation process beginning with carbon dissolution, diffusion and formation of carbon chains on the surface until a cap is fully formed and the nanotube structure defined. The amount of carbon dissolved in the carbide-like nanoparticle decreases as C atoms precipitate at the surface. Once nucleation of the surface C atoms begins, a steady state global C concentration is reached. Changes in the nanoparticle shape occur linked with changes in the dynamics of C atoms according to experiments and RMD simulations: a decrease of the nanoparticle height and spreading over the substrate is observed while the C composition is stabilized, no changes occur as the cap is being formed, and subsequent elongation and shape recovery take place due to interactions with the cap as it lifts off. The main two factors influencing nanoparticle shape and C distribution can thus be summarized as: interactions with the substrate and interactions with the nascent nanotube. The nanoparticle evolution in relation to its interaction with the substrate from AIMD studies reveals that the nanoparticle–substrate interface is dominated by interactions between Co atoms located atop O atoms in the substrate. Strong nanoparticle–substrate interactions are characterized by electron transfer and re-arrangement of Co atoms at the interface stemming from a given Co2C surface termination (i.e. (020) and (210)). The interactions of the nanocatalyst with the cap are responsible for the C gradient observed along the direction perpendicular to the substrate in both simulations and experiments. This suggests that the catalyst topmost layer is a primary source of C atoms for the formation of the nanotube cap. Overall, the combination of atomistic simulations and in situ observation of SWCNT growth provides insights into the fundamental phenomena driving the observed changes in the nanoparticle and allows the identification of key aspects for the formulation of models and mechanisms to better understand and control the catalytic process.Acknowledgements
The computational work was supported by the US Department of Energy, Basic Energy Sciences, under grant DE-FG02-06ER15836. Computational resources from TAMU Supercomputer Facility, Brazos Cluster at Texas A&M University, and Texas Advanced Computing Center (TACC) are gratefully acknowledged.References
- G. S. Tulevski, A. D. Franklin, D. Frank, J. M. Lobez, Q. Cao, H. Park, A. Afzali, S.-J. Han, J. B. Hannon and W. Haensch, ACS Nano, 2014, 8, 8730–8745 CrossRef CAS
.
- Q. Cao and S.-J. Han, Nanoscale, 2013, 5, 8852–8863 RSC
- A. D. Franklin and Z. Chen, Nat. Nanotechnol., 2010, 5, 858–862 CrossRef CAS PubMed
- Z. Liu, L. Jiao, Y. Yao, X. Xian and J. Zhang, Adv. Mater., 2010, 22, 2285–2310 CrossRef CAS PubMed
- M. Zheng, A. Jagota, E. D. Semke, B. A. Diner, R. S. McLean, S. R. Lustig, R. E. Richardson and N. G. Tassi, Nat. Mater., 2003, 2, 338–342 CrossRef CAS PubMed
- R. Krupke, F. Hennrich, H. V. Löhneysen and M. M. Kappes, Science, 2003, 301, 344–347 CrossRef CAS PubMed
- X. Li, X. Tu, S. Zaric, K. Welsher, W. S. Seo, W. Zhao and H. Dai, J. Am. Chem. Soc., 2007, 129, 15770–15771 CrossRef CAS PubMed
- M. S. Arnold, A. A. Green, J. F. Hulvat, S. I. Stupp and M. C. Hersam, Nat. Nanotechnol., 2006, 1, 60–65 CrossRef CAS PubMed
- F. Bonaccorso, T. Hasan, P. H. Tan, C. Sciascia, G. Privitera, G. Di Marco, P. G. Gucciardi and A. C. Ferrari, J. Phys. Chem. C, 2010, 114, 17267–17285 CAS
- V. Jourdain and C. Bichara, Carbon, 2013, 58, 2–39 CrossRef CAS
- Y. Yao, X. Dai, R. Liu, J. Zhang and Z. Liu, J. Phys. Chem. C, 2009, 113, 13051–13059 CAS
- E. C. Neyts, A. C. van Duin and A. Bogaerts, J. Am. Chem. Soc., 2011, 133, 17225–17231 CrossRef CAS PubMed
- H. Zhu, K. Suenaga, J. Wei, K. Wang and D. Wu, J. Cryst. Growth, 2008, 310, 5473–5476 CrossRef CAS
- S. Reich, L. Li and J. Robertson, Chem. Phys. Lett., 2006, 421, 469–472 CrossRef CAS
- K. K. Koziol, C. Ducati and A. H. Windle, Chem. Mater., 2010, 22, 4904–4911 CrossRef CAS
- J. Kong, A. M. Cassell and H. Dai, Chem. Phys. Lett., 1998, 292, 567–574 CrossRef CAS
- W. E. Alvarez, F. Pompeo, J. E. Herrera, L. Balzano and D. E. Resasco, Chem. Mater., 2002, 14, 1853–1858 CrossRef CAS
- A. Oberlin, M. Endo and T. Koyama, J. Cryst. Growth, 1976, 32, 335–349 CrossRef CAS
- M. Lin, J. P. Y. Tan, C. Boothroyd, K. P. Loh, E. S. Tok and Y.-L. Foo, Nano Lett., 2006, 6, 449–452 CrossRef CAS PubMed
- D. Takagi, Y. Homma, H. Hibino, S. Suzuki and Y. Kobayashi, Nano Lett., 2006, 6, 2642–2645 CrossRef CAS PubMed
- C. T. Wirth, B. C. Bayer, A. D. Gamalski, S. Esconjauregui, R. S. Weatherup, C. Ducati, C. Baehtz, J. Robertson and S. Hofmann, Chem. Mater., 2012, 24, 4633–4640 CrossRef CAS
- M. Audier, A. Oberlin and M. Coulon, J. Cryst. Growth, 1981, 55, 549–556 CrossRef CAS
- S. Hofmann, R. Sharma, C. Ducati, G. Du, C. Mattevi, C. Cepek, M. Cantoro, S. Pisana, A. Parvez, F. Cervantes-Sodi, A. C. Ferrari, R. Dunin-Borkowski, S. Lizzit, L. Petaccia, A. Goldoni and J. Robertson, Nano Lett., 2007, 7, 602–608 CrossRef CAS
- H. Yoshida, S. Takeda, T. Uchiyama, H. Kohno and Y. Homma, Nano Lett., 2008, 8, 2082–2086 CrossRef CAS PubMed
- M. Picher, P. A. Lin, J. L. Gomez-Ballesteros, P. B. Balbuena and R. Sharma, Nano Lett., 2014, 14, 6104–6108 CrossRef CAS PubMed
- J. Gavillet, A. Loiseau, C. Journet, F. Willaime, F. Ducastelle and J.-C. Charlier, Phys. Rev. Lett., 2001, 87, 275504 CrossRef CAS PubMed
- M. Moseler, F. Cervantes-Sodi, S. Hofmann, G. Csányi and A. C. Ferrari, ACS Nano, 2010, 4, 7587–7595 CrossRef CAS PubMed
- W. Qi, Phys. B, 2005, 368, 46–50 CrossRef CAS
- J. C. Burgos, E. Jones and P. B. Balbuena, J. Phys. Chem. C, 2011, 115, 7668–7675 CAS
- M. H. Rümmeli, F. Schäffel, C. Kramberger, T. Gemming, A. Bachmatiuk, R. J. Kalenczuk, B. Rellinghaus, B. Büchner and T. Pichler, J. Am. Chem. Soc., 2007, 129, 15772–15773 CrossRef PubMed
- F. Ding and K. Bolton, Nanotechnology, 2006, 17, 543 CrossRef CAS
- A. J. Page, H. Yamane, Y. Ohta, S. Irle and K. Morokuma, J. Am. Chem. Soc., 2010, 132, 15699–15707 CrossRef CAS PubMed
- Z. Yang, Q. Wang, X. Shan, S.-W. Yang and H. Zhu, Phys. Chem. Chem. Phys., 2014, 16, 19654–19660 RSC
- A. Börjesson and K. Bolton, J. Phys. Chem. C, 2010, 114, 18045–18050 Search PubMed
- A. Martinez-Limia, J. Zhao and P. Balbuena, J. Mol. Model., 2007, 13, 595–600 CrossRef CAS PubMed
- W. B. Donald, A. S. Olga, A. H. Judith, J. S. Steven, N. Boris and B. S. Susan, J. Phys.: Condens. Matter, 2002, 14, 783 CrossRef
- J. Tersoff, Phys. Rev. B: Condens. Matter Mater. Phys., 1989, 39, 5566–5568 CrossRef
- A. P. Sutton and J. Chen, Philos. Mag. Lett., 1990, 61, 139–146 CrossRef
- S. K. Nayak, S. N. Khanna, B. K. Rao and P. Jena, J. Phys. Chem. A, 1997, 101, 1072–1080 CrossRef CAS
- K. N. Saroj, S. N. Khanna, B. K. Rao and P. Jena, J. Phys.: Condens. Matter, 1998, 10, 10853 CrossRef
- S.-P. Huang and P. B. Balbuena, J. Phys. Chem. B, 2002, 106, 7225–7236 CrossRef CAS
- E. Heifets, Y. F. Zhukovskii, E. A. Kotomin and M. Causá, Chem. Phys. Lett., 1998, 283, 395–401 Search PubMed
- C. T. Campbell and D. E. Starr, J. Am. Chem. Soc., 2002, 124, 9212–9218 CrossRef CAS PubMed
- D. Matsunaka and Y. Shibutani, Phys. Rev. B: Condens. Matter Mater. Phys., 2008, 77, 165435 CrossRef
- G. Barcaro and A. Fortunelli, J. Chem. Theory Comput., 2005, 1, 972–985 CrossRef CAS PubMed
- G. Kresse and J. Furthmüller, Phys. Rev. B: Condens. Matter Mater. Phys., 1996, 54, 11169 CrossRef CAS
- G. Kresse and J. Furthmüller, Comput. Mater. Sci., 1996, 6, 15–50 CrossRef CAS
- G. Kresse and J. Hafner, Phys. Rev. B: Condens. Matter Mater. Phys., 1993, 47, 558 CrossRef CAS
- G. Kresse and J. Hafner, Phys. Rev. B: Condens. Matter Mater. Phys., 1993, 48, 13115 CrossRef CAS
- G. Kresse and J. Hafner, Phys. Rev. B: Condens. Matter Mater. Phys., 1994, 49, 14251 CrossRef CAS
- J. P. Perdew, K. Burke and M. Ernzerhof, Phys. Rev. Lett., 1996, 77, 3865 CrossRef CAS PubMed
- G. Kresse and D. Joubert, Phys. Rev. B: Condens. Matter Mater. Phys., 1999, 59, 1758 CrossRef CAS
- P. E. Blöchl, Phys. Rev. B: Condens. Matter Mater. Phys., 1994, 50, 17953 CrossRef
- G. Henkelman, A. Arnaldsson and H. Jónsson, Comput. Mater. Sci., 2006, 36, 354–360 CrossRef
- W. Tang, E. Sanville and G. Henkelman, J. Phys.: Condens. Matter, 2009, 21, 084204 CrossRef CAS PubMed
- A. Goyal, D. A. Wiegand, F. J. Owens and Z. Iqbal, Chem. Phys. Lett., 2007, 442, 365–371 CrossRef CAS
- R. Rao, R. Sharma, F. Abild-Pedersen, J. K. Norskov and A. R. Harutyunyan, Sci. Rep., 2014, 4, 6510 CrossRef CAS PubMed
- D. A. Gómez-Gualdrón, G. D. McKenzie, J. F. J. Alvarado and P. B. Balbuena, ACS Nano, 2011, 6, 720–735 CrossRef PubMed
- A. Benayad and X.-S. Li, J. Phys. Chem. C, 2013, 117, 4727–4733 CAS
- H. Baker, Materials Park, OH: ASM International, 1992. 1. 1, 1992 Search PubMed
- C. Ducati, I. Alexandrou, M. Chhowalla, J. Robertson and G. A. J. Amaratunga, J. Appl. Phys., 2004, 95, 6387–6391 CrossRef CAS
Footnote |
| † Electronic supplementary information (ESI) available. See DOI: 10.1039/c5ra21877b |
| This journal is © The Royal Society of Chemistry 2015 |