Correlation of disorder between S. cerevisiae interacting proteins†‡
Kevin
Rue-Albrecht
ab,
Denis C.
Shields
a and
Nora
Khaldi
*a
aUCD Conway Institute of Biomolecular and Biomedical Research, School of Medicine and Medical Sciences, and UCD Complex and Adaptive Systems Laboratory, University College Dublin, Dublin 4, Republic of Ireland. E-mail: kevin.rue@ucdconnect.ie; denis.shields@ucd.ie; nora.khaldi@ucd.ie; Fax: +353 1 716 5396; Tel: +353 1 716 5335
bEcole Polytechnique de l'Université de Nice, Sophia Antipolis, 1645 Route des Lucioles, 06410 Biot, France
First published on 23rd November 2011
Abstract
Protein disorder has been frequently associated with protein–protein interaction. However, our knowledge of how protein disorder evolves within a network is limited. It is expected that physically interacting proteins evolve in a coordinated manner. This has so far been shown in their evolutionary rate, and in their gene expression levels. Here we examine the percentage of predicted disorder residues within binary and complex interacting proteins (physical and functional interactions respectively) to investigate how the disorder of a protein relates to that of its interacting partners. We show that the level of disorder of interacting proteins are correlated, with a greater correlation seen among proteins that are co-members of the same complex, and a lesser correlation between proteins that are documented as binary interactors of each other. There is a striking variation among complexes not only in their disorder, but in the extent to which the proteins within the complex differ in their levels of disorder, with RNA processes and protein binding complexes showing more variation in the disorder of their proteins, whilst other complexes show very little variation in the overall disorder of their constituent proteins. There is likely to be a stronger selection for complex subunits to have similar disorder, than is seen for proteins involved in binary interactions. Thus, binary interactions may be more resilient to changes in disorder than are complex interactions. These results add a new dimension to the role of disorder in protein networks, and highlight the potential importance of maintaining similar disorder in the members of a complex.
Background
Intrinsic protein disorder—or simply protein disorder—defines a part of a protein that does not adopt a stable tertiary structure and is therefore more flexible.1 The increasing interest in protein disorder comes mainly as a consequence of the key role it plays in molecular recognition, assembly, and—in more general terms—in cellular signaling pathways.2,3 Indeed, the folding freedom of the disordered regions allows proteins to adopt a wide range of conformations, and thus, confer to the whole protein important features in binding partners and complexes.4The flexibility and functionality disorder provides to a protein is just one side of the story. Indeed, the importance of disorder in protein–protein interactions is increasingly considered highly beneficial for protein complexes. Besides the proposed benefits such as hosting sites for post-translational modifications, and providing an interface for binding of other partners, it has been argued that disorder can increase the stability and prevent degradation of complexes.5–10 Disorder is also thought to increase the backbone conformational entropy upon ligand binding.11–13
Some studies have focused on protein disorder in the context of an interaction network, one of these include a study by Hegyi et al.14 This study has shown a significant correlation between disorder and the number of protein subunits of a complex. Another example is that hub proteins (defined as proteins that have many interaction partners) tend to have more disorder when compared to non-hub proteins.15–18 Kim PM and co-authors19 showed that proteins with single interfaces, which have significantly higher levels of disorder, seem to also have partners with significantly more disorder than other types of proteins. So, multiple hub proteins, which have less disorder than single-hub proteins, interact with proteins that like them also have less disorder than the partners of single interface proteins. Hence, it seems reasonable to hypothesize that the level of disorder in proteins may be linked somehow to the disorder level in their interacting partners. In other words, is there a mechanism governing the overall disorder of a set of interacting partners?
Our interest in this study is three-fold. Firstly, as mentioned above, we want to examine if there exists a correlation between the disorder level of a set of interacting proteins. In other terms, are interacting proteins correlated in their disorder levels?
Secondly, to determine the functional constraints giving rise to such correlations, we contrasted two types of interactions: binary interactions and complex interaction. Fundamental differences exist between both types of interaction. Binary interaction include a wide range of high and low affinity protein–protein transient interactions,20 while the interactions between proteins in complexes are usually more stable and persistent in time. We wanted to examine the disorder of proteins in both binary and complex interactions, as this will help shed light on possible differences on how the type of interaction can affect the disorder in interacting partner(s). In other words does the level of disorder in the individual proteins of a complexes share similar evolutionary constraints as that of the binary interactions?
Thirdly, we wished to investigate whether protein complexes with widely divergent levels of disorder among their constituent proteins, and those with proteins of similar disorder, might represent different types of complexes.
To investigate these questions we use the protein sequence data of S. cerevisiae along with its interaction data to examine the correlation of the level of disorder in a protein with the level in its interacting partners. We show that the level of disorder in a protein and its interacting partners is often correlated and that this correlation is significantly higher than seen in non-interacting proteins. We argue that interacting proteins may co-evolve in their disorder levels and that selection seems to be maintaining similar levels of disorder in some interacting partners and less so in others. We investigate which complexes in terms of cellular function have similar disorder levels in the individual interacting proteins, and seem to be under this selection, and which are not.
Results
We used two sets of high-confidence protein interaction data.20,21 The first set includes 1809 binary protein–protein interaction involving 1278 proteins.20,22,23 The second set includes complex interactions involving 1627 proteins in 408 complexes (We only considered 1615 because although the initial set contained 1627 proteins, we only considered S. cerevisiaeproteins with known IDs). Binary and complex data allowed us to examine the disorder level of a protein and that of its interacting partners, whether those partners were more transient interactions (represented by the binary data), or more stable and permanent interactions regardless of whether they physically do or do not interact (represented by the complex data).From the binary set we identified 1799 interactions involving 1271 proteins. The numbers of binary partners of a protein varied from 1 to 84, with an average of 2.6 partners per protein. Regarding the complex interactions we find 11![[thin space (1/6-em)]](https://www.rsc.org/images/entities/char_2009.gif) 136 interactions with an average of 18.3 partners per interaction, complex size varies from 2 to 81 proteins.
136 interactions with an average of 18.3 partners per interaction, complex size varies from 2 to 81 proteins.
In the remainder of this work, and for simplicity reasons, we will refer to the percentage of disordered residues (IUPred score > 0.5) in a protein as the level of disorder in a protein (see Methods).
Correlation of disorder in S. cerevisiaeproteins and their interacting partners
To investigate if protein disorder correlates with the disorder of its interacting proteins, we examined Pearson's correlation between the disorder of each protein and the average disorder in all its partners (calculated as the sum of disordered residues in each partner divided by the total sequence length of all partners), the usual significance of the correlation coefficient or regression is potentially inaccurate. Accordingly, we removed self-interactions, as these will obviously be correlated. If the levels of disorder of the protein pairs in our 1557 interactions were co-evolving, we would expect a higher correlation between the interacting proteins than between non-interacting proteins. We repeated the random simulation 100 times (Fig. 1–A; see methods). We found that the correlation of the disorder of the 1165 proteins and their binary interaction partners (r = 0.13) is significantly higher (p < 0.01) than random (Fig. 1–A; The values for the sampling distribution are median r = −0.004; min r = −0.094; max r = 0.061). These results suggest that there is a correlation of proteins' disorder with the disorder of their binary interacting proteins.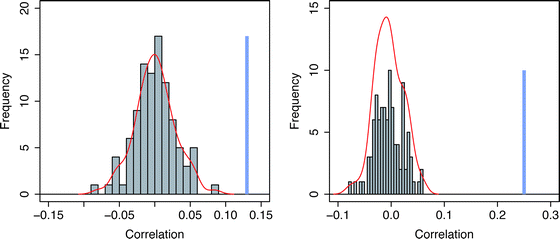 | ||
| Fig. 1 Comparison of the correlation coefficient of disorder between interacting proteins , and non-interacting proteins in S. cerevisiae. (A) Histogram representing the distribution of 100 correlations in disorder level between each protein, and the set of all random non-interacting partners generated from the binary interaction dataset. The blue vertical line in bold represents the correlation of the real data at x = 0.13 (p = 6e−06). The density line of the random distribution is represented in red. (B) Similar to (A) but generated from the S. cerevisiae complex dataset. When two ohnologs share the exact same set of partners, we only considered the most disordered protein of the pair which reduced the set from 1615 to 1525 proteins. The blue vertical line in bold represents the correlation of the real data at x = 0.25 (p < 2.2e−16). The density line of the random distribution is represented in red. | ||
We carried out a similar analysis for the protein complexes retrieved from the high-confidence protein–protein interactions involving 1615 proteins (Fig. 1–B).21 Because most complexes containing ohnologs (genes duplicated as part of a genome duplication) usually contain both ohnologs, we chose to only represent the highest disordered ohnolog if both were present in the same complex, which reduced the set to 1525 proteins. For this set we also observe a correlation between the disorder of a protein and the disorder in its interacting partners (r = 0.25, p < 2.2e−16; robust simulation-based p < 0.01, Fig. 1–B).
It is of interest to note that the mean disorder is quite similar in the proteins present in complexes but without binary interactors (0.19) and in those with binary partners but not found in any complexes (0.19), but is curiously somewhat higher in the 449 proteins that have information on both datasets (0.22).
The values of the correlations although low, are shown by the random simulation of non-interacting proteins to be significant. Indeed our results show that the correlation values between interacting proteins are significantly higher than that of non-interacting proteins. At the same time the low values of the correlations in binary and complex interactions is interesting in that it reflects the diverse nature of the complexes. Some proteins within a complex will have higher disorder correlation with their partners, while other may vary. This diverse nature may come as a result of the different functions of the complexes and their differing functional constraints.
A general pattern for disorder correlation between interacting proteins across a range of disorder values
Proteins and their partners display considerable variation in predicted disorder (0 to 100%). While we noted a correlation between proteins and their partners, we wanted to investigate if this correlation is seen across the whole range of disorder estimates, or is primarily caused by proteins with a certain degree of disorder. Accordingly, we binned the 1165 proteins with one or more binary interactors into 20 bins according to their predicted fraction of disorder (Fig. 2). Each bin represents an increment of 5% disorder compared to the next bin (Fig. 2). For each bin we calculated the average disorder in all the binary interaction partners of proteins found in the bin. We also carried out the same process with randomly picked binary interaction partners. We noted that the correlation between the disorder in each bin and the disorder of the partners was 0.43. This value of correlation is only reached 3 times for the 100 random correlations we calculated, indicating that it exceeds random expectations (i.e., p = 0.03). Thus, there appears to be a general trend whereby interacting proteins have similar disorder, regardless of their predicted proportion of disordered residues (Fig. 2). | ||
| Fig. 2 Correlation between the level of disorder in a protein and that found in its binary interacting proteins , binned accordingly to the level of disorder in each protein . The x-axis represents the level of disorder in a protein, which is split in 20 bins, representing an increment of 5% in disorder level from one bin to the next. A 100% for example represents fully disordered proteins. The y-axis represents the average disorder level found in all the interacting proteins. The dashed line represents the linear regression. Error bars are represented in black vertical lines around each point. The correlation coefficient is r = 0.43, with p = 0.03. | ||
Marked differences among complexes in the extent of their disorder variation among proteins
The results above show that many interacting proteins tend to have similar levels of disorder, however the correlations are relatively modest, so it is possible that this is seen in some complexes, but less so in others. At the simplest level, some complexes will have a lot of proteins that are highly disordered, some that are highly ordered, and others a mixture of both.To examine the diversity of the complexes in terms of the disorder of their individual proteins, we used the standard deviation of disorder between proteins of a complex. The standard deviation will capture if the proteins of a complex share homogenous or heterogeneous levels of disorder. We plotted the mean disorder of the proteins within in each complex against the standard deviation (Fig. 3; supplementary file 1). We split the graph into nine bins for ease of further analysis. We were particularly interested in complexes which have high degree of disorder in their proteins and an important variation in the level of their disorder (bins 8 [mean disorder between 0.16–0.35 and std > 0.3]; and bin 9 [mean disorder > 0.35 and std > 0.3]), which contrasted with those with a similar level of disorder, but much less variation between the proteins within the complex (bins 2 [mean disorder between 0.16–0.35 and std < 0.12]; and bin 3 [mean disorder > 0.35 and std < 0.12]).
 | ||
| Fig. 3 Segregation of the proteins complexes according to the level of variation in disorder level between the members of a complex. The 9 numbered bins represent different average and variations of disorder level of the proteins within each of the complex interaction dataset (see methods for bin border information). The whiskers of the boxplot on the x and y-axis represent the 1st quartile, median, 3rd quartile of the average and standard deviation level of disorder respectively. | ||
Complexes where all the proteins have high disorder may relate to common localization in subcellular locations where high disorder is acceptable or indeed desirable. We wished to understand these and other potential biological reasons underlying this striking variation. Accordingly, we investigated the distribution of Gene Ontology (GO) terms among the complexes shown in Fig. 3.
Distinguishing features among complexes with high and low mean disorder
Firstly, we wished to establish the background relationship between mean disorder of the subunits of a complex and the biological roles. To our knowledge there is no clear way to classify all 408 complexes of our study in terms of function. Therefore, to examine what complexes seem to be under selection to have a maintained disorder level in all their member proteins we analyzed the GO-term enrichment of the proteins that are found in the different complexes. To study the GO-term enrichment of the individual proteins in each bin of Fig. 3 while also taking the mean disorder of the complex subunits into account we ranked the genes according to the mean disorder of their complexes. We then assessed which GO-terms were particularly associated with this ranking using Gorilla24,25 revealed that many terms were significantly enriched (supplementary file 2). Among processes, mitochondrion organization was most significant, catalytic activity among functions, and cytoplasmic location among compartments. This latter association is consistent with previous observations that cytoplasmic proteins are more disordered than extracellular ones.26It is interesting to note that although proteins carrying a catalytic activity function have been shown to be depleted in disorder,16 our results show that they are found in complexes with high disorder in many members of the complex. The lack of disorder in proteins with a catalytic activity might be compensated by the high level of disorder in the other members of the complex. This disorder might be to bind the complex together or to regulate it.
Distinguishing features of complexes according to the extent of variation in disorder between their interacting proteins
GO analysis was performed to determine if complexes that contained proteins with large variation between their disorder levels, had different functional roles when compared with complexes that were very similar in their level of protein disorder. We contrasted the proteins lying in bin 9 (high variation in disorder among complexes with an average high disorder amongst their subunits) of Fig. 3, with the background from bins 3, 6 and 9 (sharing high levels of disorder between most members of the protein-complex; mean disorder > 0.35 and std < 0.12 for bin3, std in between 0.12 and 0.3 in bin 6, and std > 0.3 for bin 9), using Gorilla software to investigate differences in Gene Ontology (GO) processes, components and functions. This suggested enrichment of amine metabolic processes (p = 8 × 10⁻⁵; supplementary file 3), but given the small number of genes (7) and the likely inflation of p-values by non-independence of the genes within complexes, we are not sure to what extent this 3.6 fold enrichment is biologically meaningful. The seven genes are from two transcriptional complexes (the cbf1p-met4p-met28p complex, and the ARGR complex).An ideal analysis of GO-term enrichment would just compare the sets of complexes with the most disordered proteins to the complexes with the low disordered proteins. As this analysis was somewhat restricted, being limited to a small number of complexes in bin 9, we wished to analyse the entire dataset of complexes. However, it was important to counter the confusing effect of the enrichment of complexes with highly disordered subunits among the complexes that have a higher standard deviation between the disorder of the subunit. Indeed the pattern of the standard deviation in Fig. 3 gives more emphasis to complexes with high disordered proteins. Accordingly, we calculated the residual of the standard deviation, regressed against the mean disorder of each complex (supplementary Fig. 1). This residual is therefore a quantitative measure of how much variation there is in the disorder between members of a complex, which has been corrected for the observed increase in standard deviation with increasing disorder seen in Fig. 3. While this correction is not perfect, it largely corrects for the bulk of the relationship between disorder and its standard deviation. We then investigated whether there was enrichment of GO terms among the genes that have a high residual standard deviation. Using Gorilla we found that the processes most associated with a high residual (Supplementary file 4) were mRNA metabolism and RNA processing (approximately twofold enrichment with over 120 genes of this category defined as having high residuals). The functions most associated were ribosome, RNA polymerase, and RNA binding. The components most associated were RNA–protein complexes including ribosome and others. Thus, from these three ontologies, a picture emerges that the complexes with the greatest variation in disorder are associated with RNA. Why might this be the case? It is possible that the proteins directly coming into contact with the RNA in these complexes are more disordered, whilst those involved in stabilizing other complex interactions are more ordered. Although most ribosomal proteins are ordered proteins, it has been shown that the ribosomal proteins L15 and L19e have important disorder regions.27,28 These regions becomes ordered upon binding ribosomal RNA but do not take a particular form but rather any shape that will allow them to fill in the gaps in the ribosome structure and bind the necessary parts together.27,28 This function of disorder is referred to as “structural mortar”.
Protein binding: a term enriched in the highly disordered complexes, and under-represented in complexes with varying disorder
Disordered regions often play key roles in protein binding, and therefore we chose to focus on this ontology term in more detail, to determine to what extent the pattern of variation seen in Fig. 3 might relate to protein binding functions.Previous work has shown that disordered proteins are enriched in protein binding classes,1,29–31 and more generally shows the involvement of unstructured regions in binding interactions.32–36 We find that the complexes with high disordered subunits (bin3, 6, and 9; Supplemental 5) are significantly enriched with the term ‘protein binding’ compared to the complexes with the more ordered proteins (1, and 4; bin 7 is empty) (OR = 0.39; 95% CI 0.22–0.68; p = 0.001). We show that complexes with low disorder variation between their subunits (bin2, and 3) are associated more significantly with ‘protein binding’ than complexes with high disorder variation between their subunits (bin8, and 9) (OR = 0.33; 95% CI 0.14–0.79; p = 0.02).
Further, the examination of the percentage of a complex that contains proteins with a ‘protein binding’ designation reveals two results. Firstly this value is much higher for complexes with high disordered subunits compared to ones with low disordered subunits. For example complexes with low disordered proteins (bin1 with an average disorder below 0.16 and a standard deviation below 0.12) contain an average of 14.5% proteins with the term ‘protein binding’, in contrast to 39.6% for complexes with high disorder (bin 3, Supplemental 5). Secondly, this value is much higher for complexes with low disorder variation between its subunits compared to one with high disorder variation between its subunits. For example complexes with low disorder variation between its proteins (bin3) contain an average of 39.6% proteins with the term ‘protein binding’, in contrast to 15% for complexes with high disorder variation between its subunits (bin 9, Supplemental 5). There are five ribosomal complexes over the 408 complexes that we studied. These five complexes contain proteins that bind to both proteins and RNA. Our observation above (protein binding enriched in complexes with low standard deviation of disorder between the subunits) seems to be a general trend. Indeed, this statement remains true for the comparison of bin 3 (high disorder with low standard variation between subunits; Fig. 3), and bin 9 (high disorder with high standard variation between subunits; Fig. 3), which do not contain RNA complexes (Supplemental 1).
These results may reflect the homogeneity in functional terms of the complexes with low variation in the disorder of its proteins (bin 2, and 3; mean disorder between 0.16 and 0.35 and std < 0.12 for bin2; and mean disorder > 0.35 and std < 0.12 for bin3) as opposed to the ones with high variation in the disorder of its proteins (bin 8, and 9; mean disorder between 0.16 and 0.35 and std < 0.3 for bin8; and mean disorder > 0.35 and std > 0.3 for bin9), which inversely, may reflect their functional heterogeneity. Functional homogeneity here has been simply argued for using the term ‘protein binding’, this—although restricted to one term—shows that the diversity in the disorder level of proteins within a complex may be due to very different functionalities played by the different partners in a network. As opposed to this is bin 3 with complexes containing proteins with more functional communalities, thus maybe also explaining the higher correlation in disorder.
Discussion
The growing awareness of the major role protein disorder plays in binding; signaling and other major function is accompanied by the many links to damaging effects it may cause in the cell. For example, the over-expression of disordered proteins may lead to cellular toxicity, as a result of disorder promiscuity.37 These observations highlight firstly, the critical importance of disorder for the cell, and secondly, the need in maintaining a tight control over it.Our work reveals an important feature of disorder in the context of protein networks, namely that proteins of a complex tend to resemble each other in terms of the level of their disorder. When examining a protein's disorder in the context of its interacting partners, we realize that it may be maintained in relation to its network of interacting partners. It is possible that there are evolutionary constraints maintaining the levels of disorder in interacting proteins.
Further, what seems fascinating is the difference between binary interactions, and complex interactions and their effects on the overall disorder of the interacting proteins. The protein disorder in complexes appear to be under tighter control, since protein subunits seems to carry similar levels of disorder more than for the binary interactions. There may be a higher resilience to change in protein disorder in binary interacting proteins than for complex interacting proteins. There are a number of potential reasons why this could be the case, which fall into two broad groupings (1) This might be due to the fact that the proteins of complexes stick together and form blocks influencing each other, than the more transient interactions present in the binary interaction dataset (i.e. the proteins influence each other: such as disordered regions that may interact with each-other). (2) Alternatively, proteins in a complex may share similar functional constraints (in terms of pH, subcellular location, or other common selection pressures).
It has been shown that the amount of disorder of a protein varies greatly depending on its number of binding interfaces.19 For example, single-interface hub proteins (containing one or two binding interfaces) have significantly more disorder than multiple-interface hubs.19 Alongside this result, the interacting partners of single hubs also share the fact of having significantly more disorder than other proteins.19 The authors suggest that this may be explained by the tendency of single hub proteins to bind to each other.19 These findings fit in very well with our results in that their seems to be a constraint on this type of hub protein to correlate by maintaining higher levels of disorder in itself and in its interacting proteins, while the opposite seems to be occurring for multi-hub proteins and their interacting partners (by maintaining lower levels of disorder). It would be of great interest in future work to incorporate the distinct sets of single and multiple hub proteins discussed by Kim PM et al.19 with our results to examine the extent of correlation in disorder levels between these distinct types of proteins and their interactors.
The low value of the correlations we observed is interesting in that it reflects the diverse nature of protein complexes. Some proteins within a complex will have higher disorder correlation with their partners, while other may vary. We have identified that certain complexes are highly disordered, but even among these complexes, we note (Fig. 3; Supplemental Fig. 1) that some show a marked variation in the disorder of their constituent proteins (high standard deviation or high residual variation for a given mean disorder), whilst others appear to have a set of proteins of more similar disorder (low standard deviation or low residual variation for a given mean disorder). We are very interested in the hypothesis that there may be particular evolutionary constraints on certain complexes for a tight co-regulation of the extent of disorder, whilst for other complexes this may be much less. Thus, in certain complexes with high residual deviation, the disorder selective constraints may be on the individual proteins, not on the overall complex. It will be of great interest to determine if such complexes have looser packing, which would enable this. Suggestive indications from our analysis of Gene Ontology would support the idea that complexes that interact with RNA show a high residual deviation, and this may be associated with a looser packing and association, with the RNA sequences providing some structural support to the complex in the place of tighter protein packing.
We found that complexes whose members are associated with “protein-binding” functions tend to have a lower standard variation in their disorder. We interpret this finding with some caution, since some protein-binding functions may themselves be simply defined on the basis of the protein interactions within the complex. It is possible, however, that complexes which play a role in protein binding tend to form complexes in which the level of disorder is similar. This could be for a variety of reasons, for example a series of proteins that bind DNA such as transcription factors, also have important protein binding functions as a complex, recruiting activator and repressor proteins. Complexes which process proteins in various ways, may actively use a certain level of disorder to destabilize or re-fold the proteins they interact with, in the manner of chaperones, and this may impose a constraint for lower variation in their levels of disorder. However, such arguments are currently speculative, and for the moment it is simply an observation, which may represent a useful fact to aid those seeking to interpret the patterns of disorder in complexes with protein binding roles.
The correlations of disorder levels between interacting proteins may suggest a more general phenomenon namely co-evolution. Indeed, if interacting proteins are co-evolving for a given trait, they will clearly share this trait to a significantly greater extent than non-interacting proteins (which is what we show in this work). For example, correlation of the expressions levels of interacting proteins was initially used—as a first step—to suggest possible co-evolution between interacting proteins.38 The hypothesis that the correlation observed underlines a more general trend of co-evolution of disorder levels between interacting proteins is a very attractive and interesting idea. However, it is hard to tease apart whether the similarity in the level of disorder is due to common evolutionary constraints on the interacting proteins, or/and to the actual adaptation of interacting proteins to each other. Although our results may suggest co-evolution and thus selection maintaining the overall disorder of interacting proteins, further studies in the dynamics of these complexes over time should be investigated. One possible approach to investigate this question is to examine changes of disorder in a protein through evolution and how that impacts the disorder in its interacting partners.
Conclusion
The yeast S. cerevisiae provides a useful model to carry out studies to evaluate how interacting partners evolve in their disorder. The study of disorder has been often limited to an individual protein and to the context in which it is found (i.e. interacting network).Here we have shown that disorder correlated in its level between many interacting proteins, arguing for selection maintaining a tight control over its quantity in a protein with regard to its interacting partners. This selection seems to be even greater for complex interactions than for binary interactions. This work emphasizes once more the importance of disorder in a protein in the context of its interacting protein and highlights the pressures exerted on proteins as a result of them being in a partnership.
Methods
Data
For the analyses described in this work, we used the S. cerevisiaeproteins, described in the work of Gordon and co-authors.39Disorder detection
We used IUPred40,41 to detect disorder residues in each S. cerevisiaeprotein. We used the score of 0.5 or greater in IUPred to define a disordered residue in a protein sequence. The level of disorder in a protein is represented by the percentage of disorder, which is the ratio of the number of disordered residues in a protein on the total protein sequence length. The disorder prediction of each protein is predicted based solely on its protein sequence and not on its bound state. Because we are interested in how a protein and all its interacting partners relate in their disorder level, we considered the set of partners as one protein. In other words the disorder in each partner was summed and divided by the total length of the sum of all the proteins lengths.Protein–protein interaction data
We used a list of well-defined binary interactions.20 We also expanded our search to complex interactions explained in ref. 21.The binary interaction dataset20 was obtained from Yeast-2-Hybrid (Y2H) data. This is a method to assess the interaction between two known proteins. The first protein is artificially linked to a binding factor, i.e. a protein region known to bind to a particular motif of DNA. The second protein is artificially linked to a protein region known to enhance the expression of a particular gene. A significant binding of the two proteins of interest will reunite the two protein regions and therefore cause a significant expression of the gene. Y2H may give a certain number of false positive/negative results because of non-specific interactions and non-physiological contexts, but gold standard Y2H datasets have been shown to perform well in representing real biological interactions, when compared with traditional literature data.20
We compare a protein to all the unique subunits of a protein complex. This is to avoid obvious correlation. For the same reason, all interactions that are only involving self-interactions with no other partners were entirely discarded from the analysis.
The complex interaction originates from a manually curated study of complexes identified in both experimental and high-throughput work. Therefore, the dataset has a considerable lower number of proteins compared to the binary set, but is reliable (See http://wodaklab.org/cyc2008/).
Random analysis
To investigate if the disorder in S. cerevisiaeproteins is more correlated with the disorder of its interacting partners than is expected, we reasoned that the correlation in the real data should be significantly higher than the correlation found for non-interacting proteins. In other words we are comparing the disorder of interacting protein to that of non-interacting proteins to examine if the level of disorder is somehow correlating between interacting proteins. For each complex of size n we generated a randomly drawn complex of size n, comprising proteins that have no interactions. We ran this random assignment 100 times. In each run we calculate the Pearson correlation coefficient42 in disorder level between S. cerevisiaeproteins and the disorder level in their assigned partners. The Pearson correlation is calculated as a measure of the degree of correlation between the disorder of a proteins and the disorder of its interacting partners.To calculate the significance of the observed correlation coefficients among interacting pairs, we compared it with set of correlations that we calculated from the random assignment of partners. A p-value is calculated on the basis of how many times the random distribution reached or surpassed the real correlation value.
The non-independence of the correlation calculations does not bias our results. This is because we do not rely on the nominal p-values but carry out random simulations using this same method to calculate the correlations. The significance of our results comes as a result of the real data being significantly higher than the random simulations.
Binning the disorder
Because the variance of the disorder in a protein can vary from 0 to 1 we wanted to investigate the behavior of each disorder interval. To do this we considered bins of 5% disorder that yielded 20 bins (Fig. 2). We then calculated the average level of disorder in the partners of the proteins present in each bin. Similarly to the above we test for the significance of the real data against random data generated as explained above.Binning the complexes
We wanted to examine the proteins that have had the greatest correlation with their partners in terms of the overall genome evolution. To do this we binned the complexes in 9 different bins (Fig. 3) according to the average disorder per complex and the standard deviation of the disorder level within each complex. Finding the edges between bins is arbitrary, as we want to examine extreme cases but also middle cases of disorder. We selected three values for the average disorder level of a complex, these correspond to 0-median average of the disorder (median = 0.16); from the median to 0.35, which corresponds to 32% of the data; and finally the last box contains all complexes above 0.35, representing 18% of the data. For the y-axis representing the standard deviation we selected three boxes, from 0 to the median (=0.12); from the median to 0.3, which corresponds to 37% of the data; and finally the last box contains all complexes with a standard deviation above 0.3 (representing 13% of the data).Go-term enrichment
We used the online tool GOrilla24,25 to estimate any possible enrichment in the sets of complexes according to the bin they were identified in (Fig. 3). We searched the three elements: process, function, and component. We used the indicated background datasets as defined in the results. We also used Gorilla to investigate the enrichment of GO terms in ranked listings of complex disorder, and of the residual of the standard deviation of complex disorder after its multiple regression against mean complex disorder. The p-values that are presented through the text and in the supplementary data are corrected for multiple hypothesis testing, and are provided by GOrilla.Author contributions
Conceived the study: NK. Designed the study: NK, and DS. Carried out the analyses: KR, DS, and NK. Wrote the paper: NK, and DS.Acknowledgements
This work was funded by the Irish Research Council for Science, Engineering and Technology, co-funded by Marie Curie Actions under FP7, and by Science Foundation Ireland (grant number 08/IN.1/B1864).References
- J. J. Ward, J. S. Sodhi, L. J. McGuffin, B. F. Buxton and D. T. Jones, Prediction and functional analysis of native disorder in proteins from the three kingdoms of life, J. Mol. Biol., 2004, 337(3), 635–645 CrossRef CAS.
- P. E. Wright and H. J. Dyson, Intrinsically unstructured proteins: re-assessing the protein structure-function paradigm, J. Mol. Biol., Oct 22 1999, 293(2), 321–331 Search PubMed.
- K. Sugase, H. J. Dyson and P. E. Wright, Mechanism of coupled folding and binding of an intrinsically disordered protein, Nature, Jun 21 2007, 447(7147), 1021–1025 Search PubMed.
- A. Patil, K. Kinoshita and H. Nakamura, Hub promiscuity in protein–protein interaction networks, Int. J. Mol. Sci., 2010, 11(4), 1930–1943 Search PubMed.
- R. Huber and W. S. J. Bennett, Functional significance of flexibility in proteins, Biopolymers, 1983, 22(1), 261–279.
- J. T. Stivers, C. Abeygunawardana and A. S. Mildvan, 15N NMR relaxation studies of free and inhibitor-bound 4-oxalocrotonate tautomerase: backbone dynamics and entropy changes of an enzyme upon inhibitor binding, Biochemistry, 1996, 35(50), 16036–16047 CrossRef CAS.
- B. Mészáros, P. Tompa, I. Simon and Z. Dosztányi, Molecular principles of the interactions of disordered proteins, J. Mol. Biol., 2007, 372(2), 549–561 CrossRef CAS.
- A. B. Sigalov, A. V. Zhuravleva and V. Y. Orekhov, Binding of intrinsically disordered proteins is not necessarily accompanied by a structural transition to a folded form, Biochimie, 2007, 89(3), 419–421 CrossRef CAS.
- P. Tompa and M. Fuxreiter, Fuzzy complexes: polymorphism and structural disorder in protein–protein interactions, Trends Biochem. Sci., 2008, 33(1), 2–8 CrossRef CAS.
- J. H. Fong, B. A. Shoemaker, S. O. Garbuzynskiy, M. Y. Lobanov, O. V. Galzitskaya and A. R. Panchenko, Intrinsic disorder in protein interactions: insights from a comprehensive structural analysis, PLoS Comput. Biol., 2009, 5(3), e1000316 CrossRef.
- E. T. Olejniczak, M. M. Zhou and S. W. Fesik, Changes in the NMR-derived motional parameters of the insulin receptor substrate 1 phosphotyrosine binding domain upon binding to an interleukin 4 receptor phosphopeptide, Biochemistry, 1997, 36(14), 4118–4124 Search PubMed.
- L. Zídek, M. V. Novotny and M. J. Stone, Increased protein backbone conformational entropy upon hydrophobic ligand binding, Nat. Struct. Biol., 1999, 6(12), 1118–1121 CrossRef CAS.
- A. P. Loh, N. Pawley, L. K. Nicholson and R. E. Oswald, An increase in side chain entropy facilitates effector binding: NMR characterization of the side chain methyl group dynamics in Cdc42Hs, Biochemistry, 2001, 40(15), 4590–4600 Search PubMed.
- H. Hegyi, E. Schad and P. Tompa, Structural disorder promotes assembly of protein complexes, BMC Struct. Biol., 2007, 7, 65 CrossRef.
- A. K. Dunker, M. S. Cortese, P. Romero, L. M. Iakoucheva and V. N. Uversky, Flexible nets. The roles of intrinsic disorder in protein interaction networks, FEBS J., Oct 2005, 272(20), 5129–5148 Search PubMed.
- C. Haynes, C. J. Oldfield and F. Ji, et al. Intrinsic disorder is a common feature of hub proteins from four eukaryotic interactomes, PLoS Comput. Biol., Aug 4 2006, 2(8), e100 Search PubMed.
- A. Patil and H. Nakamura, Disordered domains and high surface charge confer hubs with the ability to interact with multiple proteins in interaction networks, FEBS Lett., Apr 3 2006, 580(8), 2041–2045 Search PubMed.
- G. P. Singh, M. Ganapathi and D. Dash, Role of intrinsic disorder in transient interactions of hub proteins, Proteins, Mar 1 2007, 66(4), 761–765 Search PubMed.
- P. M. Kim, A. Sboner, Y. Xia and M. Gerstein, The role of disorder in interaction networks: a structural analysis, Mol. Syst. Biol., 2008, 4, 179.
- H. Yu, P. Braun and M. A. Yildirim, et al. High-quality binary protein interaction map of the yeast interactome network, Science, Oct 3 2008, 322(5898), 104–110 Search PubMed.
- S. Pu, J. Wong, B. Turner, E. Cho and S. J. Wodak, Up-to-date catalogues of yeast protein complexes, Nucleic Acids Res., Feb 2009, 37(3), 825–831 Search PubMed.
- P. Uetz, L. Giot and G. Cagney, et al. A comprehensive analysis of protein–protein interactions in Saccharomyces cerevisiae, Nature, Feb 10 2000, 403(6770), 623–627 Search PubMed.
- T. Ito, T. Chiba, R. Ozawa, M. Yoshida, M. Hattori and Y. Sakaki, A comprehensive two-hybrid analysis to explore the yeast protein interactome, Proc. Natl. Acad. Sci. U. S. A., Apr 10 2001, 98(8), 4569–4574 Search PubMed.
- E. Eden, R. Navon, I. Steinfeld, D. Lipson and Z. Yakhini, GOrilla: a tool for discovery and visualization of enriched GO terms in ranked gene lists, BMC Bioinformatics, 2009, 10, 48 CrossRef.
- E. Eden, D. Lipson, S. Yogev and Z. Yakhini, Discovering motifs in ranked lists of DNA sequences, PLoS Comput. Biol., Mar 23 2007, 3(3), e39 Search PubMed.
- Y. Minezaki, K. Homma and K. Nishikawa, Intrinsically disordered regions of human plasma membrane proteins preferentially occur in the cytoplasmic segment, J. Mol. Biol., 2007, 368(3), 902–913 CrossRef CAS.
- N. Ban, P. Nissen, J. Hansen, P. B. Moore and T. A. Steitz, The complete atomic structure of the large ribosomal subunit at 2.4 A resolution, Science, 2000, 289(5481), 905–920 CrossRef CAS.
- D. J. Klein, P. B. Moore and T. A. Steitz, The roles of ribosomal proteins in the structure assembly, and evolution of the large ribosomal subunit, J. Mol. Biol., 2004, 340(1), 141–177 Search PubMed.
- Y. Minezaki, K. Homma, A. R. Kinjo and K. Nishikawa, Human transcription factors contain a high fraction of intrinsically disordered regions essential for transcriptional regulation, J. Mol. Biol., 2006, 359(4), 1137–1149 CrossRef CAS.
- J. Liu, H. Tan and B. Rost, Loopy proteins appear conserved in evolution, J. Mol. Biol., 2002, 322(1), 53–64 CrossRef CAS.
- D. M. Bustos and A. A. Iglesias, Intrinsic disorder is a key characteristic in partners that bind 14-3-3 proteins, Proteins, 2006, 63(1), 35–42 Search PubMed.
- A. K. Dunker, C. J. Brown, J. D. Lawson, L. M. LAkoucheva and Z. Obradovic, Intrinsic disorder and protein function, Biochemistry, 2002, 41(21), 6573–6582 CrossRef CAS.
- A. H. Huber, D. B. Stewart, D. V. Laurents, W. J. Nelson and W. WI, The cadherin cytoplasmic domain is unstructured in the absence of b-catenin. A possible mechanism for regulating cadherin turnover, J. Biol. Chem., 2001, 276(15), 12301–12309 CrossRef CAS.
- T. Weiki, K. Abelmann and J. Buchner, An unstructured C-terminal region of the Hsp90 co-chaperone p23 is important for its chaperone function, J. Mol. Biol., 1999, 293(3), 685–691 Search PubMed.
- K. Tozawa, C. J. Macdonald and C. N. Penfold, et al. Clusters in an intrinsically disordered protein create a protein-binding site: the TolB-binding region of colicin E9, Biochemistry, 2005, 44(34), 11496–11507 Search PubMed.
- H. J. Dyson and P. E. Wright, Intrinsically unstructured proteins and their functions, Nat. Rev. Mol. Cell Biol., 2005, 6(3), 197–208 CrossRef CAS.
- T. Vavouri, J. I. Semple, R. Garcia-Verdugo and B. Lehner, Intrinsic protein disorder and interaction promiscuity are widely associated with dosage sensitivity, Cell, Jul 10 2009, 138(1), 198–208 Search PubMed.
- H. B. Fraser, A. E. Hirsh, D. P. Wall and M. B. Eisen, Coevolution of gene expression among interacting proteins, Proc. Natl. Acad. Sci. U. S. A., Jun 15 2004, 101(24), 9033–9038 Search PubMed.
- J. L. Gordon, K. P. Byrne and K. H. Wolfe, Additions, losses, and rearrangements on the evolutionary route from a reconstructed ancestor to the modern Saccharomyces cerevisiae genome, PLoS Genet., May 2009, 5(5), e1000485 Search PubMed.
- Z. Dosztanyi, V. Csizmok, P. Tompa and I. Simon, IUPred: web server for the prediction of intrinsically unstructured regions of proteins based on estimated energy content, Bioinformatics, Aug 15 2005, 21(16), 3433–3434 Search PubMed.
- Z. Dosztanyi, V. Csizmok, P. Tompa and I. Simon, The pairwise energy content estimated from amino acid composition discriminates between folded and intrinsically unstructured proteins, J. Mol. Biol., Apr 8 2005, 347(4), 827–839 Search PubMed.
- R. R. Sokal and F. G. Rohlf, The Principles and Practice of Statistics in Biological Research, Biometry, New York, 3rd edn, 1995 Search PubMed.
Footnotes |
| † Published as part of a Molecular BioSystems themed issue on Intrinsically Disordered Proteins: Guest Editor M. Madan Babu. |
| ‡ Electronic supplementary information (ESI) available. See DOI: 10.1039/c1mb05214d |
| This journal is © The Royal Society of Chemistry 2012 |