 Open Access Article
On-line liquid chromatography neutral loss-triggered electron transfer dissociation mass spectrometry for the targeted analysis of citrullinated peptides†
Andrew J.
Creese
ab,
Melissa M.
Grant
a,
Iain L. C.
Chapple
a and
Helen J.
Cooper
*b
aSchool of Dentistry, Periodontal Research Group, University of Birmingham, St Chads Queensway, Birmingham, B4 6NN, UK
bSchool of Biosciences, University of Birmingham, Birmingham, B15 2TT, UK. E-mail: H.J.Cooper@bham.ac.uk
First published on 1st December 2010
Abstract
Citrullination is a post-translational modification of proteins which deiminates arginine, increasing the mass by 0.98 Da. Protein citrullination is a known biomarker for multiple sclerosis and a potential biomarker for rheumatoid arthritis. Collision-induced dissociation (CID) tandem mass spectrometry of citrullinated peptides produces a dominant neutral loss of isocyanic acid (HNCO, −43 Da) from the deiminated arginine amino acid side-chain. Here we show that the loss of isocyanic acid in CID can be used as a trigger for targeted analysis by supplemental activation electron transfer dissociation (saETD). Unlike CID, post-translational modifications (PTMs) are retained on peptide backbone fragments produced by saETD, improving the confidence in assignment of both peptide sequence and PTM site. The method is demonstrated for four synthetic peptides spiked into complex trypsin-digested saliva samples and a commercial six protein tryptic mixture. In contrast to CID alone, the neutral-loss triggered ETD approach results in high confidence identification of three of the four peptides, including an unexpected disulfide-bound dimer, and zero false positives.
Introduction
Citrullination is a post-translational modification (PTM) of proteins in which an arginine amino acid residue is converted to citrulline via deimination, see Scheme 1. The modification has the same mass increase (+0.9840 Da) as deamidation of asparagine or glutamine residues.1 The citrullination of arginine is caused by a group of calcium dependent enzymes called peptidylarginine deiminases (PADs).2 The conversion of arginine to citrulline decreases the isoelectric point (pI) of the protein and affects its structure and function. Increased levels of citrullinated myelin basic protein have been detected in the brains of patients suffering from multiple sclerosis3,4 and Alzheimer's disease.5 Citrulline-modified proteins vimentin, fibronectin and α-enolase have also been detected as part of the inflammatory-immune response in rheumatoid arthritis (RA).6–8 The modification of these proteins is used as a serum biomarker for RA.6 In addition to those described above, the histones9,10 H3, H2A and H4 and myosin11 have been shown to be citrullinated. The apparent specificity of citrullination increases its potential as a disease biomarker. | ||
| Scheme 1 The conversion of the amino acid residue arginine (left) to citrulline (right). | ||
A significant association has been demonstrated between periodontitis and rheumatoid arthritis in epidemiological research,12 but specific mechanistic links between these two chronic inflammatory diseases have not been fully elucidated.12 One of the principal pathogenic bacteria in periodontitis, Porphyromonas gingivalis,13 is thought to also play a role in RA.14P. gingivalis is the only known periodontal bacterium to contain a PAD enzyme15 and this organism is found in both the gingival crevicular fluid (GCF)16 and saliva17 of patients with periodontitis. Saliva may therefore be a suitable and convenient substrate for the non-invasive diagnosis of RA.
Tandem mass spectrometry-based proteomics methods are routinely used to identify the peptides and proteins present in a biological sample18–20 and to characterise any post-translational modifications.21,22 A standard proteomics approach is to digest a protein mixture with trypsin and use on-line reversed-phase liquid chromatography (LC) to separate the peptides.23,24 The LC is coupled to collision induced dissociation (CID)25 tandem mass spectrometry (MS/MS). CID fragments peptide ions by cleaving the N–C0 bond producing b and y26 fragment ions, thus providing sequence information which can be searched against protein databases. Algorithms are employed to match the measured peptide mass spectrum with those calculated from in silico digests of proteins contained in a database. The peptide assignment is scored according to the similarity between the experimental data and the theoretical mass spectrum. Using this approach, it is possible to identify thousands of peptides (and proteins) from an LC-MS/MS analysis.27 CID fragmentation is a thermal process: one of the drawbacks of CID is the preferential loss of post-translational modifications at the expense of sequence fragments. This occurrence can hinder both peptide identification and localisation of the site of the modification. Electron transfer dissociation (ETD) is a tandem mass spectrometry technique, analogous to electron capture dissociation (ECD),28 developed by Syka et al. in 2004.29 Both ETD and ECD involve radical ion chemistry and result in the cleavage of the N–Cα peptide bond, producing c and z˙ ions. There are significant advantages gained by fragmentation of peptides with ETD or ECD: fragmentation is random and relatively non-selective, the only exception being cleavage N-terminal to proline,30 hence the extent of peptide sequence coverage is often greater than for CID.31,32 Furthermore, in ET/CD, labile post-translational modifications (PTMs) are retained on the peptide backbone fragments. The site of modification can therefore be localised: γ-carboxyglutamic acid,33 phosphorylation (S, T and Y),34–37 N and O glycosylation,38–40 acylation,41 sulfation,33 methionine oxidation,42 sumoylation43 and ubiquitination44 have all been successfully localised. One drawback of ETD is that non-covalent bonds are not necessarily cleaved. Despite N–Cα bond cleavage, the fragments may not separate due to inter-fragment non-covalent interactions. The situation is exacerbated for doubly charged precursor peptide ions: electron transfer reduces the charge by one and there is no Coulombic repulsion to aid separation of the fragments. In order to address that challenge, Swaney et al.45 developed supplemental activation ETD (saETD) in which the charge-reduced ion is collisionally activated, thus disrupting any non-covalent bonding.
Tandem mass spectrometry has previously been applied to the localisation of sites of citrullination on synthetic peptides46,47 and the protein nucleophosmin47 (known to be citrullinated). Hao et al.47 fragmented the synthetic citrullinated peptides (AAXAA,AKXHXKVLXDNIC) and the citrullinated nucleophosmin peptide (SIXDTPAK) using CID (where X is a citrulline residue). Fragmentation produced a dominant peak corresponding to the neutral loss of isocyanic acid (43 Da, HNCO) from the citrulline side-chain, see Scheme 2. In addition, CID of citrullinated peptides produces fragment ion series corresponding to b (−43 Da) and y (−43 Da) ions. Hao et al. used the neutral loss and ion series to distinguish citrullination from deamidation which does not produce a neutral loss. That approach detects the presence of citrullination. To localise the site of citrullination in peptides with more than one arginine (it has been suggested that the presence of citrullination abrogates the site of trypsin cleavage48), a full ion series (all b and y ions of −43 Da) would be required. This process is also reliant on all citrullinated peptides producing the −43 Da ion series. In a separate approach, citrullinated residues were modified using 2,3-butanedione and anti-pyridine,46 a tagging process used to detect citrullination in antibody staining,49 resulting in a mass increase of 239.1 Da. On CID, a dominant peak with an m/z value of 201.1 corresponding to loss of the tag is observed whereas ETD of the modified peptides did not result in any neutral losses. By performing (non-targeted) alternating CID and ETD analyses, peptides with the modification were identified by observation of the neutral loss following CID and the site of citrullination was localised from the ETD mass spectrum. Using this technique citrullination sites were identified on myelin basic protein (MBP). This method is time-consuming in terms of sample preparation. In addition, the requirement for CID and ETD analysis of each peptide increases the duty cycle time thus decreasing the number of MS/MS events and increasing the likelihood of false negatives.
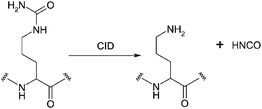 | ||
| Scheme 2 Collision induced dissociation of citrulline. | ||
Previous work in our laboratory has shown that observation of a neutral loss of phosphoric acid (H3PO4, 98 Da) from a phosphopeptide following CID can be used as a trigger for subsequent ECD of the phosphopeptide parent ion.50 Here, we use the neutral loss of isocyanic acid (HNCO, 43 Da) observed in CID of citrullinated peptides to trigger saETD of the parent ion. Citrullinated peptides were synthesised and spiked into tryptic digests of saliva thus simulating the type of media in which citrullinated proteins may be present. The mixture was separated by reversed-phase liquid chromatography coupled to an LTQ Orbitrap Velos ETD mass spectrometer. As the peptides eluted, CID was performed. If a peak corresponding to the loss of isocyanic acid was observed in the CID mass spectrum, saETD of the precursor peptide ion was performed (i.e., this approach does not involve MS3 of the neutral loss ions). The MS/MS data were searched against a protein database using the SEQUEST51 algorithm. The algorithm matches the MS/MS spectrum to a spectrum of a theoretical peptide from the protein database. The results show that the four synthetic citrullinated peptides can be manually identified by both CID and saETD. The filtered database search results of the saETD data identified three of the four peptides with high confidence. However, the database search of the CID data only identified two of the synthetic peptides and falsely identified several non-citrullinated peptides. On manual analysis these incorrect identifications proved to be either deamidated peptides or incorrectly assigned mass spectra (false positives). There were several mechanical false positives, i.e., instances in which CID triggered saETD in the absence of a citrullinated peptide, however, database searching of the saETD data did not identify these as additional citrullinated peptides, i.e., saETD resulted in zero false positives.
Results and discussion
Saliva analysis
Three synthetic peptides (ILNXTSFAK, VVEXHQSACK and LYNLHGDXSYVLSK; X is a citrulline residue) were spiked into a trypsin digest of saliva. The sample was loaded onto a reversed phase C18 column and separated over a 30 minute gradient. The eluting peptides were fragmented by collision induced dissociation (CID). If one of the three most abundant peaks corresponded to the loss of 43 Da from the precursor ion, the precursor ion was subjected to supplemental activation electron transfer dissociation (saETD). The data were analysed using the SEQUEST algorithm and searched against the human IPI database (v3.66) supplemented with the sequences of the synthetic peptides. The results were filtered by XCorr (a measure of how close an experimental MS/MS spectrum is to the theoretical MS/MS spectrum) vs. charge state. XCorr values less than 2, 2.25 and 2.5 were rejected for charge states 2+, 3+ and 4+ respectively. In the analysis of the saliva sample, all three synthetic peptides could be manually identified from the CID and saETD spectra. In the filtered database search two of the three peptides were identified from the saETD spectra, however, none of the peptides were identified by CID. A total of 1344 MS/MS events were triggered during the LC-MS/MS gradient. Of these, 1280 were CID events. The database search of the CID data identified 76 human proteins. saETD was triggered for 64 precursor ions. Thirteen of the saETD events corresponded to the three synthetic peptides in doubly and/or triply charged states. Two of the saETD events corresponded to unexpected disulfide-bound dimers of one of the peptides. The SEQUEST search of the saETD data identified two additional peptides neither of which were citrullinated (KGDTFSCMVGHEALPLAFTQK and LGHPDTLNQGEFK). The remaining 47 saETD spectra did not result in positive peptide identifications following the database search. These saETD events were mechanical false positives; that they were not identified in the database search as citrullinated peptides highlights the robustness of the method.The shortest synthetic peptide (peptide 1: ILNXTSFAK) was observed as a doubly charged ion (m/z 525.802) only. Fig. 1A shows a survey MS spectrum (top), with subsequent CID (middle) and saETD (bottom) mass spectra. The most abundant peak in the CID mass spectrum corresponds to the neutral loss of 43 Da (Δm/z 21.37 for 2+ peptide), i.e., isocyanic acid, HNCO. CID was performed thirteen times on the doubly charged ion of peptide 1. Of these thirteen events, nine triggered saETD. The CID mass spectrum shown gave the highest XCorr but is of poor quality with very few peaks above baseline noise. Nevertheless, the database search and manual analysis of the mass spectrum revealed that all eight N–C0 bonds are cleaved. All eight N–Cα bonds are cleaved by saETD to produce abundant fragments, as confirmed by both the SEQUEST search and manual analysis of the mass spectrum. The SEQUEST XCorr score for both the CID mass spectrum and the saETD mass spectrum was 1.7. The disparity in search scores as related to spectral appearance is in part because the search algorithm is designed for CID data, rather than EC/TD data, and does not take into account some of the differences in the fundamental chemistry of the two techniques.52,53
![Neutral-loss triggered saETD of the four citrullinated peptides. Survey MS scan (top), CID MS/MS scan (middle) and saETD MS/MS scan (bottom) for: doubly charged peptide [ILNXTSFAK + 2H]2+ ions (A); triply charged peptide [VVEXHQSACK + 3H]3+ ions (B); quadruply charged dimer ions of the peptide VVEXHQSACK (C); doubly charged peptide [LYNLHGDXSYVLSK + 2H]2+ ions (D); triply charged peptide [LYNLHGDXSYVLSK + 3H]3+ ions (E); and triply charged peptide [IHAXEEIFDSXGNPTVEVDLFTSK]3+ ions (F). X is citrulline. Inset: sequence coverage obtained. cR is citrulline. The m/z values and ion intensities for the informative fragments are shown in Table S1, ESI.](/image/article/2011/AY/c0ay00414f/c0ay00414f-f1.gif) | ||
| Fig. 1 Neutral-loss triggered saETD of the four citrullinated peptides. Survey MS scan (top), CID MS/MS scan (middle) and saETD MS/MS scan (bottom) for: doubly charged peptide [ILNXTSFAK + 2H]2+ ions (A); triply charged peptide [VVEXHQSACK + 3H]3+ ions (B); quadruply charged dimer ions of the peptide VVEXHQSACK (C); doubly charged peptide [LYNLHGDXSYVLSK + 2H]2+ ions (D); triply charged peptide [LYNLHGDXSYVLSK + 3H]3+ ions (E); and triply charged peptide [IHAXEEIFDSXGNPTVEVDLFTSK]3+ ions (F). X is citrulline. Inset: sequence coverage obtained. cR is citrulline. The m/z values and ion intensities for the informative fragments are shown in Table S1, ESI†. | ||
The second synthetic peptide (peptide 2: VVEXHQSACK) was only observed as a triply charged ion (m/z 386.530). CID was performed once and saETD was triggered. Fig. 1B shows the survey MS spectrum (top), CID mass spectrum (middle) and the saETD mass spectrum (bottom). The peak corresponding to a neutral loss of 43 Da (Δm/z 14.03) was the third most abundant fragment ion in the CID mass spectrum. The CID mass spectrum was not of sufficient quality to identify the peptide via the database search. However, manual analysis revealed that five N–C0 bonds were cleaved. The peptide was identified by the database search of the saETD data with an XCorr of 2.82. Manual analysis of the saETD mass spectrum, and the database search, revealed all nine N–Cα backbone bonds were cleaved.
An unexpected peak corresponding to quadruply charged ions of a disulfide-bound dimer of peptide 2 (m/zcalc 578.786, m/zmeas 578.787, Δ 1.0 ppm) was observed (Fig. 1C). CID was performed once and saETD was triggered. Manual analysis of the CID mass spectrum (Fig. 1C, middle) showed that there were no fragments unique to the monomer or the dimer of the peptide. However, there was a peak corresponding to a neutral loss of 43 Da, i.e. ([2M + 4H]–HNCO)4+, hence the saETD event. Manual inspection of the saETD mass spectrum (Fig. 1C, bottom) showed that seven out of nine N–Cα bonds were cleaved. No fragments were observed which contained the intact disulfide bond. Identification of this unexpected citrullinated species demonstrates the power of the neutral-loss triggered saETD approach. A peak corresponding to the triply charged dimer (m/z 771.382) was also observed. CID was performed and a neutral loss (−Δm/z 14) triggered saETD. On manual inspection of both the CID and saETD spectra, no fragment ions were observed. Dimer ions in the 5+ and 6+ charge states (m/z 463.231, m/z 386.194 respectively) were also observed. CID was only performed on the 5+ charge state, however, as the neutral loss from a 5+ ion (Δm/z 8.6) was not included in the method, saETD was not triggered. Manual analysis of the CID mass spectrum failed to identify any backbone fragments. Peptide 2 had previously been analysed by direct infusion (DI) electrospray and no dimers were observed. That suggests that the dimer bond may be formed during the elution on the HPLC column or could be the result of different solvent conditions (for DI, peptides are resuspended in methanol![[thin space (1/6-em)]](https://www.rsc.org/images/entities/char_2009.gif) :water, 70:30 + 1% formic acid).
:water, 70:30 + 1% formic acid).
Fig. 1D shows neutral loss triggered saETD for the doubly charged ion (m/z 833.434) of the third synthetic peptide (peptide 3: LYNLHGDXSYVLSK) (survey mass spectrum (top), CID mass spectrum (middle), saETD mass spectrum (bottom)). CID was performed once. The most abundant peak in the CID spectrum corresponds to the loss of 43 Da from the precursor ion and hence saETD was triggered. Twelve of the thirteen N–C0 bonds were cleaved by CID as identified by both manual analysis and the SEQUEST search. The CID XCorr score for the peptide was 1.54. All N–Cα bonds were cleaved by saETD as identified by both manual analysis and the SEQUEST search. The XCorr score for the saETD spectrum was 2.8. The triply charged ion for peptide 3 (m/z 555.959) was analysed by CID three times triggering saETD twice. The highest-scoring CID spectrum (Fig. 1E, middle) of this ion shows a neutral loss of 43 (Δm/z 14.14). Manual analysis revealed that nine of the thirteen N–C0 bonds were cleaved, however, the SEQUEST search of these spectra gave an XCorr of 1.1, a value which does not pass the filters. In the saETD mass spectrum all thirteen N–Cα bonds were cleaved (observed in both the SEQUEST search and manual analysis) (Fig. 1E, bottom) and the database search resulted in an XCorr score of 4.56.
The data from the synthetic peptides spiked into a tryptic saliva digest show that in all cases the synthetic peptides are identified from unfiltered database searches of the saETD mass spectra with the same, or greater, XCorr score obtained from searching the CID data. The filtered database search results show CID does not identify any of the peptides whereas saETD identifies two of the three peptides. CID of peptide 2 (VVEXHQSACK) produced a neutral loss (thus triggering saETD) but insufficient backbone fragments for identification in the database search. There were no false negatives in the database search of the saETD spectra (saETD was triggered 64 times). Two of the additional saETD events were matched to real peptides (KGDTFSCMVGHEALPLAFTQK and LGHPDTLNQGEFK), neither of which were citrullinated or deamidated. In both of these cases, the parent ions were triply charged. The saETD was triggered by peaks Δm/z 21.15 less than the precursor (corresponding to the neutral loss from a 2+ citrullinated ion) for peptide KGDTFSCMVGHEALPLAFTQK and Δm/z 11.15 (corresponding to the neutral loss from a 4+ citrullinated ion) for peptide LGHPDTLNQGEFK. The filtered database search of the CID data ‘identified’ ten additional peptides as containing citrullinated arginine residues (false positives). Manual analysis of the mass spectra of those species confirms them as either incorrectly assigned spectra (incorrect sequence, 3) or as having the correct sequence but containing either deamidated asparagine or glutamine residues rather than citrulline (7).
In order to test the suitability of the NL-saETD approach for longer and multiply citrullinated peptides, an additional peptide (IHAXEEIFDSXGNPTVEVDLFTSK; X are citrulline residues) was synthesized. The peptide was spiked into a separate saliva digest, analysed and the data searched against the database as described above. The peptide was observed as triply charged ions and the NL-saETD is shown in Fig. 1F (survey mass spectrum (top), CID mass spectrum (middle), saETD mass spectrum (bottom)). CID was performed twice. On both occasions saETD was triggered. The CID spectrum (Fig. 1F, middle) shows a peak corresponding to a neutral loss of 43 Da (Δm/z 14.07), i.e. loss of HNCO. There are no peaks corresponding to loss of two HNCO molecules. Manual analysis of the CID mass spectrum revealed 19 of the 23 N–C0 bonds were cleaved. Those cleavages were also identified in the SEQUEST search and the XCorr value was 2.63. Manual analysis of the saETD spectrum (Fig. 1F, bottom) showed 22 of the 23 N–Cα bonds were cleaved. (The missed cleavage was N-terminal to proline. Such cleavages are rarely observed following ETD or ECD due to the cyclic nature of the amino acid side-chain.30) The database search of the saETD data resulted in an XCorr of 4.8. Two additional saETD events were matched to non-citrullinated peptides (KAQMQTDDR and KGDTFSCMVGHEALPLAFTQK) in the SEQUEST search. Twelve additional peptides were incorrectly identified as citrullinated in the filtered SEQUEST search of the CID data. Manual inspection revealed that 8 of these were in fact deamidated rather than citrullinated and the remaining four were identified as incorrectly assigned, i.e., incorrect sequence.
Six protein mix analysis
Analysis of the six protein mix containing the three singly citrullinated peptides gave similar results to those obtained for the saliva digest. A trypsin-digested six protein mix was purchased from LC Packings (Sunnyvale, USA). The three synthetic peptides were spiked into the digest. The sample was analysed as above. The concentrations loaded were 50 femtomoles of the six protein digest and 25 femtomoles of the synthetic peptides. Collision induced dissociation was performed 721 times and saETD was triggered 56 times during the LC-MS/MS run. Ten of the saETD mass spectra can be assigned to the synthetic peptides and the unexpected disulfide-bound dimer. Of the additional 46 saETD spectra, two spectra resulted in positive identification in the SEQUEST search (LKECCDKPLLER and YSQQQLMETSHR), neither of which were citrullinated. All three peptides were identified by saETD, i.e., there were no false negatives, however, only one of the peptides was assigned in the filtered database search of the CID data (ILNXTSFAK). saETD resulted in no false positives whereas CID resulted in 3 false positives.Peptide 1 was observed as a doubly charged ion (m/z 525.802). CID was performed 8 times. Four of these CID events triggered saETD. For the CID and saETD spectra, both the SEQUEST search and manual analysis identified cleavage of all eight backbone bonds. The SEQUEST XCorr for the CID spectrum was 2.06 compared to 1.64 for the saETD spectrum. Peptide 2 was observed as a triply charged ion (m/z 386.530). CID was performed twice; saETD was triggered twice. Manual analysis and the SEQUEST search of the saETD mass spectrum showed all N–Cα bonds were cleaved and the database search gave an XCorr score of 2.89. In CID, only five of the nine peptide bonds were cleaved, resulting in an XCorr score of 0.67 which is below the filter cut-off. The quadruply charged disulfide-bonded dimer of peptide 2 was detected and the neutral loss of 43 Da in CID triggered saETD. Manual analysis of the CID spectrum did not identify any unique fragment ions. Peptide 3 was present as doubly (m/z 833.435) and triply charged ions (m/z 555.959); saETD was triggered for both ions (once for the doubly charged ion and twice for the triply charged ion). The saETD mass spectrum of the triply charged ion showed cleavage of twelve of the thirteen N–Cα bonds (identified in both the SEQUEST search and manually) with an XCorr score of 4.57. Manual analysis of the CID mass spectrum showed nine of the thirteen bonds cleaved but did not result in a positive identification in the filtered dataset. Removing the filters showed the XCorr value to be 0.91. The CID spectrum of the doubly charged ion showed ten of the thirteen N–C0 bonds were cleaved (identified in the SEQUEST search and manually) resulting in an XCorr of 1.6, again below the filter threshold. The dominant peak corresponded to the neutral loss of 43 Da. However, the resulting saETD spectrum was of very low quality. There were no fragments identified and therefore no XCorr was reported.
Two saETD events resulted in positive non-citrullinated peptide identifications in the SEQUEST search (LKECCDKPLLER and YSQQQLMETSHR), i.e., although saETD was triggered, the database search did not incorrectly identify the peptides as citrullinated, again demonstrating the robustness of the approach. Three additional peptides were incorrectly identified as citrullinated from the CID data. Manual analysis of these spectra showed that in all cases the peptide was deamidated rather than citrullinated (false positives).
In a separate analysis the fourth citrullinated peptide (IHAXEEIFDSXGNPTVEVDLFTSK) was spiked into the six protein digest mix and analysed as described above. As previously, peptide 4 was detected as triply charged ions (m/z 921.461). CID was performed three times. On each occasion saETD was triggered. The CID mass spectrum revealed cleavage of 19 of the 23 N–C0 bonds (identified both manually and in the SEQUEST search). The saETD mass spectrum also showed 19 of the 23 N–Cα bonds were cleaved. The XCorr scores for CID and saETD were 4.87 and 4.91 respectively. As above, two additional saETD spectra were identified in the SEQUEST search as non-citrullinated peptides (LKECCDKPLLER and NYELLCGDNTRK). Two additional peptides were incorrectly identified as citrullinated in the SEQUEST search of the CID data. Manual analysis showed that both were in fact deamidated peptides.
Table 1 summarises the XCorr scores for the MS/MS events from which the four synthetic peptides were identified in both the saliva and six protein digests. The table shows that in all cases, saETD of triply charged peptide ion results in a higher score than CID. This is to be expected: Swaney et al.54 have shown that the database search scores of saETD mass spectra of triply charged ions up to m/z ≈ 700 are higher than the scores from corresponding CID mass spectra. saETD of the doubly charged peptides identified in the saliva digest gave equal or higher Xcorr scores than the corresponding CID data. saETD of the doubly charged ions in the six protein digestion results gave lower scores than the CID data.
| XCorr score | ||
|---|---|---|
| CID | saETD | |
| Peptides spiked into saliva | ||
| [ILNXTSFAK]2+ | (1.7) | (1.7) |
| [VVEXHQSACK]3+ | — | 2.82 |
| [LYNLHGDXSYVLSK]2+ | (1.54) | 2.8 |
| [LYNLHGDXSYVLSK]3+ | (1.1) | 4.56 |
| [IHAXEEIFDSXGNPTVEVDLFTSK]3+ | 2.63 | 4.8 |
| Peptides spiked into six protein mix | ||
| [ILNXTSFAK]2+ | 2.06 | (1.64) |
| [VVEXHQSACK]3+ | (0.67) | 2.89 |
| [LYNLHGDXSYVLSK]2+ | (1.6) | — |
| [LYNLHGDXSYVLSK]3+ | (0.91) | 4.57 |
| [IHAXEEIFDSXGNPTVEVDLFTSK]3+ | 4.87 | 4.91 |
Table 2 summarises the total number of CID and saETD events which were performed for the four experiments. The saliva digests were more complex mixtures and therefore more MS/MS events would be expected when compared to the six protein mix. In the first saliva analysis, the total number of events resulting in positive identifications of the synthetic citrullinated peptides from the filtered SEQUEST search was zero and eight for CID and saETD respectively. In the second saliva analysis, the fourth citrullinated peptide was identified twice by both CID and saETD. For the six protein mix spiked with peptides 1–3, one CID and four saETD events resulted in positive identification of the citrullinated peptides and for the six protein mix spiked with peptide 4, three CID and three saETD events resulted in positive identification. Ten CID events resulted in erroneous identification of citrullinated peptides in the saliva analysis spiked with peptides 1–3 and twelve CID events in the saliva analysis spiked with peptide 4, giving false positive rates of 0.8% and 1.1% respectively. Three CID events in the six protein analysis spiked with peptides 1–3 and two CID events in the analysis spiked with peptide 4 resulted in incorrect identifications of citrullinated peptides. The false positive rates for the six protein mix analyses were 0.4% and 0.2%. The SEQUEST search of the saliva digest spiked with peptides 1–3 shows that none of the CID spectra for the synthetic peptides were of sufficient quality to identify the peptides in a filtered database search. Twenty out of the 27 incorrectly assigned peptides were deamidated. There were no false positives identified from the saETD data from either the saliva or six protein mix experiments.
| MS/MS events | # Events resulting in positive ID of synthetic peptides | # Events resulting in ID of additional citrullinated peptides (false positives) | False positive rate (%) | |
|---|---|---|---|---|
| Saliva spiked with synthetic peptides 1–3 | ||||
| CID | 1280 | 0 | 10 | 0.8 |
| saETD | 64 | 8 | 0 | 0 |
| Saliva spiked with synthetic peptide 4 | ||||
| CID | 1651 | 2 | 12 | 1.1 |
| saETD | 66 | 2 | 0 | 0 |
| MS/MS events | # Events resulting in positive ID of synthetic peptides | # Events resulting in ID of additional citrullinated peptides (false positives) | False positive rate (%) | |
|---|---|---|---|---|
| Six protein mix spiked with synthetic peptides 1–3 | ||||
| CID | 721 | 1 | 3 | 0.4 |
| saETD | 56 | 4 | 0 | 0 |
| Six protein mix spiked with synthetic peptide 4 | ||||
| CID | 1047 | 3 | 2 | 0.2 |
| saETD | 93 | 3 | 0 | 0 |
Experimental
Materials
The six protein tryptic mix was purchased from LC Packings (Sunnyvale, USA) and used without further purification. Four citrullinated peptides were synthesised by Alta Biosciences (Birmingham, UK). Saliva was collected for three minutes into a 15 mL Falcon tube from BD Biosciences (CA, USA). Dithiothreitol, iodoacetamide and formic acid were purchased from Fisher Scientific (UK). Trypsin gold was purchased from Promega (USA). HPLC grade water and acetonitrile were purchased from Baker (Holland).Sample preparation
000 rpm for 10 minutes. The supernatant was retained. Any disulfide bonds in the saliva sample (100 µL) were reduced with dithiothreitol and alkylated by use of iodoacetamide. The sample was digested with trypsin at 37 °C overnight. The digested sample was desalted with a Michrom macro trap (CA, USA). The trap was wetted using acetonitrile:water (50:50, 300 µL) (Baker, Holland) and washed with trifluoroacetic acid (0.1%, 200 µL) (Fisher, UK). The sample was loaded onto the trap and washed with trifluoroacetic acid (0.1%, 200 µL) and eluted in acetonitrile:water (70:30, 200 µL). The sample was vacuum centrifuged dry and resuspended in formic acid (100 µL, 0.1%). The samples were further diluted (25 times dilution giving approximately 40 ng µL−1 of proteins) prior to analysis. The three synthetic singly citrullinated peptides were spiked into the sample to give a final concentration of 5 fmol µL−1. 5 µL of sample was loaded into the HPLC system (200 ng of protein digest and 25 femtomoles of each synthetic peptide). The doubly citrullinated peptide was spiked into a separate saliva sample to give a final concentration of 20 fmol µL−1. 5 µL of sample was loaded into the HPLC system (200 ng of protein digest and 100 femtomoles of the synthetic peptide).
Instruments and experimental conditions
The mass spectrometer alternated between a full FT-MS scan (m/z 380–1600) and subsequent MS/MS scan(s) of the most abundant precursor ions. Survey scans were acquired in the Orbitrap with a resolution of 60000 at m/z 400. Precursor ions were isolated and subjected to CID in the linear ion trap. Isolation width was 2 Th. Automatic gain control (AGC) was used to accumulate sufficient precursor ions (target value 1 × 10⁵ charges, maximum fill time 25 ms). CID was performed with helium gas at a normalised collision energy of 35%. Parent ions were activated for 10 ms. Dynamic exclusion was used (60 seconds exclusion window).
If one of the three most abundant fragment ions in the CID mass spectrum corresponded to a neutral loss of 43 Da (±m/z 0.5) from the precursor peptide, saETD of the precursor ion was triggered. saETD was performed in the ion trap and detected in the Orbitrap with a resolution of 7500 at m/z 400. Precursor ions were isolated in the ion trap with an isolation width of 3 Th. AGC target value was 2 × 10⁵ charges, maximum fill time 1000 ms with 2 microscans co-added per mass spectrum. saETD was performed for 130 ms with a normalised supplemental activation energy of 25%.
Data analysis
Data were analysed by use of the Xcalibur 2.1 software. Data from the samples containing the singly citrullinated peptides were searched against the IPI human database (v 3.66, containing 86850 sequences) supplemented with the sequences of the three synthetic peptides added using the SEQUEST51 algorithm within the Proteome Discoverer 1.0 SP1 software package (Thermo Scientific, Bremen, Germany). Mono-isotopic precursor and fragment ions were searched with a mass tolerance of 5 ppm (precursor) and 0.1 Da (fragment) for CID and 0.02 Da for saETD. Proteome Discoverer separated the CID and ETD data prior to searches. For CID data, b and y ions were considered. For saETD data, c and z˙ ions were considered. The carboxyamidomethylation of cysteine was specified as a fixed modification in the saliva search. Carboxymethylation of cysteine was specified in the six protein mix search. Phosphorylation (serine, threonine and tyrosine), oxidation (methionine), acetylation (lysine), deamidation (asparagine and glutamine) and citrullination (arginine) were set as variable modifications in both searches. In both searches the maximum number of missed cleavages was 2.
Analysis of the data from the samples containing the doubly citrullinated peptide was performed using the SEQUEST algorithm within the Proteome Discoverer 1.1 software package. The data were searched against the IPI human database (v 3.66, containing 86850 sequences) supplemented with the sequences of the four synthetic peptides. Search parameters were as above.
The results were filtered using XCorr versus charge state (2+ ions with a score less than 2 were rejected, 3+ ions with scores <2.25 were rejected and 4+ ions with scores <2.5 were rejected). XCorr is a measure of how close an experimental MS/MS spectrum is to the theoretical MS/MS spectrum. Higher scores equate to greater confidence in a peptide match. XCorr values were calculated by Proteome Discoverer.
Conclusions
Citrullination could be used as a sensitive and specific early biomarker for several debilitating chronic inflammatory diseases. We have shown that by exploiting the characteristic CID fragmentation of citrulline residues, i.e., loss of isocyanic acid, to trigger saETD it is possible to perform targeted analysis of citrullinated peptides. The approach results in zero false positives, and the ambiguity of citrullination vs. deamidation is overcome. Additionally, the approach removes the requirement to chemically modify the samples. Three of the four synthetic citrullinated peptides were identified with high confidence by saETD. For triply charged ions, saETD identifies the peptides with greater XCorr scores than the CID of the triply charged ions. In the six protein mix analysis for the doubly charged ions of the synthetic peptides, the XCorr values for the CID spectra are higher than those for the saETD spectra. For the saliva analysis, the saETD XCorr values of the doubly charged synthetic peptide ions are equal to or higher than the CID spectra. The CID mass spectrum of the peptide (VVEXHQSACK) did not result in a positive identification in the database search for either analysis. This study shows that, although CID identifies two of the four peptides, there are multiple false positives identified from CID spectra, the majority of which are the result of deamidation rather than deimination. This has implications for the use of CID as a stand-alone technique for automated analysis of citrullinated proteins as all identified modified peptides would require manual validation. This work shows that a targeted approach which exploits the speed and characteristic fragmentation of citrullinated peptides in CID in order to focus their analysis by ETD results in highly confident assignments, zero false positives and zero false negatives.Acknowledgements
The Thermo Scientific LTQ Orbitrap Velos ETD used in this research was obtained through the Birmingham Science City Translational Medicine: Experimental Medicine Network of Excellence project, with support from Advantage West Midlands (AWM). HJC gratefully acknowledges the Wellcome Trust (074131) for funding. AJC is supported by a grant from Philips Oral Healthcare.References
- R. Bischoff and H. V. J. Kolbe, J. Chromatogr., B: Biomed. Appl., 1994, 662, 261–278 CrossRef CAS.
- E. R. Vossenaar, A. J. W. Zendman, W. J. van Venrooij and G. J. M. Pruijn, BioEssays, 2003, 25, 1106–1118 CrossRef CAS.
- A. P. Nicholas, T. Sambandam, J. D. Echols and W. W. Tourtellotte, J. Comp. Neurol., 2004, 473, 128–136 CrossRef CAS.
- J. de Seze, S. Dubucquoi, D. Lefranc, F. Virecoulona, I. Nueza, V. Dutoita, P. Vermerschb and L. Prina, J. Neuroimmunol., 2001, 117, 149–155 CrossRef CAS.
- A. Ishigami, T. Ohsawa, M. Hiratsuka, H. Taguchi, S. Kobayashi, Y. Saito, S. Murayama, H. Asaga, T. Toda, N. Kimura and N. Maruyama, J. Neurosci. Res., 2005, 80, 120–128 CrossRef CAS.
- A. Union, L. Meheus, R. L. Humbel, K. Conrad, G. Steiner, H. Moereels, H. Pottel, G. Serre and F. De Keyser, Arthritis Rheum., 2002, 46, 1185–1195 CrossRef CAS.
- A. Kinloch, K. Lundberg, R. Wait, N. Wegner, N. H. Lim, T. Saxne, V. Malmstrom and P. J. Venables, Rheumatology, 2008, 47, Ii57–Ii57.
- T. Cantaert, L. De Rycke, T. Bongartz, E. L. Matteson, P. P. Tak, A. P. Nicholas and D. Baeten, Arthritis Rheum., 2006, 54, 3381–3389 CrossRef CAS.
- F. G. Mastronardi, D. D. Wood, J. Mei, R. Raijmakers, V. Tseveleki, H. M. Dosch, L. Probert, P. Casaccia-Bonnefil and M. A. Moscarello, J. Neurosci., 2006, 26, 11387–11396 CrossRef CAS.
- T. Hagiwara, Y. Hidaka and M. Yamada, Biochemistry, 2005, 44, 5827–5834 CrossRef CAS.
- M. Shrivastav, B. Mittal, A. Aggarwal and R. Misra, Clin. Rheumatol., 2002, 21, 505–510 CrossRef CAS.
- P. de Pablo, I. L. C. Chapple, C. D. Buckley and T. Dietrich, Nat. Rev. Rheumatol., 2009, 5, 218–224 Search PubMed.
- A. D. Haffajee and S. S. Socransky, Periodontology 2000, 1994, 5, 78–111 CrossRef CAS.
- A. L. Griffen, M. R. Becker, S. R. Lyons, M. L. Moeschberger and E. J. Leys, J. Clin. Microbiol., 1998, 36, 3239–3242 CAS.
- E. D. Rosenstein, G. Weissmann and R. A. Greenwald, Med. Hypotheses, 2009, 73, 457–458 CrossRef.
- V. Johnson, B. D. Johnson, T. J. Sims, C. W. Whitney, B. J. Moncla, L. D. Engel and R. C. Page, J. Periodontol., 1993, 64, 559–565 CAS.
- J. Matto, M. Saarela, S. Alaluusua, V. Oja, H. Jousimies-Somer and S. Asikainen, J. Clin. Microbiol., 1998, 36, 157–160 CAS.
- J. J. Coon, J. E. P. Syka, J. Shabanowitz and D. F. Hunt, BioTechniques, 2005, 38, 519–523 CrossRef CAS.
- R. Aebersold and M. Mann, Nature, 2003, 422, 198–207 CrossRef CAS.
- J. M. Wells and S. A. McLuckey, Biol. Mass Spectrom., 2005, 402, 148–185 CAS.
- S. M. M. Sweet, C. M. Bailey, D. L. Cunningham, J. K. Heath and H. J. Cooper, Mol. Cell. Proteomics, 2009, 8, 904–912 CrossRef CAS.
- M. Mann and O. N. Jensen, Nat. Biotechnol., 2003, 21, 255–261 CrossRef CAS.
- E. C. Huang and J. D. Henion, J. Am. Soc. Mass Spectrom., 1990, 1, 158–165 CrossRef CAS.
- G. D. Chen and B. N. Pramanik, Drug Discovery Today, 2009, 14, 465–471 CrossRef CAS.
- K. R. Jennings, Int. J. Mass Spectrom. Ion Phys., 1968, 1, 227–235 CrossRef CAS.
- P. Roepstorff and J. Fohlman, Biomed. Mass Spectrom., 1984, 11, 601–601 CAS.
- M. P. Washburn, D. Wolters and J. R. Yates, Nat. Biotechnol., 2001, 19, 242–247 CrossRef CAS.
- R. A. Zubarev, N. L. Kelleher and F. W. McLafferty, J. Am. Chem. Soc., 1998, 120, 3265–3266 CrossRef CAS.
- J. E. P. Syka, J. J. Coon, M. J. Schroeder, J. Shabanowitz and D. F. Hunt, Proc. Natl. Acad. Sci. U. S. A., 2004, 101, 9528–9533 CrossRef CAS.
- H. J. Cooper, R. R. Hudgins, K. Hakansson and A. G. Marshall, Int. J. Mass Spectrom., 2003, 228, 723–728 Search PubMed.
- R. A. Zubarev, D. M. Horn, E. K. Fridriksson, N. L. Kelleher, N. A. Kruger, M. A. Lewis, B. K. Carpenter and F. W. McLafferty, Anal. Chem., 2000, 72, 563–573 CrossRef CAS.
- A. J. Creese and H. J. Cooper, J. Am. Soc. Mass Spectrom., 2007, 18, 891–897 CrossRef CAS.
- N. L. Kelleher, R. A. Zubarev, K. Bush, B. Furie, B. C. Furie, F. W. McLafferty and C. T. Walsh, Anal. Chem., 1999, 71, 4250–4253 CrossRef CAS.
- A. Stensballe, O. N. Jensen, J. V. Olsen, K. F. Haselmann and R. A. Zubarev, Rapid Commun. Mass Spectrom., 2000, 14, 1793–1800 CrossRef CAS.
- S. D. H. Shi, M. E. Hemling, S. A. Carr, D. M. Horn, I. Lindh and F. W. McLafferty, Anal. Chem., 2001, 73, 19–22 CrossRef CAS.
- A. Chi, C. Huttenhower, L. Y. Geer, J. J. Coon, J. E. P. Syka, D. L. Bai, J. Shabanowitz, D. J. Burke, O. G. Troyanskaya and D. F. Hunt, Proc. Natl. Acad. Sci. U. S. A., 2007, 104, 2193–2198 CrossRef CAS.
- H. Molina, D. M. Horn, N. Tang, S. Mathivanan and A. Pandey, Proc. Natl. Acad. Sci. U. S. A., 2007, 104, 2199–2204 CrossRef CAS.
- K. Hakansson, H. J. Cooper, M. R. Emmett, C. E. Costello, A. G. Marshall and C. L. Nilsson, Anal. Chem., 2001, 73, 4530–4536 CrossRef.
- E. Mirgorodskaya, P. Roepstorff and R. A. Zubarev, Anal. Chem., 1999, 71, 4431–4436 CrossRef CAS.
- I. Perdivara, R. Petrovich, B. Allinquant, L. J. Deterding, K. B. Tomer and M. Przybylski, J. Proteome Res., 2009, 8, 3786–3786 CrossRef CAS.
- Z. Q. Guan, J. Am. Soc. Mass Spectrom., 2002, 13, 1443–1447 CrossRef CAS.
- Z. Q. Guan, N. A. Yates and R. Bakhtiar, J. Am. Soc. Mass Spectrom., 2003, 14, 605–613 CrossRef CAS.
- H. J. Cooper, M. H. Tatham, E. Jaffray, J. K. Heath, T. T. Lam, A. G. Marshall and R. T. Hay, Anal. Chem., 2005, 77, 6310–6319 CrossRef CAS.
- H. J. Cooper, J. K. Heath, E. Jaffray, R. T. Hay, T. T. Lam and A. G. Marshall, Anal. Chem., 2004, 76, 6982–6988 CrossRef CAS.
- D. L. Swaney, G. C. McAlister, M. Wirtala, J. C. Schwartz, J. E. P. Syka and J. J. Coon, Anal. Chem., 2007, 79, 477–485 CrossRef CAS.
- M. Stensland, A. Holm, A. Kiehne and B. Fleckenstein, Rapid Commun. Mass Spectrom., 2009, 23, 2754–2762 CrossRef CAS.
- G. Hao, D. C. Wang, J. Gu, Q. Y. Shen, S. S. Gross and Y. M. Wang, J. Am. Soc. Mass Spectrom., 2009, 20, 723–727 CrossRef CAS.
- V. Goeb, M. Thomas-L'Otellier, R. Daveau, R. Charlionet, P. Fardellone, X. Le Loet, F. Tron, D. Gilbert and O. Vittecoq, Arthritis Res. Ther., 2009, 11, R38 CrossRef.
- M. Knipp and M. Vasak, Anal. Biochem., 2000, 286, 257–264 CrossRef CAS.
- S. M. M. Sweet, A. J. Creese and H. J. Cooper, Anal. Chem., 2006, 78, 7563–7569 CrossRef CAS.
- J. K. Eng, A. L. Mccormack and J. R. Yates, J. Am. Soc. Mass Spectrom., 1994, 5, 976–989 CrossRef.
- S. M. M. Sweet, A. W. Jones, D. L. Cunningham, J. K. Heath, A. J. Creese and H. J. Cooper, J. Proteome Res., 2009, 8, 5475–5484 CrossRef CAS.
- D. M. Good, C. D. Wenger, G. C. McAlister, D. L. Bai, D. F. Hunt and J. J. Coon, J. Am. Soc. Mass Spectrom., 2009, 20, 1435–1440 CrossRef CAS.
- D. L. Swaney, G. C. McAlister and J. J. Coon, Nat. Methods, 2008, 5, 959–964 CrossRef CAS.
Footnote |
| † Electronic supplementary information (ESI) available: The m/z values and ion intensities for all informative fragments from MS/MS spectra in figure 1 are shown in table S1. See DOI: 10.1039/c0ay00414f |
| This journal is © The Royal Society of Chemistry 2011 |