
 Open Access Article
 This Open Access Article is licensed under a
 Creative Commons Attribution 3.0 Unported Licence
The true atomistic structure of a disordered crystal: a computational study on the photon upconverting material β-NaYF4 and its Er3+-, Tm3+-, and Yb3+-doped derivates†
Chris Steve
Conrad
 ab,
Holger
Euchner
a,
Eva
Hemmer
*b and
Reinhold F.
Fink
*a
ab,
Holger
Euchner
a,
Eva
Hemmer
*b and
Reinhold F.
Fink
*a
aInstitute of Physical and Theoretical Chemistry, University of Tübingen, Tübingen (Baden-Württemberg), Germany. E-mail: Reinhold.fink@uni-tuebingen.de
bDepartment of Chemistry and Biomolecular Sciences, University of Ottawa, Ottawa, Ontario, Canada. E-mail: ehemmer@uottawa.ca
First published on 17th February 2025
Abstract
Hexagonal (β-) NaYF4 and LiYF4 doped with trivalent lanthanide ions (Ln3+, e.g., Er3+, Tm3+, and Yb3+) are well-known photon upconverting materials. This property is crucially determined by the precise location of the Ln3+ dopant ions and their closest neighbouring ions in the host material. However, due to the inherent disorder of the crystal structures the atomistic structure of a disordered crystal such as β-NaYF4 is not unambiguously provided by X-ray diffraction techniques. Here, theoretical estimates for the true structure of the material are obtained via periodic density functional theory (DFT) calculations of large supercells. Our results reveal that Ln3+ doping of β-NaYF4 occurs in a variety of low-symmetry sites, which are significantly altered by the occupational disorder of the crystal structure. Mainly, the distribution of Na+ and Y3+ around a doping site significantly influences the positions of the F− closest to the dopant. The results of this study are substantiated by applying the same method on the well-ordered host crystal LiYF4 and by comparison with available experimental and theoretical data. Similar results are expected for other disordered crystalline host materials such as β-NaGdF4 or cubic (α-) NaYF4. The obtained structural information is a prerequisite for future accurate simulations and prediction of key parameters for the upconversion process in bulk materials and nanoparticles.
Introduction
Photon upconversion is a process during which the energy of two or more photons of lower energy (typically in the near-infrared, NIR) is captured in a sequential manner to trigger the emission of one single photon of higher energy (in the ultraviolet, visible, or shorter-wavelength NIR regions). The process was first observed in bulk materials but later also transferred to nanomaterials.1–3 Nanoscale upconverting materials, so-called upconverting nanoparticles (UCNPs), offer a wide range of potential applications for which the small size is a prerequisite.4,5 Generally, these applications can be divided into two categories. For applications such as bioimaging, sensing, and anti-counterfeiting, bright emission of upconverted light is key.6–10 Conversely, applications such as photo-induced drug delivery, photodynamic and photothermal therapies, plant cultivation, and enhancing photovoltaics require not only bright emission but rely on high efficiency of the upconversion process as the emitted photons are used in subsequent photochemical or -thermal reactions.11–18 For the latter, a high percentage of upconverted photons per absorbed low-energy photons, i.e., high photoluminescence quantum yield, and a large amount of absorbed photons is highly desirable. While synthetic strategies have evolved over the past years, e.g., dopant optimisation, host choice, core/shell architecture, in addition to computational approaches,19–22 the relatively low quantum yield of UCNPs – maximum values of 13% have been reported to date23 – remains one of the main challenges to bring these applications from proof of concept to real life. To advance computational models tackling these challenges, we here conduct an in-depth geometry optimisation study for different host matrices and their upconversion-inducing lanthanide dopants. It is expected that the reported results provide insights beneficial for the design of more efficient, next generation upconverting (nano)materials.For the design of a meaningful geometry optimisation study, the accurate understanding of the upconversion process at an atomic level is helpful. The 4f−4f transitions of the trivalent lanthanide ions (Ln3+) in centrosymmetric environments are forbidden by Laporte's selection rule and therefore extremely weak. In non-centrosymmetric environments, this rule can be mitigated, and larger but still low transition rates are thus observed.24,25 Moreover, the Ln3+ excited states have relatively long lifetimes, typically in the order of micro- or even milliseconds.26 The transition probabilities of the lanthanides are therefore at a sweet spot that creates favourable conditions for an already excited Ln3+ ion to receive additional energy via photon absorption or energy transfer from neighbouring ions (before relaxation to the ground state can take place). The Ln3+ thereby reaches an even higher excited state and its radiative deexcitation to the ground state gives rise to upconverted photons.
Crystals of the type MXF4 (M = alkali metal, X = lanthanides and yttrium) offer the required non-centrosymmetric doping sites and are therefore among the most commonly chosen host matrices for upconversion.27–30 In addition, MXF4 stands out due to the ease of substitution of a host ion (e.g., Y3+) by an emissive Ln3+ ion (e.g., Er3+, Tm3+, or Yb3+) given the comparable ionic radii as well as identical cation charge.31 Furthermore, established synthetic access to nanomaterials of controlled size and (core/shell) architecture are available for these compounds.29,32,33 Moreover, the prominence of specifically fluoride matrices is due to their comparatively high stability and the relatively low phonon energies reducing the probability for (non-radiative) quenching processes to take place.34,35 Er3+ or Tm3+ are among the most widely studied dopants in these hosts, providing ladder-like energy levels for the upconversion process, while Yb3+ is commonly co-doped for its higher absorption cross section at 980 nm.36–38
Disordered host materials such as NaYF4, which can crystallise in a cubic (α) or in a hexagonal (β) phase, have the added benefit of providing a variety of similar but not completely identical doping sites, which is advantageous for the upconversion process.35,39,40 This study focuses on the observed structural disorder in the β-NaYF4 crystal lattice, which is known to influence properties such as the exact energy level positions of dopants.41 These on the other hand determine the energy difference to be overcome in energy transfer processes, as well as corresponding oscillator strengths and energy transfer rates.35,40,42 The disorder of β-NaYF4 and related compounds has long been established and discussed by experimentalists.27,43–46 However, direct observation on an atomic level is difficult using methods such as X-ray diffraction alone, as this technique provides only averaged information over an ensemble of disordered sites in the crystal.27,40,42,47
Computational methods have been used in the past to explore the above-mentioned and other properties of β-NaYF4, however, the employed models often lack consideration of lattice disorder.48–52 If disorder has been considered, such as in the works by Platonenko et al. or Szefczyk et al.,28,53 it was on the basis of discussing the possible unit cells of β-NaYF4 and how disorder might combine the competing space group designations of β-NaYF4. Huang et al. were the first ones to create a model of two supercells with different configurations but significantly altered the positions of Na+ ions in the process by moving them to higher-symmetry lattice points.54 Indeed, to the best of our knowledge, simulating more than two configurations of the created supercell for a given space group has so far not been reported for undoped β-NaYF4. The knowledge gained from our study using several configurations of a large supercell has the potential to support the rational design of novel highly efficient upconverting materials, thereby aiding to solve the quest of increasing the upconversion yield and enlarging the scope of applications for these materials.
While our results confirm earlier assessments of the 1f Na+–Y3+ disorder in β-NaYF4 by Aebischer et al.,27 more interestingly, our findings unveil the likely presence of additional configurations within the lattice at an atomistic level. Moreover, the influence of the 2h Na+ disorder on the Ln3+ doping sites is reported for the first time on a purely ab initio computational level. Further insight is also given toward the slight disorder that is induced by low-percentage doping. The obtained results are validated by comparing the model to literature-reported experimental and theoretical data of LiYF4, exhibiting a highly regular crystal structure, as well as published experimental data of disordered β-NaYF4.
Structural setup
The process of determining the required size of the supercell for the calculation and the necessary number of configurations for each supercell is described in the following. Results obtained after optimising the individual structures are reported in Results and discussion.Disordered β-NaYF4
![[6 with combining macron]](https://www.rsc.org/images/entities/char_0036_0304.gif) , in which the Y-occuppied 1a sites are commonly placed at the edges of the lattice,43 as reported in several other theoretical studies of this crystal.28,48–50,52–54 This allows for a straightforward comparison of the obtained results to these studies. However, it should be noted that there also exist studies assigning space group P63/m to β-NaYF4.51,55 In this case, Na+ is placed at the edges of the lattice in the corresponding unit cell. A highly recommended, in-depth explanation and critical discussion of all possible space groups for β-NaYF4 can be found in the review paper by Shi et al.40 The unit cell of β-NaYF4 in space group P features three different cationic and two different anionic sites (Fig. 1A). The two anionic sites (Wyckoff positions 3j and 3k) are fully occupied by F−, leaving no possibility for disorder. Among the cationic sites, one site exclusively accommodates Y3+ (Wyckoff position 1a). This site is nine-fold coordinated by three F− at 3j sites and six F− at 3k sites. These nine F− form a tricapped trigonal prism with C3h symmetry (Fig. 1B), in which the 3j F− are located at the tips and the 3k F− at the two caps of the prism. No disorder is possible at the 1a site. In contrast, finding Y3+ or Na+ is equally likely (50% each) at the second cationic site (Wyckoff position 1f). Similar to the 1a site, this site is also coordinated by nine F− with C3h symmetry. The Wyckoff positions of the F− that form the prism are swapped compared to the ones for the 1a site. When Ln3+ doping is considered, the Ln3+ ions randomly replace the Y3+ ions. Hence, the probability of finding an Ln3+ ion at a 1a site is twice as high (2/3) as the probability of finding the Ln3+ ion at a 1f site (1/3). Finally, the third cationic site is occupied by a single Na+, split along the c-axis into two possible, equally likely sites (Wyckoff position 2h). In each unit cell only one of these two sites is occupied at a time. Both 2h positions are surrounded by six F− with irregular octahedral symmetry.
, in which the Y-occuppied 1a sites are commonly placed at the edges of the lattice,43 as reported in several other theoretical studies of this crystal.28,48–50,52–54 This allows for a straightforward comparison of the obtained results to these studies. However, it should be noted that there also exist studies assigning space group P63/m to β-NaYF4.51,55 In this case, Na+ is placed at the edges of the lattice in the corresponding unit cell. A highly recommended, in-depth explanation and critical discussion of all possible space groups for β-NaYF4 can be found in the review paper by Shi et al.40 The unit cell of β-NaYF4 in space group P features three different cationic and two different anionic sites (Fig. 1A). The two anionic sites (Wyckoff positions 3j and 3k) are fully occupied by F−, leaving no possibility for disorder. Among the cationic sites, one site exclusively accommodates Y3+ (Wyckoff position 1a). This site is nine-fold coordinated by three F− at 3j sites and six F− at 3k sites. These nine F− form a tricapped trigonal prism with C3h symmetry (Fig. 1B), in which the 3j F− are located at the tips and the 3k F− at the two caps of the prism. No disorder is possible at the 1a site. In contrast, finding Y3+ or Na+ is equally likely (50% each) at the second cationic site (Wyckoff position 1f). Similar to the 1a site, this site is also coordinated by nine F− with C3h symmetry. The Wyckoff positions of the F− that form the prism are swapped compared to the ones for the 1a site. When Ln3+ doping is considered, the Ln3+ ions randomly replace the Y3+ ions. Hence, the probability of finding an Ln3+ ion at a 1a site is twice as high (2/3) as the probability of finding the Ln3+ ion at a 1f site (1/3). Finally, the third cationic site is occupied by a single Na+, split along the c-axis into two possible, equally likely sites (Wyckoff position 2h). In each unit cell only one of these two sites is occupied at a time. Both 2h positions are surrounded by six F− with irregular octahedral symmetry.
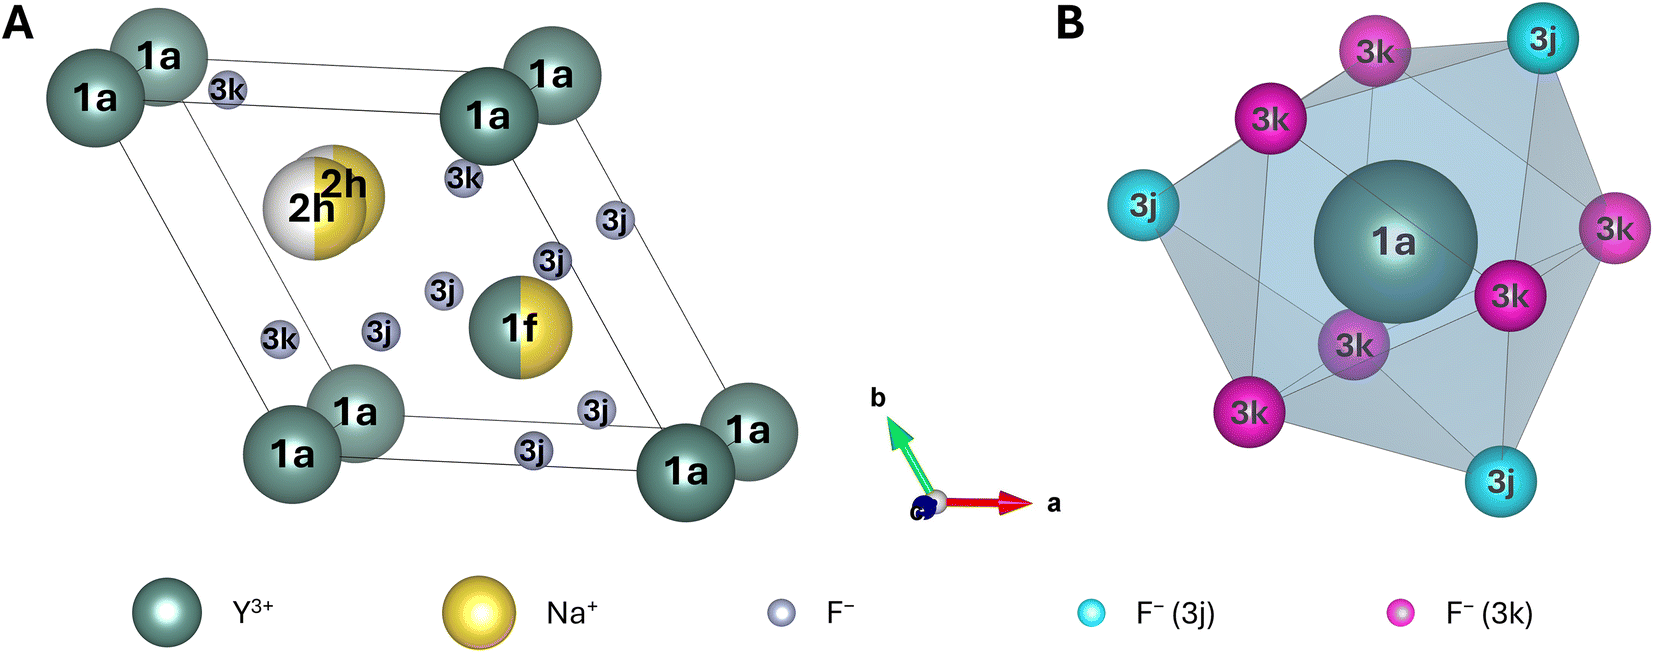 | ||
| Fig. 1 (A) Unit cell of β-NaYF4 with the composition Na1.5Y1.5F6. Dark green spheres represent Y3+, yellow spheres Na+, white spheres are unoccupied sites, and small grey spheres represent F−. Half spheres indicate a 50% occupation. (B) Both possible doping sites for Ln3+ (i.e., 1a and 1f) are coordinated in a tricapped trigonal prismatic geometry by nine F−. For clarity, the three 3j (caps) and the six 3k (trigonal prism) F− are coloured in cyan and in pink, respectively. The prism for the 1f site is generated by rotating the coordination polyhedron shown in (B) by ca. 90° around the c-axis and swapping of the Wyckoff symbols for all F−. | ||
The disorder at the 1f and the 2h site leads to more than one possible configuration for the unit cell, as will be explained further in the next subsection. Depending on the type of disorder (1f-, 2h-, or doping-originated), the positions of the F−, forming the coordination polyhedral around the 1a and 1f sites, will be altered to a different extent. This in turn will reduce the symmetry elements available for the central site and therefore lower its point group. In most cases, even without doping, this changes the symmetry of most 1a and 1f sites from C3h to C1,27 which significantly alters the properties of the potential Ln3+ dopants positioned at these 1a and 1f sites.
The available experimental evidence suggests that the occupation of the 1f site regularly alternates between Na+ and Y3+ along all three spatial directions.27 However, NaYF4 and related materials are often synthesised at elevated temperatures, followed by thermal quenching, enabling energetically less favourable structural arrangements.44,46 A regular alternation of Na+ and Y3+ might therefore only be true as an averaged occupation over a large sample of unit cells. Indeed, if this regular alternation was the case, a larger unit cell with well-defined atomic positions at the 1f site could be generated. So far such a large unit cell has only been observed for β-NaPrF4.45,56 Local deviations at the 1f sites from the regularly alternating pattern on an atomic level and a less structured crystal with a higher degree of disorder therefore seem likely. Also, for the disorder at 2h sites only few theoretical studies have been conducted to date,28,53,54 which leaves space for further investigation of the true atomistic structure of this disordered crystal.
To address these features of the β-NaYF4 crystal, we developed a model that can represent disorder by creating several different configurations of the crystal structure. The required disorder was achieved by employing a large supercell, followed by alteration of the composition of the 1f and 2h sites within this supercell. Disorder at the 2h sites is straightforward to describe since the respective Na+ occupies either one or the other Wyckoff 2h site within the unit cell. Moreover, supercells representing the disorder of the Wyckoff 1f sites also have to maintain the stochiometric composition of the crystal.
![[thin space (1/6-em)]](https://www.rsc.org/images/entities/char_2009.gif) 536 configurations formed by 16 individual unit cells for the 2h site. Additionally, for the 1f site of β-NaYF4, we can distribute 8 Na+ ions over 16 sites leading to
536 configurations formed by 16 individual unit cells for the 2h site. Additionally, for the 1f site of β-NaYF4, we can distribute 8 Na+ ions over 16 sites leading to  configurations for this site, thus resulting in a total of more than 800 million configurations for both sites (i.e., 1f and 2h). While symmetry considerations reduce these numbers, they stay much too large for computations. This is in stark contrast to LiYF4, for which the completely ordered crystal is described by a single configuration, independent of the number of unit cells used.57 Finding an appropriate supercell and a manageable but sufficient number of configurations to describe the desired property is therefore a critical first step when creating a theoretical model for a disordered crystal.
To accurately describe the influence of the cation disorder, a 2 × 2 × 4 supercell has been chosen (Fig. 2). An in-depth discussion thereof is provided in the ESI.† In brief, a 2 × 2 × 4 supercell exhibits four rows of 1f sites along the c-axis. Three of these were altered when investigating disorder around the 1a site and one was altered for the investigation of the 1f site. Rows that were not neighbouring these sites are represented in faint colours in Fig. 2. These not neighbouring (faint) rows were occupied by an alternating sequence of Na+ and Y3+, which was kept fixed throughout all calculations. This simplification of the supercell induces some slight uncertainty with respect to the obtained results but the influence of these rows on the highlighted central sites should be marginal.
 | ||
| Fig. 2 2 × 2 × 4 supercell of β-NaYF4 with the composition Na24Y24F96. Highlighted are a potential (A) 1a and (B) 1f doping site (white labels), and their first anionic (F− ions of the blue prism that are highlighted in cyan and pink) and cationic (Na+ and Y3+ ions marked with a thick black circle) coordination spheres. Na+ and Y3+ at the not neighbouring 1f rows (represented as faint) were not exchanged when creating the different configurations of the supercell. All other 1f sites were altered successively. For better visualisation, a close-up of the two potential doping sites with their nearest ions is shown in Fig. 3A and B. | ||
 | ||
| Fig. 3 Potential (A) 1a and (B) 1f doping sites and their first anionic and cationic coordination spheres for the supercells shown in Fig. 2A and B, respectively. The corresponding supercells are designated as configuration (A) 10 and (B) 1 in Table 1. Two additional configurations are shown in C and D, corresponding to configuration 15 and 2, respectively, in Table 1. Here some of the 1f sites were altered in comparison to configuration 10 and 1. For all clusters the 1a, 1f, and 2h sites are labelled by their Wyckoff symbols, the central site is labelled in white. The 1f sites for which the distribution of Na+ and Y3+ were altered in this study are set in bold and numbered from (1f-) 1 to 6 (panels A and C) and 1 to 2 (panels B and D) for the potential 1a and 1f doping sites, respectively. The numbering of these sites is equivalent to the scheme used in the last column of Table 1. All clusters presented here were created for visualisation purposes only and are still embedded in their respective supercells used for the geometry optimisation. | ||

|
Table 1 gives an overview of the various configurations created for the two clusters. By dividing the number of symmetry equivalent configurations (i.e., degeneracy, second column) by the overall number of configurations for the individual cluster and multiplying by 1/3 or 2/3 for a potential 1f or 1a doping site, respectively, the weighting of this group of (symmetry equivalent) configurations is obtained (third column). The symmetry of the nine F− around the central ion is also stated. These point groups are very crude approximations that only consider shifts of the F− along the c-axis, depending on the nearest neighbouring ions at the 1f sites as suggested by Aebischer et al.27 Because of the differing ionic radii, Na+ pushes the closest F− stronger away than Y3+ (along the c-axis). This approximation is less valid when incorporating shifts along the other two axes and breaks down completely when considering changes introduced by Na+ at the disordered 2h sites.40 However, it is a helpful designation to understand the influence of the different distributions of Na+ and Y3+ at neighbouring 1f sites onto the F−. The last column of Table 1 states the distribution of Na+ and Y3+ onto the six (two) 1f sites shown in Fig. 3.
To give an example, for configuration 5, five additional symmetry equivalent configurations exist. This can easily be deduced from the five Na+ and one Y3+ that are distributed among the six 1f positions around a 1a site. The single Y3+ can be placed at each of the six positions, and the five remaining Na+ are all equivalent (their placing order therefore does not matter). The total number of configurations for a 1a site is 64. Therefore, an Ln3+ ion doped into β-NaYF4 has a probability of 6/64·2/3 = 0.0625 or 6.3% to be located in an environment of this or an equivalent configuration. All of these considerations are purely with respect to geometric aspects. The energetic difference between individual configurations determines their actual occurrence in a real crystal and will be examined after the geometry optimisation. Finally, the positions of the F− were considered to determine the point group of the central ion. The 1f sites 5 and 6, consisting of one Na+ and one Y3+, influence one of the F− by moving it closer to Y3+, while all other F− stay in place. This reduces the point group around the central 1a site from C3h to C1.
The configurations listed in Table 1 were generated and energetically optimised as described in the computational details.
Nonetheless, to estimate the potential impact of the 2h disorder, three representative 2h configurations were selected and calculated. Therefore, one possible distribution was chosen for the in total 16 Na+ at 2h sites in a 2 × 2 × 4 supercell (referred to as Na1) and used for all subsequent calculations. The occupied sites were chosen so that an equal amount of Na+ was displaced along the +c- and −c-axis in each unit cell, reflecting the average distribution in a real crystal. After energetically minimising all configurations for the different Na+/Y3+ distributions at the 1f sites, the 2h distribution was adjusted for the energetically most stable structure (configuration 10). This resulted in the creation of configurations 10-Na1, -Na2, and -Na3. Na1 is the distribution of Na+ at the 2h site used initially (and for all other configurations of βNaYF4). Na2 is another c-axis balanced distribution (see above). However, in comparison to Na1, in Na2 the Na+ were shifted differently along the c-axis. Finally, for Na3 the eight Na+ closest to the potential doping site were all displaced along the −c-axis. After creating these two additional configurations (i.e., Na2 and Na3), the structures were optimised a second time. Optimization of these two configurations, Na2 and Na3, and their comparison to configuration Na1 provided evidence that the influence of the 2h disorder on the potential doping sites is less significant than the disorder at the 1f sites (vide infra). Therefore, no additional 2h disordered configurations were created.
Overall, the 2 × 2 × 4 supercell consists of 144 ions, 24 of which being Y3+. Replacing one of these Y3+ ions by an Ln3+ results in a doping concentration of 4.2 mol%. Doping concentrations, especially for activator ions such as Er3+ and Tm3+, are usually well below these values. In fact, the most common doping concentrations for Er3+ and Tm3+ are 2 mol% and 0.5 mol%, respectively.58,59 However, enlarging the supercell further (and thereby reducing the doping concentration) is limited by the steeply increasing computational demand and was therefore not carried out.
Ordered LiYF4
 | ||
| Fig. 4 (A) Unit cell of LiYF4 with the composition Li4Y4F16. Dark green spheres represent Y3+, light green spheres Li+, and small grey spheres represent F−. LiYF4 features only one potential doping site, i.e., Wyckoff position 4b. (B) Coordination polyhedron around Y3+. Each Y3+ at a 4b site is surrounded by eight F− ions, creating a distorted square antiprism. | ||
Computational details
Results and discussion
Undoped and doped (Er3+, Tm3+, Yb3+) minimum energy structures for different configurations of β-NaYF4 in a 2 × 2 × 4 supercell were calculated with the settings described above. The same was done for the single available configuration of LiYF4 in a 3 × 3 × 1 supercell. The structures were evaluated in terms of relative energies, lattice parameters, and Y3+–F− bond lengths. These properties were then compared to experimental and theoretical data, if available.Validation of the model
It should be mentioned that the authors of both abovementioned computational studies stated a smaller discrepancy to experimental values. However, both referenced a LiYF4 crystal structure by Garcia et al. that was synthesised adding 2 wt% of PrF3.72 Even though the influence of the dopant on the lattice structure is small (vide infra), comparison to an undoped sample is still preferable. For pure LiYF4 and the 2 wt% of Pr3+ containing crystals average bond lengths for two types of Y3+–F− bonds were obtained.57,72 Determination of the Y3+–F− bond lengths for the crystal structure optimised in our study unveiled discrepancies to the experimental values of 5.8% and 0.7%, respectively. Yin et al. calculated the same bond lengths for pure LiYF4, and deviations were at a similar range (6.4% and 0.2%, respectively).73 With respect to the calculated band gap, our results very closely matched computed values that used a functional of the same type (generalized gradient approximation, GGA).74,75 However, both our and their computational studies deviated from the experimental value by about 25%.71,76 In fact, calculations describing exchange and correlation by GGA type functionals are known to underestimate the band gap of semiconductors and insulators.77 Hence, our calculated values were within the expected margin of error. Better results can be achieved with more sophisticated methods, if required.71 Our results further demonstrated that doping the structure with Er3+, Tm3+, or Yb3+ only marginally changes the lattice structure (on average less than 1% for all three dopants). This is most likely due to the small doping concentration and the similarity of the ionic radii. This will be discussed in more detail for β-NaYF4. Thus, all values assessed suggest that our approach is well suited for predicting structural parameters of inorganic crystals beyond LiYF4.
Thus, we have demonstrated the suitability of our protocol to predict lattice parameters and average bond lengths for two lattices with different crystallographic properties, i.e., LiYF4 and β-NaYF4, with reasonable accuracy. The chosen approach of averaging over 16 different configurations for β-NaYF4 indeed provided results that are close to reported experimental values. More importantly though, now that individual configurations have been created and optimised, they can be compared to each other, and possible trends may be deduced.
Impact of disorder for β-NaYF4
| Undoped β-NaYF4 | 4.2% Er3+ | ||||
|---|---|---|---|---|---|
| Site | Config. | ΔE | Dev.LP | Y3+–F− | ΔE |
| (kJ mol−1) | (%) | (Å) | (kJ mol−1) | ||
| 1f | 1 | 0.0 | 0.77 | 2.347 | 0.1 |
| 2 | 1.9 | 0.83 | 2.342 | 2.4 | |
| 3 | 3.4 | 0.90 | 2.338 | 3.4 | |
| 1a | 4 | 6.5 | 0.78 | 2.372 | 6.5 |
| 5 | 4.6 | 0.85 | 2.354 | 4.6 | |
| 6 | 4.3 | 0.88 | 2.360 | 3.4 | |
| 7 | 1.9 | 0.88 | 2.346 | 1.8 | |
| 8 | 1.8 | 0.92 | 2.345 | 1.8 | |
| 9 | 1.2 | 0.86 | 2.336 | 1.2 | |
| 10 | 0.0 | 0.77 | 2.338 | 0.0 | |
| 11 | 2.6 | 0.87 | 2.344 | 1.6 | |
| 12 | 1.9 | 0.92 | 2.333 | 1.9 | |
| 13 | 2.0 | 0.86 | 2.335 | 2.3 | |
| 14 | 4.8 | 0.89 | 2.336 | 4.8 | |
| 15 | 4.2 | 0.84 | 2.330 | 4.2 | |
| 16 | 7.9 | 0.76 | 2.326 | 8.3 | |
Another important parameter to assess is the deviation of the lattice parameters (DevLP, Table 4). This parameter describes the deviation of the calculated lattice parameters from the experimental values and was obtained by averaging over the relative deviations of the individual cell vectors. Again, configuration 10 featured one of the smallest deviations. The highly regular alternation of Na+ and Y3+ for this configuration is probably the main reason for the low lattice energy and small lattice parameter deviation observed. However, the difference in lattice energy for the remaining 14 configurations is at most 7.9 kJ mol−1, even for the two configurations with the most locally clustered distributions of Na+ and Y3+ (configuration 4 and 16 with six Na+ and six Y3+, respectively).
Indeed, nanoparticles of this crystal type are typically synthesised at temperatures of up to 300 °C. At this temperature, the Boltzmann population of the energetically most unfavourable configuration (configuration 16) amounts to 0.19 (Table 5) as compared to the most stable configuration (configuration 10). Under the assumption of elevated synthesis temperatures and rapidly cooled crystallites, all configurations are therefore likely to be present (locally) in such a crystal. Adding to this, the sample used for characterisation by Aebischer et al. was prepared at even higher temperatures, i.e., 590 °C.27,46 At such high temperature, the expected relative population of configuration 16 is as high as 0.33. On the other hand, once a reaction mixture has cooled down, especially if quenched, a positional change of Na+ and Y3+ to produce energetically favourable alternating rows after the formation of a disordered crystal is unlikely as ion swapping is associated with a significant energy barrier.44,46,79 Considering Boltzmann distribution and the statistical weighting (Table 5), it can also be deduced that for temperatures above 170 °C configuration 11 is the most likely to be found in a crystal. This is because the statistical weighting of configuration 11 is twice as high as that of configuration 10, and its occupation probability raises above 0.5 at this temperature compared to configuration 10. Furthermore, it must be emphasized that, in principle, configurational entropy has to be considered for the disordered configurations as well, thus, making their occurrence even more likely.
| n (=configuration) | 4 | 5 | 6 | 7 | 8 | 9 | 10 | 11 | 12 | 13 | 14 | 15 | 16 | Total | |
|---|---|---|---|---|---|---|---|---|---|---|---|---|---|---|---|
| Symmetry | C 3h | C 1 | C 3h | C 1 | C 1 | C 3v | C 1 | C 1 | C 1 | C 1 | C 3h | C 1 | C 3h | C 1 (%) | |
| ΔE = En − E10 (kJ mol−1) | 6.509 | 4.588 | 4.331 | 1.901 | 1.791 | 1.180 | 0 | 2.586 | 1.911 | 2.002 | 4.801 | 4.158 | 7.948 | ||

|
T = 20 °C | 0.07 | 0.15 | 0.17 | 0.46 | 0.48 | 0.62 | 1.00 | 0.35 | 0.46 | 0.44 | 0.14 | 0.18 | 0.04 | 91.1 |
| T = 300 °C | 0.26 | 0.38 | 0.40 | 0.67 | 0.69 | 0.78 | 1.00 | 0.58 | 0.67 | 0.66 | 0.37 | 0.42 | 0.19 | 88.7 | |
| T = 590 °C | 0.40 | 0.53 | 0.55 | 0.77 | 0.78 | 0.85 | 1.00 | 0.70 | 0.77 | 0.76 | 0.51 | 0.56 | 0.33 | 87.5 | |
| Weighting (%) | 1.0 | 6.3 | 3.1 | 6.3 | 6.3 | 2.1 | 6.3 | 12.5 | 6.3 | 6.3 | 3.1 | 6.3 | 1.0 | 84.4 | |
The original report by Aebischer et al. also mentions symmetry considerations supporting that configuration 10 might be the most likely one.27 Nonetheless, this configuration is definitely not the only one to be found in such a crystal. The authors conducted Monte Carlo simulations from which they deduced that in 93–95% of the modelled cells the surrounding of a 1a site was reduced to C1 symmetry because of the disorder at the 1f site and its influence on the F− surrounding the 1a site. However, if all 1f rows strictly followed the previously proposed alternation along the c-axis, every single 1a site must be of C1 symmetry (=100%). This is because each 1a cluster will have two 1f rows with opposite Na+/Y3+ allocation in their first cationic coordination sphere. Each of them will therefore push one F− of the 1a site into different (opposite) directions, resulting in C1 symmetry.
The discrepancy between 93–95% and 100% C1 symmetry can be partially explained through the data made available by this study. When looking at the distribution of the different symmetries through the weighted average of the configurations for a potential 1a doping site (Table 1, configuration 4 to 16), 84.4% of these configurations will be of C1 symmetry (i.e., 54 of the in total 64 configurations; last column of Table 5). If furthermore varying occupational probabilities between these different configurations (induced by their relative energetic differences) via Boltzmann distribution are considered, almost 89% of the potential doping sites (depending on the temperature) should be of C1 symmetry. While this does not provide direct evidence for the actual symmetry distribution around the 1a sites, it strongly suggests that there is deviation from the energetically favoured strictly alternating 1f rows.
Also, it should be noted that all symmetry considerations are invalidated once the disorder at the 2h sites is considered. Except for specific and rather rare configurations of the six 2h Na+ around a 1a site, these Na+ remove any remaining symmetry elements by pushing the closest F− in different directions, resulting in C1 symmetry for most if not all 1a (and also 1f) sites. Based on all of the above aspects of symmetry and energetic consideration, we therefore concluded that the F− around the 1a sites were considerably more disordered than suggested by Aebischer et al., and that probably almost all 1a and 1f sites were of C1 symmetry.
Aebischer et al. additionally mentioned a displacement of the three 3j F− along the c-axis in between two neighbouring 1f sites depending on the distribution of Na+ and La3+ at these sites.27 It was stated that an F− between a pair of Na+ and La3+ at adjacent 1f sites will be displaced by 0.07 Å towards La3+ because of the larger ionic radius of Na+. Thereby, the bond between F− and La3+ is shortened as evidenced in the datasets generated in our study. In configuration 1, the central 1f Y3+ has two Na+ at the two neighbouring 1f sites (Fig. 2B, and Table 1). Such an arrangement is quite different from configuration 3, in which the two neighbouring 1f sites are both occupied by Y3+. While the average bond length for all nine F− presented in Table 4 suggests that configuration 3 has shorter bonds (contrary to the Monte Carlo model of Aebischer et al.),27 a detailed analysis revealed that the bonds between Y3+ and the six 3j F− in configuration 1 were indeed shortened on average by 0.03 Å compared to configuration 3 (one bond is even reduced by 0.08 Å). The apparent elongation in the averaged result can be explained by the three 3k F− that show a significant increase in bond length by 0.04, 0.09, and 0.14 Å. The discrepancies (i.e., shorting by 0.03 Å compared to 0.07 Å) between these ab initio results and the Monto Carlo model can either be rooted in the model itself, the different ions being used (although the ionic radius of Y3+ is smaller than that of La3+, and therefore, a larger and not smaller displacement of the six 3j F− for Y3+ seems therefore plausible), or possibly in the different occupation of Na+ at the 2h sites. While Aebischer et al.27 did not report on the 2h sites, our results provide evidence that these sites have significant influence on the bond lengths (see next section).
Similar to the potential 1f doping site, the general trend observed for the Y3+–F− bond lengths at the 1a sites can be summarised as following: the more of the neighbouring 1f sites were occupied by Na+, the more distorted prisms as well as overall longer average bond lengths (Table 4) were observed. In summary, the distribution of Na+ and Y3+ at the 1f sites has a significant influence on the position of both the 3j and 3k F− and thereby has a profound impact on the coordination sphere of Ln3+ ions at both the 1a and 1f sites.
| NaX | ΔE (kJ mol−1) | Dev.LP (%) | Y3–F− (Å) |
|---|---|---|---|
| A | β-NaYF 4 | ||
| Na1 | 0.0 | 0.77 | 2.338 |
| Na2 | 0.1 | 0.79 | 2.334 |
| Na3 | 1.4 | 0.81 | 2.332 |
| B | β-NaYF 4 : 4.2% Er 3+ | ||
| Na1 | 0.0 | 0.76 | 2.338 |
| Na2 | 0.8 | 0.82 | 2.334 |
| Na3 | 1.7 | 0.93 | 2.330 |
Changing the disorder at the 2h sites randomly but c-axis balanced (Na1 to Na2) resulted in rather insignificant changes in the lattice energy of 0.1 kJ mol−1. Even aligning all Na+ closest to the central ion towards one direction (Na3) increased the lattice energy by only 1.4 kJ mol−1. These values are smaller than most energy difference observed when changing the occupation of Na+ and Y3+ at the 1f-disordered sites (third column of Table 3). Deviations of the lattice parameters and average bond lengths were more pronounced, although still small when considering the significant changes observed from the 1f disorder. A noteworthy change induced by the 2h disorder is the observed reduction of individual Y3+–F− bond lengths of up to 0.05 Å when a 2h Na+ is very close to or aligning with the central 1f site along the c-axis (compared to a structure where it is placed much further away). The corresponding 3k F− in between the 2h Na+ and the 1f site is thereby pushed closer to the 1f site by the 2h Na+. Overall, the influence of the Na+ at the 2h sites onto the F− very much resembles that of Na+ and Y3+ at the 1f sites. In both cases, the closest F− is pushed away from its ideal position. Therefore, disorder at 2h sites might not have as much of an impact on the overall crystal structure but great local influence on the positions of specific F−. With small energetic differences between individual distributions of Na+ at 2h sites, a high prevalence of different arrangements can be expected. At the same time, the presumably significantly lower energy barrier for the rearrangement of 2h Na+ (no ion swapping is required in this case) is probably also connected to a higher degree of variation for this disordered site.40,53
| Ln3+ | ΔE (kJ mol−1) | Dev.LP (%) | Y3+–F− (Å) |
|---|---|---|---|
| β-NaYF 4 : 4.2% Ln 3+ | |||
| — | — | 0.77 | 2.338 |
| Er3+ | 0.00 | 0.76 | 2.338 |
| Er3+TZV2P | −0.12 | 0.76 | 2.338 |
| Tm3+ | — | 0.76 | 2.338 |
| Yb3+ | — | 0.77 | 2.333 |
Considering these results, for structures with a low doping concentration, the intrinsic disorder induced by the lattice itself seems to be far more influential than the disorder induced by the dopant ion. These findings contradict the statements of an earlier experimental study, which assumed severe structural changes induced by doping and how these changes explain why P63/m is the more appropriate space group for β-NaYF4.42 While we do not argue whether P63/m or P is the more accurate designation, we would like to emphasise that the results obtained from the present study do not support the previously made hypothesis. Instead of arguing that doping will distort the lattice and thereby create different local environments for the dopant, it seems more appropriate that different dopant sites are created through the occupational disorder of the lattice, and at these sites, ions can be doped into. This should be true for both space groups discussed for β-NaYF4 but also α-NaYF4 and related compounds. The earlier report even provides evidence for this explanation as it demonstrated that the local surrounding of the dopants does not change when increasing the dopant concentration from 0.5 to 20 mol%.
Lastly, one additional calculation for Er3+-doped β-NaYF4 in configuration 10 was conducted in which the basis set for Er3+ was expanded (TZV2P). This calculation was repeated with all other parameters kept constant. In principle, increasing the size of the basis set is expected to improve the reliability of the obtained results (on the expense of an increased computational demand). Compared to the results obtained with the smaller DZVP basis set, increasing the basis set reduced the energy of the supercell by 0.12 kJ mol−1, and influenced the lattice parameters as well as the average positions of the nine F− by about 0.1% (Table 7). Note that different to all other tables the reference value for ΔE in this table was not the lowest value displayed (i.e., the TZV2P value) but the one from the DZVP calculation for better comparison with the energetic differences for the other Er3+-doped configurations (i.e., Table 4, Table S1† and Table 6). Hence, there was no indication that the overall trends observed will significantly change when recalculating all doped structures with this larger basis set on Ln3+.
From infinite and defect-free computational crystal structures to nanoscale materials: potentials and limitations
While results obtained from computational studies undoubtedly provide valuable insights, their direct applicability to the properties of experimentally obtained (nano)materials may remain uncertain as a computational model always comes with inherent simplifications and assumptions not necessarily transferable to real life. This indeed holds also true for the here presented study. Hence, in light of this, the following considerations, including potential and limitations of the presented model, shall be kept in mind.It is important to acknowledge that the synthesis of nanoparticles (but also bulk materials) inevitably induces a plethora of defects within the lattice and at the material's surface. In case of upconverting nanoparticles, these defects can influence the structural properties of the host material as well as the optical properties of the dopants.80 Such deviations from the perfectly ordered, infinitely repeating unit cell that forms the basis of the computational approach become especially relevant for nanoparticles with their small volume-to-surface ratio. With a large share of unit cells close to the surface, lattice defects, dangling bonds, and the nanoparticle's environment become more and more relevant as particle size decreases. This constitutes a limitation of the model designed for this (and other) computational study as such surface effects cannot be easily assessed.
Most studies in the literature focus on the upconverting ions doped into inorganic host crystals. Conversely, the focus of this study explicitly lays on the lattice structure of the examined crystals and its disorder. Other groups computationally predicted the properties of dopant ions in crystals such as α- and β-NaYF4.28,49,52,81–84 Indeed, some of these studies appreciate differently induced disorder, yet, typically at a more shallow level. In most of these computational approaches, surface effects and transferability to the nanoscale remain unaddressed – an open question to be tackled in future works by the community.
A key challenge when setting up appropriate computational models is that defects are not necessarily distributed homogeneously across a nanoparticle but tend to accumulate near the surface.85 On the other hand, the larger a nanoparticle the larger its portion that is sufficiently far away from the surface so that close-to-bulk properties may be assumed.86 We would therefore argue that – except for the smallest nanoparticles – the chosen configurations become representative for most parts of a nanoparticle.
With these aspects in mind, the presented calculations are foreseen to act as stepping stone towards more realistic modelling at the nanoscale. While our model may still be closer to the bulk material than to a nanoparticle, it is arguably closer to the latter than the computational models previously designed. This is due to the fact that it incorporates disorder on a level much closer to experimentally obtained materials. Nevertheless, it is important to acknowledge that future work will have to consider effects of surface, disorder, and defects on the structure in general and dopant properties in particular at the nanoscale.
Conclusions
In this study, the atomistic structure of two model systems for photon upconverting crystals were investigated with density functional theory, namely the ordered crystal structure of LiYF4 and the disordered structure of β-NaYF4. Undoped as well as Er3+-, Tm3+-, or Yb3+-doped crystals were created in the developed model, and the relative stability of different disordered atomistic arrangements was investigated. Results obtained from these systems were compared to already existing data when available to validate the model. Furthermore, new data were generated to answer questions about the effect of occupational disorder and disorder induced via doping into the crystal structure.The results of this study can be best evaluated by dividing them into four categories. First, it was demonstrated that the chosen methodology (DFT with periodic boundary conditions) and programme (CP2K) are well suited for predicting atomistic properties of an ordered inorganic crystal structure, such as LiYF4. We then verified the suitability of this model to predict crystal structures and to examine local variations for a disordered crystal, namely β-NaYF4. Second, a rational for creating such a model was provided. It was found that a sufficiently large supercell of the crystal must be created, and a significant although not too extensive number of configurations must be assessed. These configurations must be chosen wisely so that each represents one possible and ideally highly likely distribution of ions in the disordered lattice. Third, in the case of β-NaYF4, three potential sources of variations within the crystal were examined: disordered 1f sites, disordered 2h sites, and disorder induced through doping with Er3+, Tm3+, or Yb3+. Of these three possible sources of disorder, disordered 1f and 2h sites were identified as those that most significantly influence the positions of the F− ions around potential doping sites. While changes at 1f sites seemed to be more relevant than those at 2h sites, both were found to be much more important than changes introduced by low-concentration doping. In general, low-percentage doping does not appear to be a significant source of distortion for these crystal structures. Forth and finally, assumptions of earlier studies focusing on the 1f disorder (alternating rows of Na+ and Y3+) were mostly confirmed but more importantly also refined. After all, the X-ray structural information of β-NaYF4 is in line with the results of our protocol (once averaged over the different configurations) and the crystal structure should be considered as being significantly disordered.
In summary, this study showed the high likelihood that the β-NaXF4 (X = lanthanides plus yttrium) crystal family is best described as consisting of a variety of unit cells, all with differing configurations of the ionic positions. The knowledge gained about the local variations of ions around potential doping sites can act as stepping stone for future studies to more accurately predict properties such as energy levels and energy gaps of individual Ln3+ or oscillator strengths and energy transfer rates between pairs of dopants in these crystals. Ultimately, this may lead to the design of next-generation upconverting nanoparticles overcoming current limitations such as low quantum yield.
Author contributions
Chris Steve Conrad: investigation, formal analysis, writing – original draft, conceptualization (general project, approach, model setup), funding acquisition; Holger Euchner: investigation, conceptualisation (theoretical approach), writing – review and editing; Eva Hemmer: conceptualisation (underlying goal and compound selection), writing – review and editing, supervision; Reinhold F. Fink: conceptualisation (approach, model setup), writing – review and editing, supervision, funding, resources.Data availability
The optimised crystal structures of LiYF4 and of configuration 10 of undoped β-NaYF4 are provided in the ESI.† All other are available from the authors upon request or at https://doi.org/10.6084/m9.figshare.27846741.v1.Conflicts of interest
There are no conflicts to declare.Acknowledgements
CSC is grateful for a scholarship by Friedrich-Ebert-Stiftung and support from MITACS. CSC and RFF acknowledge support by the state of Baden-Württemberg through bwHPC and the German Research Foundation (DFG) through grant no INST 40/575-1 FUGG (JUSTUS 2 cluster). EH acknowledges the Natural Sciences and Engineering Research Council of Canada (NSERC RGPIN-2023-03985). Images shown in the ToC figure were partially made using BioRender (https://www.biorender.com) and VESTA.References
- F. Auzel, C. R. Acad. Sci., 1966, 262, 1016 Search PubMed.
- F. Auzel, C. R. Acad. Sci., 1966, 263, 819 Search PubMed.
- F. Auzel, Chem. Rev., 2004, 104, 139–174 CrossRef CAS PubMed.
- S. Heer, O. Lehmann, M. Haase and H.-U. Güdel, Angew. Chem., Int. Ed., 2003, 42, 3179–3182 CrossRef CAS.
- M. Haase and H. Schäfer, Angew. Chem., Int. Ed., 2011, 50, 5808–5829 CrossRef CAS PubMed.
- S. Qiao, R. Pu, X. Guo, Y. Ni, C. Wu, B. Wang, Y. Du, J. Huang, K. Zheng, W. Wei and Q. Zhan, ACS Appl. Nano Mater., 2024, 7, 12795–12805 CrossRef CAS.
- R. S. Ajee, P. S. Roy, S. Dey and S. Sundaresan, J. Nanopart. Res., 2024, 26, 50 CrossRef CAS.
- S. Varghese, A. S. Madanan, M. K. Abraham, A. I. Shkhair, G. Indongo, G. Rajeevan, B. K. Arathy and S. George, Microchem. J., 2024, 206, 111539 CAS.
- M. Liu, J. Liang and F. Vetrone, Acc. Chem. Res., 2024, 57, 2653–2664 CAS.
- J. Y. Jung, J. Y. Park and H. K. Yang, Adv. Opt. Mater., 2024, 12, 2401210 CAS.
- Z. Fan, Y. Shao, X. Jiang, J. Zhou, L. Yang, H. Chen and W. Liu, Int. J. Biol. Macromol., 2024, 278, 134187 CAS.
- Y. Yang, K. Q. Long, Y. X. Chu, H. P. Lu, W. P. Wang and C. Y. Zhan, Adv. Funct. Mater., 2024, 34, 2402975 CAS.
- Y. Jiang, Y. Hong, Y.-Y. Liu, Y. Guan, J. Zhou, H. Wang and L. Sun, J. Mater. Chem. C, 2024, 12, 11938–11947 CAS.
- C. Xu, S. K. Law and A. W. N. Leung, Pharmaceuticals, 2024, 17, 663 CAS.
- M. Hosseinifard, N. Jurga, J. C. Brandmeier, Z. Farka, A. Hlaváček, H. H. Gorris, T. Grzyb and A. Ekner-Grzyb, Chemosphere, 2024, 347, 140629 CAS.
- J. Yu, H. Yu, L. Li, X. Ni, K. Song and L. Wang, ChemNanoMat, 2021, 7, 859–872 CAS.
- A. Alotaibi, F. Alsardi, F. Alshwikhat, M. Aldossary, F. S. Almarwani, F. J. Talidi, S. A. Almenhali, S. F. Almotawa, Y. A. Alzahrani, S. Alenzi, A. Alanazi and M. Alkahtani, Molecules, 2024, 29, 2556 CAS.
- W. Zhang, W. Zheng, P. Huang, D. Yang, Z. Shao and X. Chen, Aggregate, 2024, 5, e558 CAS.
- N. Dubey and S. Chandra, J. Rare Earths, 2022, 40, 1343–1359 CAS.
- A. A. Ansari, M. A. M. Khan, B. P. Singh and A. K. Parchur, J. Mater. Sci.: Mater. Electron., 2023, 34, 1625 CAS.
- S. Mohanty and A. M. Kaczmarek, Chem. Soc. Rev., 2022, 51, 6893–6908 RSC.
- X. Xia, E. Sivonxay, B. A. Helms, S. M. Blau and E. M. Chan, Nano Lett., 2023, 23, 11129–11136 CrossRef CAS.
- F. Li, L. Tu, Y. Zhang, D. Huang, X. Liu, X. Zhang, J. Du, R. Fan, C. Yang, K. W. Krämer, J. Marques-Hueso and G. Chen, Nat. Photonics, 2024, 18, 440–449 CrossRef CAS.
- C. K. J. Renata Reisfeld, Lasers and Excited States of Rare Earths, Springer-Verlag, Berlin Heidelberg New York, 1977 Search PubMed.
- R. Renata, AIMS Mater. Sci., 2015, 2, 37–60 Search PubMed.
- W. T. Carnall, in Handbook on the Physics and Chemistry of Rare Earths, ed. K. A. Gschneidner and L. Eyring, North-Holland Publishing Company, Amsterdam, 1979, vol. 3, ch. 24, p. 171–208 Search PubMed.
- A. Aebischer, M. Hostettler, J. Hauser, K. Krämer, T. Weber, H. U. Güdel and H.-B. Bürgi, Angew. Chem., Int. Ed., 2006, 45, 2802–2806 CAS.
- A. Platonenko and A. I. Popov, Opt. Mater., 2020, 99, 109529 CrossRef CAS.
- X. Zhu, J. Zhang, J. Liu and Y. Zhang, Adv. Sci., 2019, 6, 1901358 CAS.
- Y. Wu, M. J. Y. Ang, M. Sun, B. Huang and X. Liu, J. Phys. D: Appl. Phys., 2019, 52, 383002 CAS.
- R. Shannon, Acta Crystallogr., Sect. A, 1976, 32, 751–767 Search PubMed.
- I. Halimi, E. M. Rodrigues, S. L. Maurizio, H.-Q. T. Sun, M. Grewal, E. M. Boase, N. Liu, R. Marin and E. Hemmer, J. Mater. Chem. C, 2019, 7, 15364–15374 CAS.
- C. Homann, N. Liu, H. Barbosa and E. Hemmer, in Handbook on the Physics and Chemistry of Rare Earths, ed. J.-C. G. Bünzli and S. M. Kauzlarich, Elsevier, 2024, vol. 65, pp. 137–212 Search PubMed.
- J. F. Suyver, J. Grimm, M. K. van Veen, D. Biner, K. W. Krämer and H. U. Güdel, J. Lumin., 2006, 117, 1–12 CAS.
- C. Renero-Lecuna, R. Martín-Rodríguez, R. Valiente, J. González, F. Rodríguez, K. W. Krämer and H. U. Güdel, Chem. Mater., 2011, 23, 3442–3448 CAS.
- D. Pominova, V. Proydakova, I. Romanishkin, S. Kuznetsov, K. Linkov, N. Tabachkova and A. Ryabova, Photonics, 2024, 11, 38 CAS.
- S. Han, R. Deng, X. Xie and X. Liu, Angew. Chem., Int. Ed., 2014, 53, 11702–11715 CAS.
- L. D. DeLoach, S. A. Payne, L. L. Chase, L. K. Smith, W. L. Kway and W. F. Krupke, IEEE J. Quantum Electron., 1993, 29, 1179–1191 CrossRef CAS.
- G. Blasse and B. C. Grabmaier, Luminescent Materials, Springer, Berlin, 1994, pp. 123 Search PubMed.
- R. Shi, C. D. S. Brites and L. D. Carlos, Nanoscale, 2021, 13, 19771–19782 RSC.
- P. Pandey, S. D. Kaushik, P. Rajput, M. N. Singh, R. K. Sharma and S. Giri, Nanoscale, 2025, 17, 2269–2280 RSC.
- D. Tu, Y. Liu, H. Zhu, R. Li, L. Liu and X. Chen, Angew. Chem., Int. Ed., 2013, 52, 1128–1133 CrossRef CAS PubMed.
- J. H. Burns, Inorg. Chem., 1965, 4, 881–886 CrossRef CAS.
- R. E. Thoma, H. Insley and G. M. Hebert, Inorg. Chem., 1966, 5, 1222–1229 CrossRef CAS.
- D. M. Roy and R. Roy, J. Electrochem. Soc., 1964, 111, 421 CAS.
- K. W. Krämer, D. Biner, G. Frei, H. U. Güdel, M. P. Hehlen and S. R. Lüthi, Chem. Mater., 2004, 16, 1244–1251 Search PubMed.
- A. A. Bunaciu, E. G. Udriştioiu and H. Y. Aboul-Enein, Crit. Rev. Anal. Chem., 2015, 45, 289–299 CAS.
- G. Yao, M. T. Berry, P. S. May and D. S. Kilin, Int. J. Quantum Chem., 2012, 112, 3889–3895 CAS.
- G. Yao, M. T. Berry, P. S. May and D. Kilin, J. Phys. Chem. C, 2013, 117, 17177–17185 CAS.
- G. Yao, M. Berry, P. S. May, J. Wang and D. S. Kilin, J. Phys. Chem. C, 2016, 120, 7785–7794 CAS.
- F. Wang, Y. Han, C. S. Lim, Y. Lu, J. Wang, J. Xu, H. Chen, C. Zhang, M. Hong and X. Liu, Nature, 2010, 463, 1061–1065 CAS.
- K.-W. Park, H. S. Jang and S.-H. Cho, Mater. Chem. Phys., 2022, 275, 125317 CAS.
- B. Szefczyk, R. Roszak and S. Roszak, RSC Adv., 2014, 4, 22526–22535 CAS.
- B. Huang, H. Dong, K.-L. Wong, L.-D. Sun and C.-H. Yan, J. Phys. Chem. C, 2016, 120, 18858–18870 CAS.
- B. P. Sobolev, D. A. Mineev and V. Pashutin, Dokl. Akad. Nauk SSSR, 1963, 150, 791–794 CAS.
- A. Grzechnik and K. Friese, Dalton Trans., 2012, 41, 10258–10266 CAS.
- R. E. Thoma, C. F. Weaver, H. A. Friedman, H. Insley, L. A. Harris and H. A. Yakel Jr, J. Phys. Chem., 1961, 65, 1096–1099 CrossRef CAS.
- V. T. Vera, D. Mendez-Gonzalez, D. J. Ramos-Ramos, A. Igalla, M. Laurenti, R. Contreras-Caceres, E. Lopez-Cabarcos, E. Díaz, J. Rubio-Retama, S. Melle and O. G. Calderón, J. Mater. Chem. C, 2021, 9, 8902–8911 RSC.
- R. Joshi, R. S. Perala, S. B. Shelar, A. Ballal, B. P. Singh and R. S. Ningthoujam, ACS Appl. Mater. Interfaces, 2021, 13, 3481–3490 CrossRef CAS.
- J. Hutter, M. Iannuzzi, F. Schiffmann and J. VandeVondele, Wiley Interdiscip. Rev.:Comput. Mol. Sci., 2014, 4, 15–25 CAS.
- G. Lippert, J. Hutter and M. Parrinello, Mol. Phys., 1997, 92, 477–488 CrossRef CAS.
- J. VandeVondele, M. Krack, F. Mohamed, M. Parrinello, T. Chassaing and J. Hutter, Comput. Phys. Commun., 2005, 167, 103–128 CrossRef CAS.
- J. Vande Vondele and J. Hutter, J. Chem. Phys., 2003, 118, 4365–4369 CrossRef CAS.
- J. VandeVondele and J. Hutter, J. Chem. Phys., 2007, 127, 114105 CrossRef PubMed.
- S. Goedecker, M. Teter and J. Hutter, Phys. Rev. B:Condens. Matter Mater. Phys., 1996, 54, 1703–1710 CrossRef CAS PubMed.
- J. P. Perdew, K. Burke and M. Ernzerhof, Phys. Rev. Lett., 1996, 77, 3865–3868 CrossRef CAS PubMed.
- S. Grimme, J. Antony, S. Ehrlich and H. Krieg, J. Chem. Phys., 2010, 132, 154104 CrossRef PubMed.
- K. Momma and F. Izumi, J. Appl. Crystallogr., 2011, 44, 1272–1276 CrossRef CAS.
- C. Keller and H. Schmutz, J. Inorg. Nucl. Chem., 1965, 27, 900–901 CrossRef CAS.
- W. Y. Ching, Y.-N. Xu and B. K. Brickeen, Phys. Rev. B:Condens. Matter Mater. Phys., 2001, 63, 115101 CrossRef.
- M. V. Luong, M. J. F. Empizo, J. L. F. Gabayno, Y. Minami, K. Yamanoi, T. Shimizu, N. Sarukura, M. H. Pham, H. D. Nguyen, K. G. Steenbergen, P. Schwerdtfeger and M. Cadatal-Raduban, Comput. Mater. Sci., 2018, 153, 431–437 CrossRef CAS.
- E. Garcia and R. R. Ryan, Acta Crystallogr., Sect. C:Cryst. Struct. Commun., 1993, 49, 2053–2054 CrossRef.
- J. Yin, Q. Zhang, T. Liu, X. Guo, M. Song, X. Wang and H. Zhang, Nucl. Instrum. Methods Phys. Res., Sect. B, 2009, 267, 74–78 CrossRef CAS.
- S. Li, R. Ahuja and B. Johansson, J. Phys.: Condens. Matter, 2004, 16, 983 CrossRef.
- J. P. Perdew, Phys. Rev. B:Condens. Matter Mater. Phys., 1986, 33, 8822–8824 CrossRef PubMed.
- R. Moncorgé, in Ultraviolet Spectroscopy and UV Lasers, ed. M. A. D. P. Misra, Marcel Dekker Inc., New York, Basel, 2005, pp. 337–370 Search PubMed.
- Á. Morales-García, R. Valero and F. Illas, J. Phys. Chem. C, 2017, 121, 18862–18866 Search PubMed.
- K. Chong, T. Hirai, T. Kawai, S. Hashimoto and N. Ohno, J. Lumin., 2007, 122–123, 149–151 Search PubMed.
- H. Sato and R. Kikuchi, J. Chem. Phys., 1971, 55, 677–702 Search PubMed.
- P. Rudolph, Prog. Cryst. Growth Charact. Mater., 2016, 62, 89–110 CrossRef CAS.
- Y. Han, D. J. Vogel, T. M. Inerbaev, P. S. May, M. T. Berry and D. S. Kilin, Mol. Phys., 2018, 116, 697–707 CrossRef CAS.
- C. M. S. Calado, Í.F Manali, I. M. S. Diogenis, S. F. N. Coelho, V. C. Teixeira, B. R. de Mesquita, J. L. Oliveira, F. A. Sigoli and M. V. D. S. Rezende, Opt. Mater., 2023, 137, 113529 Search PubMed.
- X. Qin and X. Liu, Nanoscale, 2021, 13, 19561–19567 Search PubMed.
- X. Qin, L. Shen, L. Liang, S. Han, Z. Yi and X. Liu, J. Phys. Chem. C, 2019, 123, 11151–11161 Search PubMed.
- G. Tessitore, G. A. Mandl, M. G. Brik, W. Park and J. A. Capobianco, Nanoscale, 2019, 11, 12015–12029 RSC.
- M. Quintanilla, E. Hemmer, J. Marques-Hueso, S. Rohani, G. Lucchini, M. Wang, R. R. Zamani, V. Roddatis, A. Speghini, B. S. Richards and F. Vetrone, Nanoscale, 2022, 14, 1492–1504 Search PubMed.
Footnote |
| † Electronic supplementary information (ESI) available. See DOI: https://doi.org/10.1039/d4nr04880f |
| This journal is © The Royal Society of Chemistry 2025 |