
Molecular clustering behaviour in the cybotactic nematic phase of a spin-labelled liquid crystal
Yoshiaki
Uchida
 *,
Takuya
Akita
,
Kazuki
Hanada
,
Daichi
Kiyohara
and
Norikazu
Nishiyama
*,
Takuya
Akita
,
Kazuki
Hanada
,
Daichi
Kiyohara
and
Norikazu
Nishiyama
Graduate School of Engineering Science, Osaka University, 1-3 Machikaneyama-cho, Toyonaka, Osaka 560-8531, Japan. E-mail: y.uchida.es@osaka-u.ac.jp
First published on 11th April 2022
Abstract
A newly synthesised liquid crystalline nitroxide radical (LC-NR) with a terminal trifluoromethyl group as spin-labelled LC compounds exhibits an anomalous phase transition behaviour. It is likely attributed to non-covalent interactions between the trifluoromethyl groups of the adjacent molecules. X-ray diffractometry of the LC-NR suggests the existence of a cybotactic nematic (Ncyb) phase with a transient and local layer order between the normal nematic (N) and smectic A (SmA) phases. The EPR spectroscopy of the spin-labelled LC implies no discontinuity in magnetic susceptibility around the N-to-Ncyb phase transition. Intermolecular contacts between nitroxide radicals seem to change continuously. These results imply that the interactions between trifluoromethyl groups induce the cybotactic clusters, where molecules move in and out.
Introduction
The properties of liquid crystalline (LC) phases depend on molecular orientations and intermolecular interactions.1,2 The origins of the properties can be discussed based on the comparison of LC superstructures between analogous compounds using a polarised optical microscope and an X-ray diffractometer. It uncovers the correlation of molecular structures with molecular orientations and periodic superstructures. As one of the molecular modifications, fluorine substitution in LC structures affects the melting points, mesophase morphology, transition temperatures, and the many essential physical properties of LC materials, such as optical, dielectric and viscoelastic properties.3Recently, LC nitroxide radicals containing a five-membered ring NR moiety in the mesogen core (LC-NRs) have been reported as metal-free magnetic soft materials.4 In contrast to inorganic solid-state materials, including transition metals (Fe, Co, Ni, etc.) and lanthanides, they are more favourable from the point of view of the element strategy,5,6 and their magnetic properties are fine-tuneable. Some desired functions such as chirality and anisotropy can be easily added by a molecular modification. In addition, these compounds exhibit some fascinating properties in the externally applied magnetic field;7 for example, their molecular reorientation occurs in a uniform magnetic field,8,9 and they exhibit a sort of spin glass-like inhomogeneous ferromagnetic interactions in LC phases.10,11 LC-NRs can be analysed on both molecular orientations and intermolecular interactions. Therefore, the electron paramagnetic resonance (EPR) spectroscopic research using LC-NRs as spin-labelled LC compounds provides understanding of the phenomena from perspectives never seen before: e.g., the pretransitional change of the molecular conformation ensemble in the de Vries type SmA*–SmC* phase transition12 and the dimeric intermolecular interactions based on the electric dipole along the long axis of LC molecules.13,14
As phenomena expected to originate from intermolecular interactions, unconventional LC phases have been reported. One is a nematic phase with a transient local layer order (cybotactic cluster), called cybotactic nematic (Ncyb) phase.15 However, most of the research on cybotactic clusters has focused on bent-core molecules to date;16 some LC molecules with non-covalent interactions like hydrogen bonding have also been reported to show Ncyb phases.17,18 The previous discussion has concluded that lateral interactions between rod-like molecules are important for cybotactic cluster formation. LC-NRs showing Ncyb phases could be used as spin-labelled LCs for EPR spectroscopy, which would clarify the cluster formation process in terms of molecular orientations and intermolecular interactions. We focused on the specific substituents like hydroxy, ionic and fluorinated groups needed to induce the non-covalent interactions for the cybotactic cluster formation. We have already reported hydrogen-bonded LC-NRs,19,20 ionic LC-NRs21 and terminal fluorinated LC-NRs containing a mono-, di- or trifluorobenzene group.22 However, they do not exhibit Ncyb phases originating from fluorination. Here, we report synthesising a new series of LC-NRs with a trifluoromethyl group as a terminal unit. We discuss the molecular clustering behaviour based on EPR spectroscopy for a LC-NR showing an Ncyb phase.
Results and discussion
Design and synthesis
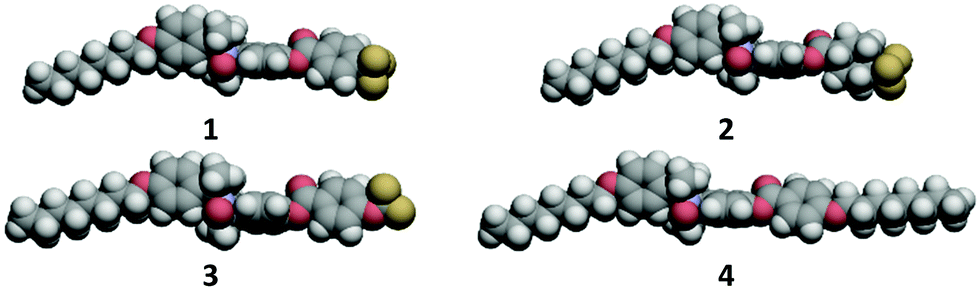
An NR with a phenol moiety as the starting compound was prepared using the previously reported procedure.4,23 We synthesised LC-NRs with a terminal trifluoromethyl group (±)-1–3 by esterifying the starting compound with the corresponding carboxylic acids, as shown in Scheme 1 (see the Experimental section). We compare them with a previously reported analogue (±)-4 for the phase transition behavior.4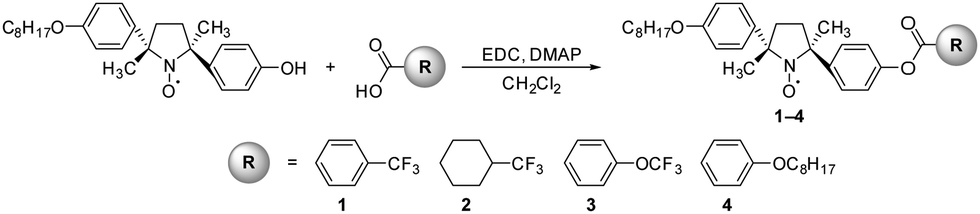 | ||
| Scheme 1 Synthetic route and molecular structures of (±)-1–4. | ||
To check the purity of (±)-1–3, we measured their magnetic properties using EPR spectroscopy and SQUID magnetometry, as summarised in Table 1. The EPR spectroscopy of their tetrahydrofuran (THF) solutions at a field of 0.33 T at room temperature displayed spectra with an intense 1![[thin space (1/6-em)]](https://www.rsc.org/images/entities/char_2009.gif) :1:1 triplet specific to NR compounds with normal g values and hyperfine coupling constants (aN). Their paramagnetic susceptibilities (χ) measured using a SQUID magnetometer at a field of 0.5 T in the temperature range of 2–300 K in the first heating process depend on the temperature, as shown in Fig. 1. The χT–T plots obeyed the Curie–Weiss law in the temperature range between 100 and 300 K (the theoretical C value is 0.375). It indicates that the LC-NRs are paramagnetically pure. They all show weak antiferromagnetic intermolecular interactions at low temperatures (θW < 0).
:1:1 triplet specific to NR compounds with normal g values and hyperfine coupling constants (aN). Their paramagnetic susceptibilities (χ) measured using a SQUID magnetometer at a field of 0.5 T in the temperature range of 2–300 K in the first heating process depend on the temperature, as shown in Fig. 1. The χT–T plots obeyed the Curie–Weiss law in the temperature range between 100 and 300 K (the theoretical C value is 0.375). It indicates that the LC-NRs are paramagnetically pure. They all show weak antiferromagnetic intermolecular interactions at low temperatures (θW < 0).
 | ||
| Fig. 1 Magnetic properties of the newly synthesised compounds. Temperature dependences of molar paramagnetic susceptibility (χpara) and χparaT–T plots of (a) and (b) (±)-1, (c) and (d) (±)-2 and (e) and (f) (±)-3 at a field of 0.5 T in the heating process (2–300 K). Open circles represent the experimental data, solid lines in (a), (c) and (e) show the Curie–Weiss fitting curves, and solid lines in (b), (d) and (f) are horizontal lines at 0.375 K emu mol−1. | ||
Macroscopic phase transition behaviours
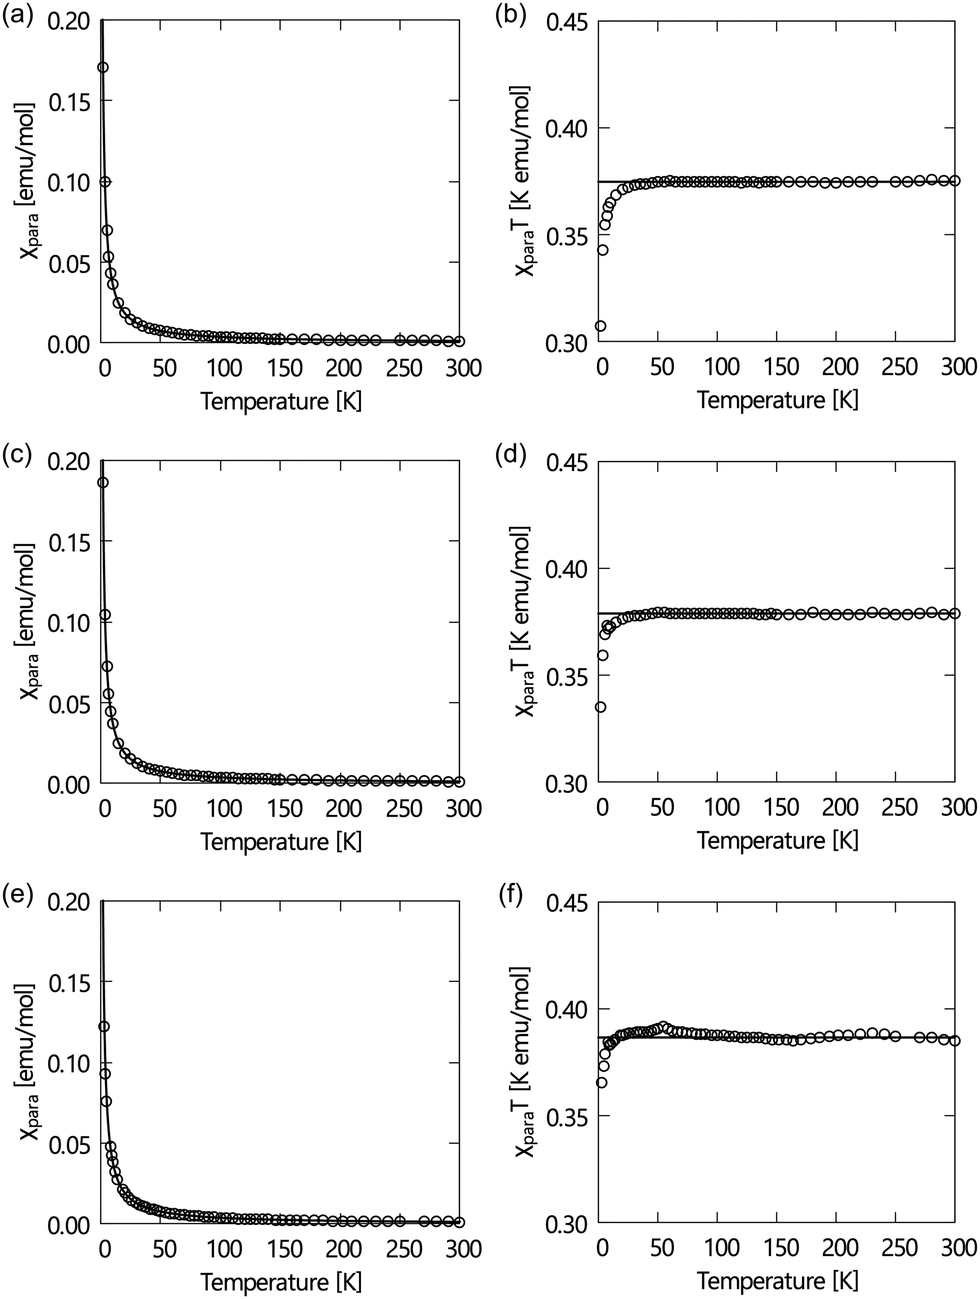
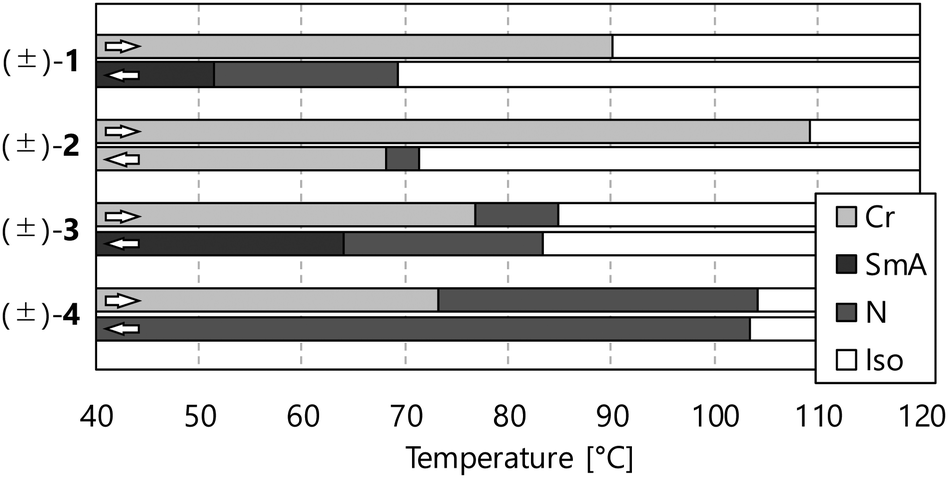
The phase transition behaviours of (±)-1–3 are characterised by differential scanning calorimetry (DSC) analyses at a scanning rate of 5 °C min−1 upon heating and cooling processes, as shown in Fig. 2, and polarised optical microscopy (POM), as shown in Fig. 3. During the DSC cooling run, only (±)-2 crystalised from the supercooled nematic (N) phase as soon as it phase-transitioned from the isotropic phase, whereas (±)-1, (±)-3 and (±)-4 showed more stable LC phases down to around room temperature. We found that (±)-1 displays monotropic N and smectic A (SmA) phases; the POM image shows a Schlieren texture typical of the N phase between two exothermic peaks in the cooling run, as shown in Fig. 3a. Under rather a weak peak at 51.4 °C, as shown in Fig. 2a, we observed a fan-shaped texture typical of the SmA phase as a natural texture, as shown in Fig. 3b.24 In addition, we prepared glass sandwich cells, whose inner surfaces of the two glass substrates were coated with CYTOP (AGC Chemicals, Japan) as a homeotropic alignment type aligning agent. No birefringence is displayed where the N and SmA directors orient perpendicular to the substrates; it is called the pseudo-isotropic texture.24 Since the pseudo-isotropic texture was maintained under this homeotropic boundary condition to the temperature range where crystallisation occurs, we conclude that this supercooled smectic phase is an SmA phase. In the case of (±)-2, only a monotropic N phase was observed. We found that the monotropic N phase exists in the narrow temperature range between 71.4 and 68.2 °C, as shown in Fig. 3b. The Schlieren texture was observed at 69 °C, whereas this supercooled N phase was unstable and coexisted with a crystalline (Cr) phase, as shown in Fig. 3c. We found that (±)-3 showed the enantiotropic N and monotropic SmA phases; the Schlieren texture was observed in both heating and cooling processes, as shown in Fig. 3d, while the fan-shaped texture was observed only in the cooling process under a weak exothermic peak (65.3 °C), as shown in Fig. 3e. It displayed a pseudo-isotropic texture under the homeotropic boundary condition until a Cr phase appears similar to (±)-1.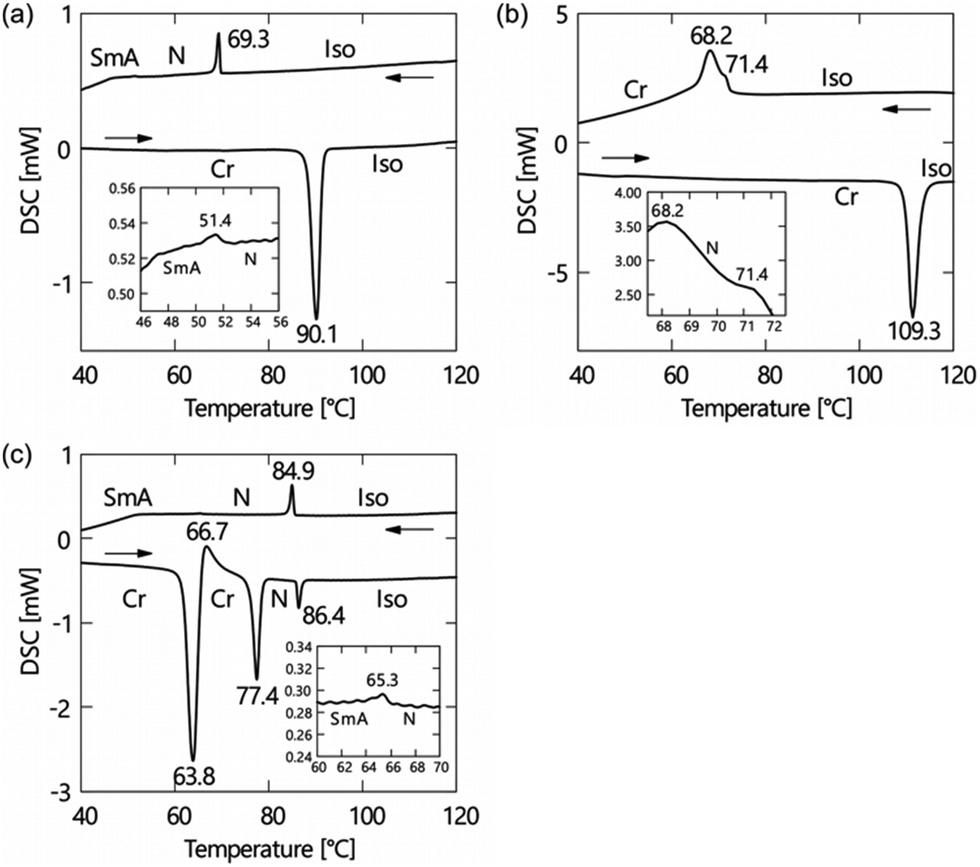 | ||
| Fig. 2 DSC curves of (a) (±)-1, (b) (±)-2 and (c) (±)-3. A standard notation gives the transition temperatures between the crystalline (Cr), smectic A (SmA), nematic (N) and isotropic (Iso) phases. | ||
 | ||
| Fig. 3 Polarised optical micrographs of (±)-1–3 in the cooling run. (a) A Schlieren texture for the N phase of (±)-1 at 65 °C, (b) a fan-shaped texture for the SmA phase of (±)-1 at 45 °C and (c) a Schlieren texture for the N phase (centre), an isotropic phase (left) and a Cr phase (right) of (±)-2 at 69 °C. (d) A Schlieren texture for the N phase of (±)-3 at 80 °C and (e) a fan-shaped texture for the SmA phase of (±)-3 at 55 °C. Scale bars correspond to 100 μm. | ||
The comparison of phase transition behaviours is shown in Fig. 4, and the previously reported NR-LC compound (±)-4 is quoted to discuss the substituent effects.4 We can obtain three kinds of information useful for the molecular design of NR-LC compounds: (a) the trifluoromethyl group tends to induce a SmA phase, (b) the cyclohexane ring promotes crystallisation and (c) the ether oxygen atom stabilises LC phases dramatically.
 | ||
| Fig. 4 Phase transition behaviors of compounds (±)-1–4. DSC analyses determined transition temperatures at a scanning rate of 5 °C min−1 upon the heating and cooling run. | ||
However, (±)-4 with terminal alkoxy groups shows only an N phase upon both heating and cooling processes, and (±)-1 and (±)-3 with the trifluoromethyl group as one of the terminal units show the SmA phase in the cooling process. Generally, the longer the terminal chains become, the more the SmA phase stabilises.25 To compare their molecular lengths, we carried out molecular modelling by DFT calculations at the B3LYP/6-31G** level using the Gaussian 09 program package.26 The results show that the longest radii of the molecular ellipsoids of (±)-1–3 are smaller than that of (±)-4, as shown in Table 2. These results indicate that the trifluoromethyl group is smaller than the octyloxy group, drastically stabilising the SmA phase. We guess that fluorine atoms induce the micro-phase separation structure because of their insolubility in hydrocarbon groups, favourable to layer-structured SmA phases.27
|
|
|||
|---|---|---|---|
| Compound | Long radius [nm] | Short radius [nm] | Aspect ratio [−] |
| 1 | 3.6899 | 0.5645 | 6.537 |
| 2 | 3.7117 | 0.5992 | 6.195 |
| 3 | 3.7889 | 0.5046 | 7.509 |
| 4 | 4.4505 | 0.5012 | 8.879 |
Compound (±)-2 containing the cyclohexane ring instead of the benzene ring shows about 20 °C higher melting point than that of analogue (±)-1. In addition, the temperature range of the supercooled N phase of (±)-2 is narrower than that of (±)-1. It is due to the difference in the crystallisation behaviours of these; the N phase of (±)-2 crystalises quickly at 69 °C, and (±)-1 maintains the supercooled N phase below 40 °C. Considering the clearing points of (±)-1 and (±)-2 in the cooling process are almost the same, we can conclude that the stability of the N phase is not very different, and the flexible cyclohexane ring stabilises only the Cr phase more strongly than the rigid benzene ring.
Although the structural change between (±)-1 and (±)-3 is the existence or absence of an ether oxygen atom bound to the benzene ring with the trifluoromethyl group at the molecular terminal, their phase transition behaviours are quite different from each other. The N phase of (±)-3 appears even in the heating process, and the N-to-SmA phase transition temperatures of (±)-3 in the cooling process are about 14 °C higher than that of (±)-1. These results indicate that the ether oxygen atom has an important role in the stability of the LC phases of NR compounds. The aspect ratio should be considered the origin of this substituent effect; introducing the oxygen atom increases the aspect ratio needed for stable LC phases. Furthermore, the change of the mobility and orientation of terminal units could influence the stability of LC phases. Additional studies are needed to elucidate these ether oxygen effects.
Microscopic phase transition behaviours
The above analyses indicate that (±)-1 and (±)-3 exhibit N-to-SmA phase transitions. These phase transitions are further characterised by the X-ray diffraction (XRD) measurement upon the cooling process (Fig. 5). The XRD measurements of compound (±)-3 were carried out in the temperature range of 70–90 °C in the heating process and 80–45 °C in the cooling process. No peak was observed in the N phase during the heating process and between 80 °C and 75 °C during the cooling process (Fig. 5a). Meanwhile, diffuse small angle scattering appeared around 2θ = 3.15 at 75 °C, and it increased in the N phase upon approaching the N-to-SmA phase transition, which is in line with the pretransitional formation and growth of some cybotactic clusters. Each correlation length was estimated as a reciprocal of the half-width at half maximum (HWHM) of the diffuse scattering in an XRD pattern in the wavenumber space. The correlation lengths are omnidirectional averages. The correlation lengths in the N phase are smaller than those in the SmA phase during the cooling process (Fig. 5a). The d-spacing decreased in the N-to-SmA phase transition, though the correlation length steeply increased in the N-to-SmA phase transition, as shown in Fig. 5. Besides, the correlation length decrease is probably due to the peak disappearing in the crystallization process. These results indicate that the layer order pretransitionally appears like an N-to-Ncyb phase transition.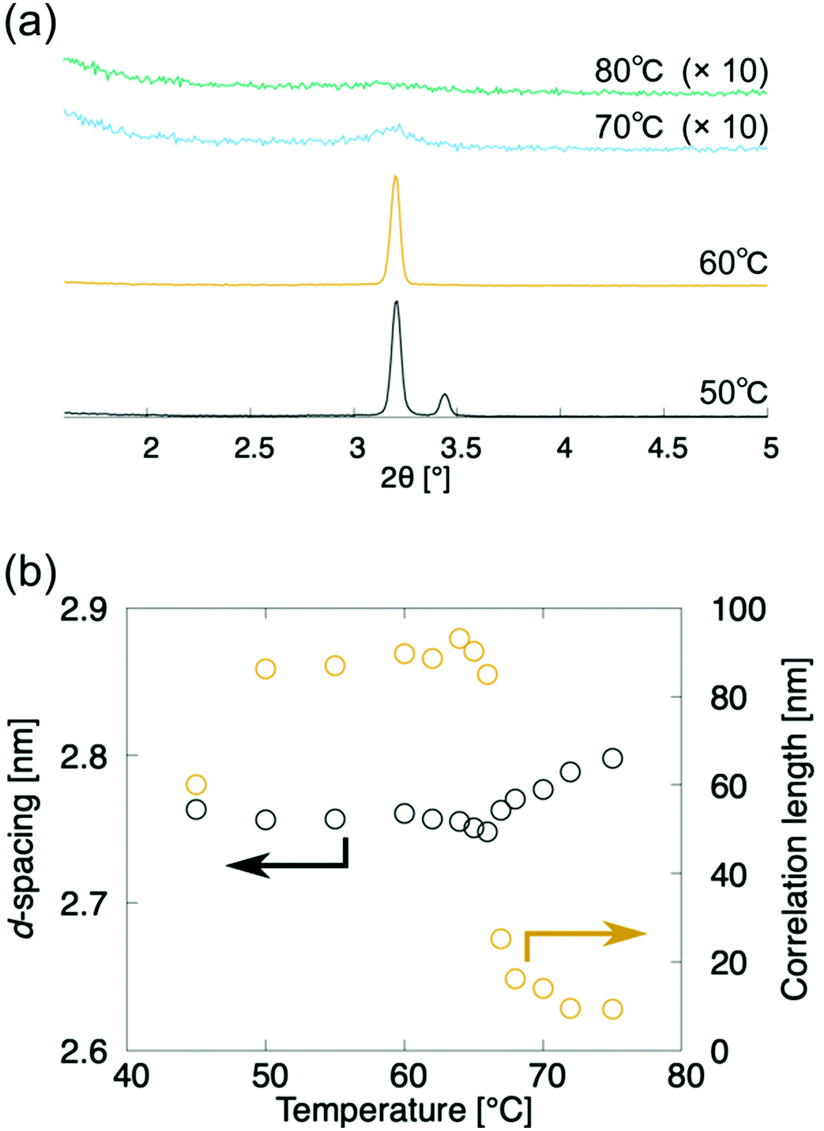 | ||
| Fig. 5 X-Ray diffractometry of (±)-3 upon the cooling run. Black and orange circles denote the d-spacing and the correlation length of the layer structure, respectively. | ||
To track the temperature-dependence of the orientational direction and order of the molecular cores at the appearance of the layer order, we estimated the temperature dependence of g-values from the EPR spectra of compound (±)-3 during the cooling process (Fig. 6a).8,12 The g-values continuously increase to around 75 °C, as shown in Fig. 6b, where the layered structure starts to appear, whereas the g-values steeply increase around the transition to the SmA phase at 65 °C. Considering that the POM texture did not change at 75 °C, the orientational order of molecular cores gradually increased like the macroscopic orientational order. In addition, although the molecular domains orientate almost randomly in the N and Ncyb phases, the molecular domains whose long axis is perpendicular to the magnetic field gradually increase due to the increase of the orientational order. Meanwhile, the natural homeotropic anchoring effect on the glass surface aligns the molecular long axis perpendicular to the magnetic field in the SmA phase.8 Although the XRD patterns and g-values reflect the direction of the nematic director and the orientational order, we do not know if the molecules belonging to the cybotactic clusters and the rest of the region are swapped or not.
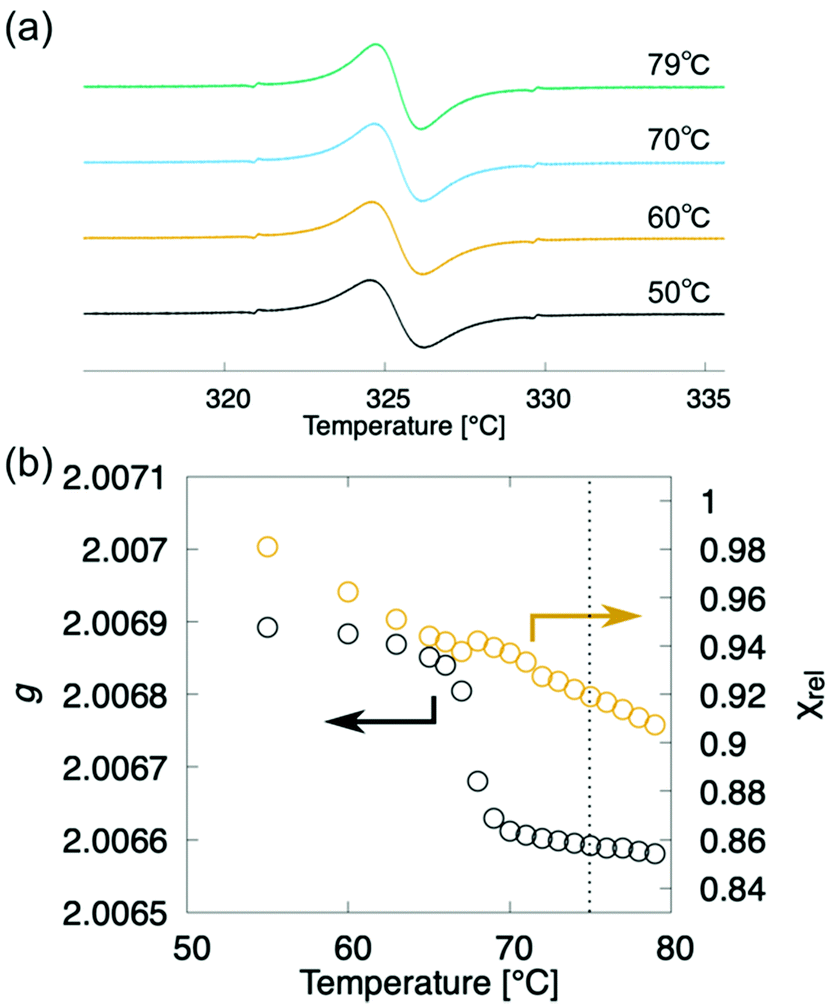 | ||
| Fig. 6 EPR spectroscopy of (±)-3 upon the cooling run. Black and orange circles denote the g-value and χrel, respectively. Vertical dotted line denotes the N-to-Ncyb phase transition point. | ||
We focused on the magnetic susceptibility of LC-NRs to discuss the clustering behaviour in the Ncyb phase; it reflects the molecular mobility and inhomogeneity of intermolecular interactions.28 We estimated the temperature-dependence of relative magnetic susceptibility χrel during the cooling process from the EPR spectra of compound (±)-3. As the temperature decreased, χrel gradually increased, as shown in Fig. 6b. It looks like a natural behaviour for paramagnetic materials (Curie–Weiss law). Although there was no discontinuity in χrel around the N-to-Ncyb phase transition, χrel changes a little discontinuously in the Ncyb-to-SmA phase transition like previously reported compounds.11,29 In general, a certain molecule magnetically interacts with the other molecules at a certain moment. For solid phases, the magnetic susceptibility reflects a spatial heterogeneity. In the liquid crystalline phase, the exchange interacting partner molecules are replaced from moment to moment (∼0.1 ns), and the memory of the interaction remains in the molecules (∼1 μs).28 The exchange interactions experimentally averaged out to give the continuous change in χrel around the N-to-Ncyb phase transition. It indicates that the relaxation time of the memory is many orders of magnitude longer than that of the molecules staying in the clusters. These results indicate that the cybotactic clusters grow gradually, where molecules move in and out, as shown in Fig. 7. In addition, the discontinuity in χrel at the Ncyb-to-SmA phase transition is likely attributed to the molecular reorientation.11
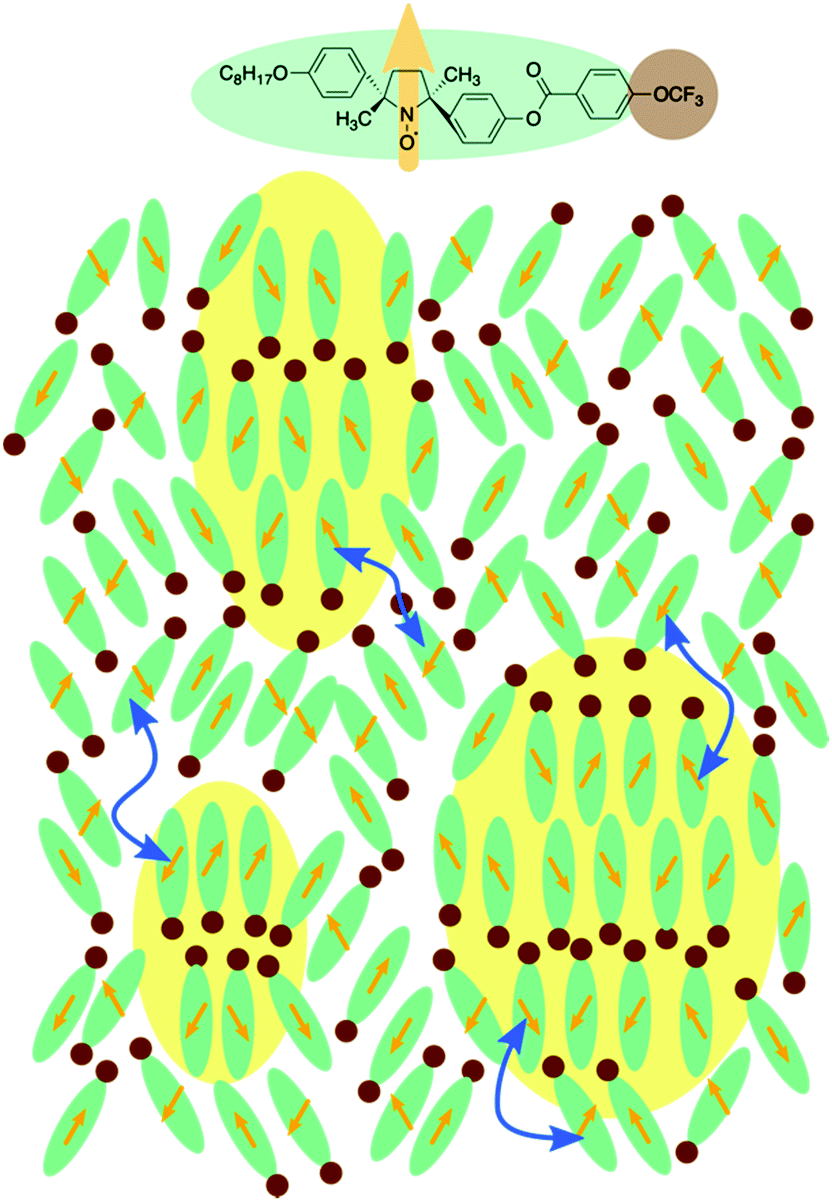 | ||
| Fig. 7 Molecular orientations in and out of the cybotactic clusters. Molecules of (±)-3 have the trifluoromethyl group (brown circles) and electron spins of nitroxide radical moieties (orange arrows). The molecules move into and out of the yellow-colored cybotactic clusters. Blue double-headed arrows denote the molecular exchange inside and outside the cybotactic clusters. | ||
Experimental
Instrumentation
Mass spectra were recorded using a JEOL JMS-700. IR spectra were recorded with a SHIMADZU IRAffinity-1 using the KBr-pellet technique. Elemental analyses (CHN) were carried out using a PerkinElmer 2400II. The g-values and hyperfine coupling constants (aN) were determined by the EPR spectra of tetrahydrofuran (THF) solution at room temperature. EPR spectra were recorded using a JEOL JES-FE1XG in a magnetic field of about 0.33 T (X-band). Magnetization was recorded using a QUANTUM DESIGN MPMS-3. Phase transition temperatures were determined by differential scanning calorimetry (SHIMADZU DSC-60), X-ray diffraction measurements, and polarized optical microscopy (Olympus BX51). A hot stage (Japan High Tech 10083) was used as the temperature control unit for microscopy. For variable temperature X-ray diffraction measurements, the data collections were performed using a Rigaku RINT2200/PC-LH diffractometer using Cu-Kα radiation with 0.15418 nm. Unless otherwise noted, solvents and reagents were of reagent grade and used without further purification. THF that was used for EPR spectroscopy was distilled from sodium/benzophenone ketyl under nitrogen.Materials and synthesis
Dichloromethane (50 mL) was charged with phenol (0.3 mmol), carboxylic acid (0.33 mmol), 1-(3-dimethylaminopropyl)-3-ethylcarbodiimide hydrochloride (EDC·HCl, 0.45 mmol), and 4-(dimethylamino)pyridine (DMAP, 0.09 mmol). After the mixture was stirred for 12 h at room temperature, the reaction solution was added, saturated with aqueous NaHCO3 (50 mL), and extracted with diethyl ether (50 mL × 2). The extract was dried over MgSO4 and evaporated. The residue was purified by flash column chromatography on a silica gel (hexane/diethyl ether = 8/2 for 1 and 3, and hexane/ethyl acetate = 8/2 for 2) and recrystallized from hexane to afford ester (±)-1–3 as yellow crystals (yield of 60–70% from NR–phenol, Scheme 1).(±)-1: IR ν (KBr): 2930, 2859, 1740, 1609, 1508, 1263, 1202, 1074, 1015, 829 cm−1; HRMS: calcd for C34H39F3NO4 [M]+: 582.2831, found 582.2828; anal. calcd for C34H39F3NO4: C, 70.08; H, 6.75; N, 2.40; found: C, 70.08; H, 6.76; N, 2.41.
(±)-2: IR ν (KBr): 2930, 2870, 1749, 1609, 1508, 1339, 1206, 1086, 1003, 829 cm−1; HRMS: calcd for C34H45F3NO4 [M]+: 588.3301, found 588.3303; anal. calcd for C34H45F3NO4: C, 69.36; H, 7.70; N, 2.38; found: C, 69.31; H, 7.87; N, 2.37.
(±)-3: IR ν (KBr): 2930, 2860, 1740, 1508, 1260, 1204, 1171, 1072, 829 cm−1; HRMS: calcd for C34H39F3NO5 [M]+: 598.2780, found 598.2789; anal. calcd for C34H39F3NO5: C, 68.21; H, 6.57; N, 2.34; found: C, 68.29; H, 6.44; N, 2.25.
Conclusions
We synthesised several LC-NRs with a terminal trifluoromethyl group. The trifluoromethyl group probably induces smectic phases, having a layer order. Furthermore, an ether oxygen atom binding the terminal benzene ring especially is likely to stabilise LC phases. One of the new LC-NRs with a trifluoromethoxy group as a terminal group exhibits N and SmA phases in the cooling process. Although the POM observation does not suggest forming a layered structure in the N phase, X-ray diffractometry indicates that the pretransitional layer order starts to appear in the N phase. It seems to be an Ncyb phase. EPR spectroscopy uncovered that the interactions between trifluoromethyl groups induce the orientational order of the mesogen core, and the induced cybotactic clusters grow gradually. It also implied that molecules move into and out of the cybotactic clusters from moment to moment.Author contributions
Yoshiaki Uchida: conceptualisation, investigation, visualisation and writing – original draft. Takuya Akita: methodology, investigation, visualisation, and writing – original draft. Kazuki Hanada: methodology, investigation, and writing – review and editing. Daichi Kiyohara: methodology, investigation, and writing – review and editing. Norikazu Nishiyama: supervision, resources, and writing – review and editing.Conflicts of interest
There are no conflicts to declare.Acknowledgements
The authors appreciate Professor Tsuyoshi Kimura and Mr Hiroki Ueda, Osaka University, for experimental support including measurements of the magnetic susceptibility. The authors extend appreciation to Professor Rui Tamura, Kyoto University, for experimental support, including measurements of X-ray diffraction. This work was supported in part by the Japan Science and Technology Agency (JST) ‘‘Precursory Research for Embryonic Science and Technology (PRESTO)’’ for a project on ‘‘Molecular technology and creation of new function’’, and by the Japan Society for the Promotion of Science (JSPS) KAKENHI (Grant numbers JP17H04896 and JP20K21226). The computations were performed at the Research Center for Computational Science, Okazaki, Japan. T. A. is very grateful to the JSPS Research Fellowships for Young Scientists JP16J05585.Notes and references
- J. W. Goodby, in Handbook of Liquid Crystals, ed. J. W. Goodby, P. J. Collings, T. Kato, C. Tschierske, H. Gleeson, P. Raynes, V. Vill, Wiley-VCH, Weinheim, Germany, 2nd edn, 2014, vol. 1, ch. 1, pp. 1–23 Search PubMed.
- R. Tamura, Y. Uchida and K. Suzuki, in Handbook of Liquid Crystals, ed. J. W. Goodby, P. J. Collings, T. Kato, C. Tschierske, H. Gleeson, P. Raynes, V. Vill, Wiley-VCH, Weinheim, Germany, 2nd edn, 2014, vol. 8, ch. 28, pp. 1–28 Search PubMed.
- M. Hird, Chem. Soc. Rev., 2007, 36, 2070 RSC.
- N. Ikuma, R. Tamura, S. Shimono, N. Kawame, O. Tamada, N. Sakai, J. Yamauchi and Y. Yamamoto, Angew. Chem., Int. Ed., 2004, 43, 3677 CrossRef CAS PubMed.
- B. Balasubramanian, B. Das, R. Skomski, W. Y. Zhang and D. J. Sellmyer, Adv. Mater., 2013, 25, 6090 CrossRef CAS PubMed.
- K. Nakahara, K. Oyaizu and H. Nishide, Chem. Lett., 2011, 40, 222 CrossRef CAS.
- R. Tamura, Y. Uchida and N. Ikuma, J. Mater. Chem., 2008, 18, 2872 RSC.
- Y. Uchida, R. Tamura, N. Ikuma, S. Shimono, J. Yamauchi, Y. Shimbo, H. Takezoe, Y. Aoki and H. Nohira, J. Mater. Chem., 2009, 19, 415 RSC.
- T. Akita, Y. Uchida, S. Nakagami, D. Kiyohara and N. Nishiyama, Crystals, 2015, 5, 206 CrossRef CAS.
- Y. Uchida, N. Ikuma, R. Tamura, S. Shimono, Y. Noda, J. Yamauchi, Y. Aoki and H. Nohira, J. Mater. Chem., 2008, 18, 2950 RSC.
- Y. Uchida, K. Suzuki, R. Tamura, N. Ikuma, S. Shimono, Y. Noda and J. Yamauchi, J. Am. Chem. Soc., 2010, 132, 9746 CrossRef CAS PubMed.
- Y. Uchida, K. Suzuki, R. Tamura, Y. Aoki and H. Nohira, J. Phys. Chem. B, 2013, 117, 3054 CrossRef CAS PubMed.
- K. Suzuki, Y. Uchida, R. Tamura, S. Shimono and J. Yamauchi, J. Mater. Chem., 2012, 22, 6799 RSC.
- T. Akita, D. Kiyohara, T. Yamazaki, Y. Uchida and N. Nishiyama, J. Mater. Chem. C, 2017, 5, 12457 RSC.
- G. W. Stewart and R. M. Morrow, Phys. Rev., 1927, 30, 232 CrossRef CAS; A. de Vries, Mol. Cryst. Liq. Cryst., 1970, 10, 219 CrossRef; H. T. Nguyen, C. Destrade, A.-M. Levelut and J. Malthete, J. Phys., 1986, 47, 553 CrossRef.
- O. Francescangeli and E. T. Samulski, Soft Matter, 2010, 6, 2413 RSC.
- W. Nishiya, Y. Takanishi, J. Yamamoto and A. Yoshizawa, J. Mater. Chem. C, 2014, 2, 3677 RSC.
- Y. Arakawa, Y. Sasaki, K. Igawa and H. Tsuji, New J. Chem., 2017, 41, 6514 RSC.
- S. Nakagami, T. Akita, D. Kiyohara, Y. Uchida, R. Tamura and N. Nishiyama, J. Phys. Chem. B, 2018, 122, 7409 CrossRef CAS PubMed.
- Y. Uchida, K. Suzuki and R. Tamura, J. Phys. Chem. B, 2012, 116, 9791 CrossRef CAS PubMed.
- Y. Uchida, T. Sakaguchi, S. Oki, S. Shimono, J. Park, M. Sugiyama, S. Sato, E. Zaytseva, D. G. Mazhukin and R. Tamura, ChemPlusChem, 2022, 87, e202100352 CAS.
- T. Akita, Y. Uchida and N. Nishiyama, Mol. Cryst. Liq. Cryst., 2015, 613, 174 CrossRef CAS.
- N. Ikuma, R. Tamura, K. Masaki, Y. Uchida, S. Shimono, J. Yamauchi, Y. Aoki and H. Nohira, Ferroelectrics, 2006, 343, 119 CrossRef CAS.
- I. Dierking, Textures of Liquid Crystals, Wiley-VCH, Weinheim, Germany, Revised edition, 2003 Search PubMed.
- J. W. Goodby, E. J. Davis, R. J. Mandle and S. J. Cowling, in Handbook of Liquid Crystals, ed. J. W. Goodby, P. J. Collings, T. Kato, C. Tschierske, H. Gleeson, P. Raynes, V. Vill, Wiley-VCH, Weinheim, Germany, 2nd edn, 2014, vol. 1, ch. 8, pp. 1–30 Search PubMed.
- M. J. Frisch, G. W. Trucks, H. B. Schlegel, G. E. Scuseria, M. A. Robb, J. R. Cheeseman, G. Scalmani, V. Barone, B. Mennucci, G. A. Petersson, H. Nakatsuji, M. Caricato, X. Li, H. P. Hratchian, A. F. Izmaylov, J. Bloino, G. Zheng, J. L. Sonnenberg, M. Hada, M. Ehara, K. Toyota, R. Fukuda, J. Hasegawa, M. Ishida, T. Nakajima, Y. Honda, O. Kitao, H. Nakai, T. Vreven, J. A. Montgomery, Jr., J. E. Peralta, F. Ogliaro, M. Bearpark, J. J. Heyd, E. Brothers, K. N. Kudin, V. N. Staroverov, R. Kobayashi, J. Normand, K. Raghavachari, A. Rendell, J. C. Burant, S. S. Iyengar, J. Tomasi, M. Cossi, N. Rega, J. M. Millam, M. Klene, J. E. Knox, J. B. Cross, V. Bakken, C. Adamo, J. Jaramillo, R. Gomperts, R. E. Stratmann, O. Yazyev, A. J. Austin, R. Cammi, C. Pomelli, J. W. Ochterski, R. L. Martin, K. Morokuma, V. G. Zakrzewski, G. A. Voth, P. Salvador, J. J. Dannenberg, S. Dapprich, A. D. Daniels, O. Farkas, J. B. Foresman, J. V. Ortiz, J. Cioslowski and D. J. Fox, Gaussian 09, Revision D.01, Gaussian, Inc., Wallingford CT, 2009 Search PubMed.
- S. Misaki, S. Takamatsu, M. Suefuji, T. Mitote and M. Matsumura, Mol. Cryst. Liq. Cryst., 1981, 66, 123 CrossRef CAS; K. Kimoto, M. Duan, H. Okamoto, V. F. Petrov, K. Hori and S. Takenaka, Mol. Cryst. Liq. Cryst., 2001, 364, 733 CrossRef; P. Kirsch, Modern Fluoroorganic Chemistry: Synthesis, Reactivity, Applications, Wiley-VCH, Weinheim, Germany, 1st edn, 2004 Search PubMed.
- Y. Uchida, G. Watanabe, T. Akita and N. Nishiyama, J. Phys. Chem. B, 2020, 124, 6175 CrossRef CAS PubMed.
- K. Suzuki, Y. Uchida, R. Tamura, Y. Noda, N. Ikuma, S. Shimono and J. Yamauchi, Soft Matter, 2013, 9, 4687 RSC.
| This journal is © The Royal Society of Chemistry 2022 |