
ATR-FTIR spectroscopy shows changes in ovarian cancer cells after incubation with novel organoamidoplatinum(II) complexes†
Khansa
Al-Jorani
a,
Anja
Rüther
a,
Rukshani
Haputhanthri
 a,
Glen B.
Deacon
b,
Hsiu Lin
Li
b,
Carleen
Cullinane
cd and
Bayden R.
Wood
*a
a,
Glen B.
Deacon
b,
Hsiu Lin
Li
b,
Carleen
Cullinane
cd and
Bayden R.
Wood
*a
aCentre for Biospectroscopy and School of Chemistry, Monash University, Clayton, Victoria 3800, Australia. E-mail: Bayden.Wood@monash.edu; Tel: +61-399-055-721
bSchool of Chemistry, Monash University, Clayton, Victoria 3800, Australia
cThe Sir Peter MacCallum Department of Oncology Department, Melbourne, Australia
dResearch Division, Peter MacCallum Cancer Centre, Melbourne, Victoria, Australia
First published on 5th November 2018
Abstract
Attenuated Total Reflection Fourier Transform Infrared (ATR-FT-IR) spectroscopy has been applied to compare the effect of the new organoamidoplatinum(II) complexes [Pt{NH(p-HC6F4)CH2CH2N(p-HC6F4)}(py)(O2CR)] (R = C6F4 or 2,4,6-Me3C6H2) with cisplatin on cells from one cisplatin-sensitive ovarian cancer cell line (A2780) and one cisplatin-resistant ovarian cancer cell line (A2780R). After incubation of the cells with cisplatin, 1 and 2 for 48 hours, distinct changes were found in the ATR-FT-IR spectra. Comparison of the second derivative spectra suggests that 1 and 2 induce similar chemical changes in both cell lines, A2780 and A2780R, while cisplatin had a slight effect on A2780 and A2780R cells. Furthermore, drugs 1 and 2 result in changes to the phosphodiester and polysaccharide bands in the spectra. This work shows how ATR-FT-IR can be applied to monitor the effects of organoamidoplatinum(II) complexes on cisplatin-sensitive and cisplatin-resistant cell lines providing potential information on how drugs affect the cellular metabolism.
Introduction
Ovarian cancer ranks as the most common cancer causing death amongst women and is the most common cancer of the female reproductive tract,1 and early detection is not readily achieved.2,3 Chemotherapy is one of the major treatments for ovarian cancer. In order to improve the efficacy of chemotherapy, it is necessary to understand the mechanism of action of the chemotherapeutic drugs and how they interact with biological molecules. Such knowledge could further contribute to understanding drug resistance.4,5 Platinum-based drugs have a major role in chemotherapy.6,7 Different platinum-based complexes have different effects on each type of tumour due to the different sensitivity of each cancer cell type and differences in their proliferation rate.8Platinum coordination complexes are active as anticancer drugs due to their ligand-exchange kinetics,9 which lead to their capacity to disrupt the replication of cancer cells.10,11 The discovery of the biological activity of cisplatin (cis-diaminedichloridoplatinum(II)) by Rosenberg in 1965 resulted from the ability of cisplatin to inhibit cellular division.12 From that time, it has become the major treatment for different types of solid tumours such as testicular, ovarian, bladder, head and neck cancers.13–15 The inspiration of developing new platinum drugs partly resulted from the great efficacy of cisplatin on testicular cancer where the cure rates reached >80%.16 The challenge is to ensure a similar success rate for other cancers but with reduced side effects and without the development of resistance.
Despite the fact that platinum anticancer drugs are successful in cancer therapy, they have some dose limiting side effects such as nephrotoxicity, neurotoxicity, ototoxicity, alopecia and emetogenesis.17–20 Another drawback is the drug resistance of tumours. This occurs for many reasons such as an increase in drug efflux from the cell, the activation of detoxification systems, an increase in repairing DNA damage, a loss of tumour suppressor function and altered gene expression.21,22 Thus, huge efforts have been made to improve the function of platinum drugs by reducing side effects and resistance.23 Resistance in ovarian cancer is broad and tumours can become refractory to alternative antitumour drugs.24,25 One focus in the search for new chemotherapeutic drugs has been on “rule breakers”.25,26 These compounds do not conform to the structure/activity rules to which current clinical platinum drugs conform.27,28
These offer prospect of a different mode of action, for example through the delivery mechanism, through different behaviour towards competing targets, and a different interaction with DNA.29,30
Polyfluorophenyl substituted organoamidoplatinum(II) complexes [Pt{N(R)CH2}2(py)2] (R = polyfluorophenyl; py = pyridine) are active against a number of tumours in vitro and in vivo,31,32 and have different uptake mechanism from cisplatin and it has recently been shown that the initial target is adenine in DNA.
The compounds are sterically hindered and air and moisture stable. The stability is due to the electron-withdrawing nature of the polyfluorophenyl group. The crystal structures of these complexes reveal that the stereochemistry around the amide nitrogens moves towards trigonal rather than tetrahedral and the bond between the nitrogen and the ipso carbon of the polyfluorophenyl ring is shorter than the single bond between the same nitrogen amide and the carbon of a methylene group.33 This bond is similar in length to an aromatic N–C bond, indicating the delocalization of negative charge away from the amido nitrogen thereby stabilizing the complex towards hydrolysis.33 The organoamidoplatinum(II) compounds are unusual for active species in having four nitrogen donor atoms, and are “rule breakers” because of the absence of H substituents on any N donor atom.31,32 We have now begun derivatisation of these complexes in an attempt to understand and extend their activity. Thus, the lead drug, [Pt{N(p-HC6F4)CH2}2(py)2] (Pt103) reacts with pentafluorobenzoic acid and 2,4,6-trimethylbenzoic acid by a photo-induced acidolysis and substitution to afford the complexes [[N,N′-bis(2,3,5,6-tetrafluorophenyl)ethane-1,2-diaminato(1-)](pentafluorobenzoato)(pyridine)platinum(II)] (1) and [[N,N′-bis(2,3,5,6-tetrafluorophenyl)ethane-1,2-diaminato(1-)](trimethylbenzoato)(pyridine)platinum(II)] (2) (Fig. 1).34 The compounds now have an NH functionality unlike Pt103 but the amine ligands (py and –CH2NHR) are trans to each other in contradiction to the usual structure/activity rules.27,28,32,35
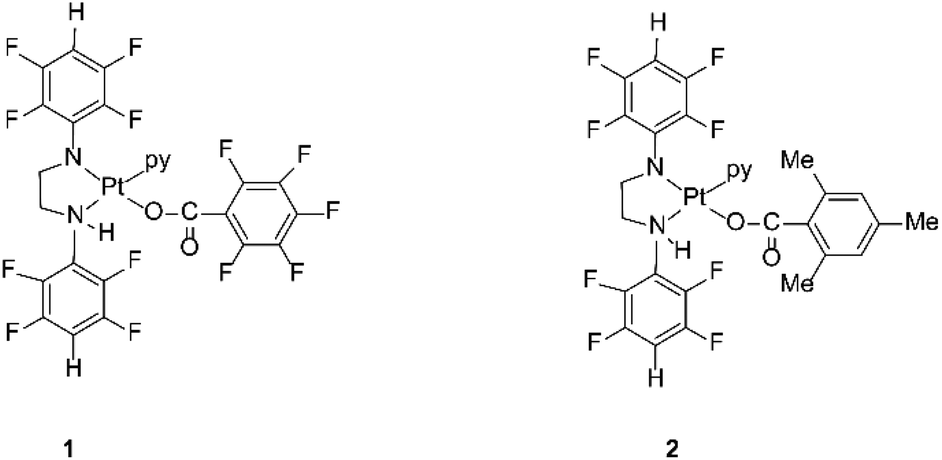 | ||
| Fig. 1 Platinum(II) complexes 1 and 2. | ||
Spectroscopic methods can be used to investigate the interaction between platinum complexes and cancer cells and to differentiate between drug sensitive and resistant cancer cell lines in terms of drug accumulation and drug efflux.36
Infrared (IR) spectroscopy offers a promising means to determine cancer biomarkers and to monitor the effect of drug interaction at the cellular level. The application of Fourier Transform (FT-IR) spectroscopy to study drug–cell interactions was recently reviewed.37 The νasPO2− and νsPO2− stretching vibrations occurring at ca. 1125 & 1085 cm−1 respectively from the O![[double bond, length as m-dash]](https://www.rsc.org/images/entities/char_e001.gif) PO− linkages of the polynucleotide chains in polymers and ribonucleic acids have been shown to be sensitive to DNA conformation, drug interaction and apoptosis.38–41 FT-IR spectroscopy has also been applied to discriminate between benign and malignant cells. It was found that the phosphodiester bands are generally more intense in the malignant cells.42 The identification and assignment of major spectral features by functional group analysis is especially helpful for the qualitative analysis of pure organic molecules since the FT-IR spectrum of every molecule is a unique fingerprint with bands from proteins, nucleic acids, and sugars. Attenuated Total Reflection (ATR) FT-IR spectroscopy can be used to identify characteristic vibrational modes of the cells that are specific to molecular bonds, functional groups, and intra- and intermolecular interactions such as hydrogen bonding, cation–π interactions, π–π interactions, DNA base stacking and dispersion forces.37,43 In this study, we applied ATR-FT-IR spectroscopy to investigate the effect of compounds 1 and 2 in comparison to cisplatin on the ovarian cell line A2780, which is sensitive to cisplatin and on the A2780R cell line, which is resistant to cisplatin. Using Principal Component Analysis (PCA) we compare the effects of each drug on the resistant and sensitive cell lines. This study provides a methodological approach for the application of ATR-FT-IR spectroscopy to monitor the effects of drug resistance in terms of changes in the cellular biochemistry.
PO− linkages of the polynucleotide chains in polymers and ribonucleic acids have been shown to be sensitive to DNA conformation, drug interaction and apoptosis.38–41 FT-IR spectroscopy has also been applied to discriminate between benign and malignant cells. It was found that the phosphodiester bands are generally more intense in the malignant cells.42 The identification and assignment of major spectral features by functional group analysis is especially helpful for the qualitative analysis of pure organic molecules since the FT-IR spectrum of every molecule is a unique fingerprint with bands from proteins, nucleic acids, and sugars. Attenuated Total Reflection (ATR) FT-IR spectroscopy can be used to identify characteristic vibrational modes of the cells that are specific to molecular bonds, functional groups, and intra- and intermolecular interactions such as hydrogen bonding, cation–π interactions, π–π interactions, DNA base stacking and dispersion forces.37,43 In this study, we applied ATR-FT-IR spectroscopy to investigate the effect of compounds 1 and 2 in comparison to cisplatin on the ovarian cell line A2780, which is sensitive to cisplatin and on the A2780R cell line, which is resistant to cisplatin. Using Principal Component Analysis (PCA) we compare the effects of each drug on the resistant and sensitive cell lines. This study provides a methodological approach for the application of ATR-FT-IR spectroscopy to monitor the effects of drug resistance in terms of changes in the cellular biochemistry.
Experimental
Materials
A2780, A2780R and SKOV-3 ovarian cancer and L1210 and 1210/DDP mouse leukaemia cell lines were obtained from the Peter MacCallum Cancer Centre (305 Grattan St, Melbourne VIC 3000). Cells were seeded using RPMI 1640 medium with 10% foetal bovine serum (Sigma Aldrich, Sigma St Louis, MO, USA) and incubated at 37 °C and 5% CO2. Cisplatin was supplied by the Institute of Drug Technology, Victoria, Australia. The synthesis and characterization of the platinum complexes 1 and 2 have recently been reported.34Solutions of platinum complexes
The stock solutions were prepared by dissolving each compound (1 and 2) in a water acetone mixture (10%) to concentrations of 6 mM, 0.6 mM and 0.06 mM. Stock solutions were kept in the dark. Solutions of cisplatin were prepared in saline to obtain the concentrations 5 mM, 0.5 mM and 0.05 mM. The control samples were prepared by adding 34 μL of acetone and 40 μL of saline separately to 4 mL of RPMI medium which is already supplemented with 10% of FBS.Cell culture
A2780 and A2780R ovarian cancer cell lines were cultivated using RPMI 1640 medium (Sigma Aldrich) with 10% foetal bovine serum, 1% L-glutamine (Gibco) and 1% penicillin–streptomycin (Sigma Aldrich), under a humidified 5% CO2 atmosphere at 37 °C.IC50 measurements
IC50 testing against leukaemia L1210 and L1210/DDP31 and SKOV-3 ovarian cell lines was based on an established method.44 The IC50 experiments on A2780 and A2780R cell lines were performed using a Sulforhodamine B (SRB) assay.Preparation of samples for IR measurements
For the IR measurements, 34 μL of 1 & 2 concentration was added to 4 mL RPMI medium. For cisplatin, 40 μL was added to 4 mL RPMI. Cells were seeded for 48 h before treatment with the drugs. After addition of the drug solution, they were incubated again for 48 h before fixation. Cells were fixed using a methanol![[thin space (1/6-em)]](https://www.rsc.org/images/entities/char_2009.gif) :acetic acid (3:1) fixative. The fixative solution was freshly prepared. Cells were trypsinyzed and washed 3 times in the fixative solution. The cell suspension was centrifuged in a 15 mL Falcon tube (1200 rpm) in fixative and the supernatant discarded. The fixed cells were kept at 4 °C prior to ATR-FT-IR analysis.
:acetic acid (3:1) fixative. The fixative solution was freshly prepared. Cells were trypsinyzed and washed 3 times in the fixative solution. The cell suspension was centrifuged in a 15 mL Falcon tube (1200 rpm) in fixative and the supernatant discarded. The fixed cells were kept at 4 °C prior to ATR-FT-IR analysis.
Instrumentation
ATR-FT-IR spectra of drugs and cells were recorded using a Golden Gate single bounce diamond micro-ATR accessory coupled to a Bruker IFS Equinox FT-IR system (Bruker Optics Pty. Ltd, Billerica, MA, USA) with a mercury cadmium telluride detector. FT-IR spectra were processed using Bruker OPUS software, version 6.0 (Bruker Optics Pty. Ltd). The resolution was 8 cm−1 and a zero-filling factor of 2 was chosen. 50 interferograms were co-added for each spectrum. The spectra were corrected for wavenumber dependent penetration depth using the Extended ATR correction in OPUS.Data pre-processing
All spectra were pre-processed using the PLS toolbox in MATLAB (MathWorks, Natick, MA). For PCA the second derivatives were calculated using the Savitzky–Golay algorithm with 9 smoothing points followed by standard normal variate (SNV) and mean centring.Data processing
PCA (PLS toolbox in MATLAB) was applied to the second derivative spectra in the region of 800 to 1300 cm−1. Validation was performed using the leave-out-one cross-validation method.Results and discussion
In conjunction with the primary study of the interaction of 1 and 2 with cells by infrared spectroscopy, a preliminary evaluation of their in vitro anti-tumour activity has been carried out.IC50 values for compounds 1, 2 and cisplatin against L1210, L1210/DDP, and SKOV-3 cell lines
The activity of these two drugs 1 and 2 was tested by determination of IC50 values against L1210 (cisplatin sensitive) and L1210/DDP (cisplatin resistant) and SKOV-3 cell lines and compared with the behaviour of cisplatin (Table 1). The results show that both 1 and 2 are active in vitro but there is a big difference in activity between the two drugs when using SKOV-3 cells. The difference is smaller when the L1210 and L1210/DDP cell lines were tested. This shows that different cell lines react differently to the same drug. The activity of 1 and 2 is markedly greater than cisplatin in the cisplatin resistant cell line (L1210/DDP) indicating that resistance does not extend to 1 and 2. Against SKOV-3, 1 has comparable activity to cisplatin, whereas 2 is 10 fold more active, a surprising differentiation on change of carboxylate group.| Compound | IC50 (μM) in L1210 | IC50 (μM) in L1210/DDP | IC50 (μM) in SKOV-3 | Initial solvent for drug |
|---|---|---|---|---|
| 1 | 0.7 | 0.9 | 6.6 | Acetone |
| 2 | 0.4 | 0.3 | 0.7 | Acetone |
| Cisplatin | 0.6 | 6.7 | 6.3 | Saline |
IC50 values for compounds 1, 2 and cisplatin against the A2780 cell lines
The IC50 values of 1 and 2 as well as cisplatin were determined with the A2780 ovarian cancer cell line. The Graph Pad Prism 7 software was used to analyse the dataset and determine the average IC50 values. The IC50 values (Table 2) show that all three drugs are active with only marginal differences, though 1 appears to be the most effective. Overall both 1 and 2 are similarly active against L1210, L1210/DDP, and A2780, but show differences against SKOV-3 ovarian cancer cells where 2 is much more effective. Both drugs are 8 to 10 times more effective than cisplatin against the cisplatin-resistant line L1210/DDP, with a similar differential between 2 and cisplatin against SKOV-3.| Compound | IC50 (μM) in A2780 | Initial solvent for drug |
|---|---|---|
| 1 | 0.2 | 10% water:acetone |
| 2 | 0.3 | 10% water:acetone |
| Cisplatin | 0.5 | Saline |
Spectral characterisation of drugs
The two cell lines (cisplatin-sensitive A2780 and the cisplatin-resistant A2780R cell line) were incubated with 3 different drugs (1, 2 and cisplatin). Fig. 2 shows the raw FT-IR spectra and the second derivative spectra of 1, 2 and cisplatin.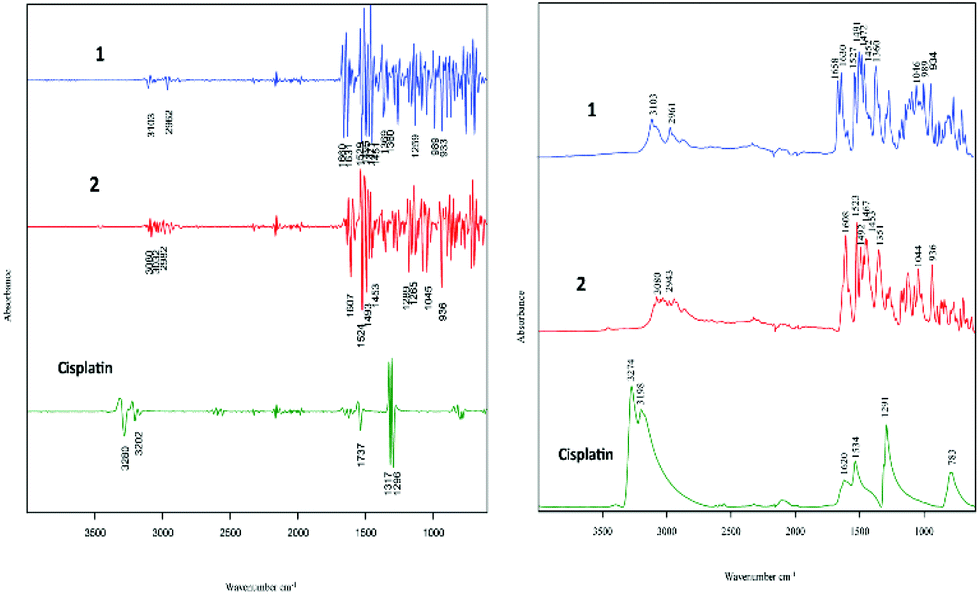 | ||
| Fig. 2 FT-IR raw spectra and second derivative spectra of 1, 2 and cisplatin. | ||
FT-IR spectra of the polyfluorophenyl substituted organoamidoplatinum(II) complexes show ν(C–F) absorptions of the polyfluorophenyl group in the range between 1000–900 cm−1. The absorption of ν(N–H) shown in the region from 3104–3080 cm−1 is not observed in the spectra of Pt103 (not shown) indicating the presence of a protonated amide group (resulting in an amine group) in compounds 1 and 2. In addition, the hydrogen bonding decreases the wavenumber value of the amide group stretching. The bands assigned to carboxylate groups in compounds 1 and 2 were strong in the region from 1660–1610 cm−1 for asymmetric vibration and from 1360–1350 cm−1 for the symmetric vibration. The bands at 1317 and 1296 cm−1 in the cisplatin second derivative spectra are assigned to the symmetric deformation of the NH3 group (δsNH3).
FT-IR spectra of cell lines
To determine the similarities and differences between the A2780 and A2780R cell lines, FT-IR spectra were recorded of the untreated cells. A comparison of the spectra reveals that more dramatic changes induced by drugs occur in the A2780 cell line compared to the A2780R cell line. The changes can be seen in the average spectra for the A2780 cell line and include bands at 1234, 1169, 1080, 1053, 1011, 964, 930 and 887 cm−1 (Fig. 4) mainly associated with nucleic acid vibrations.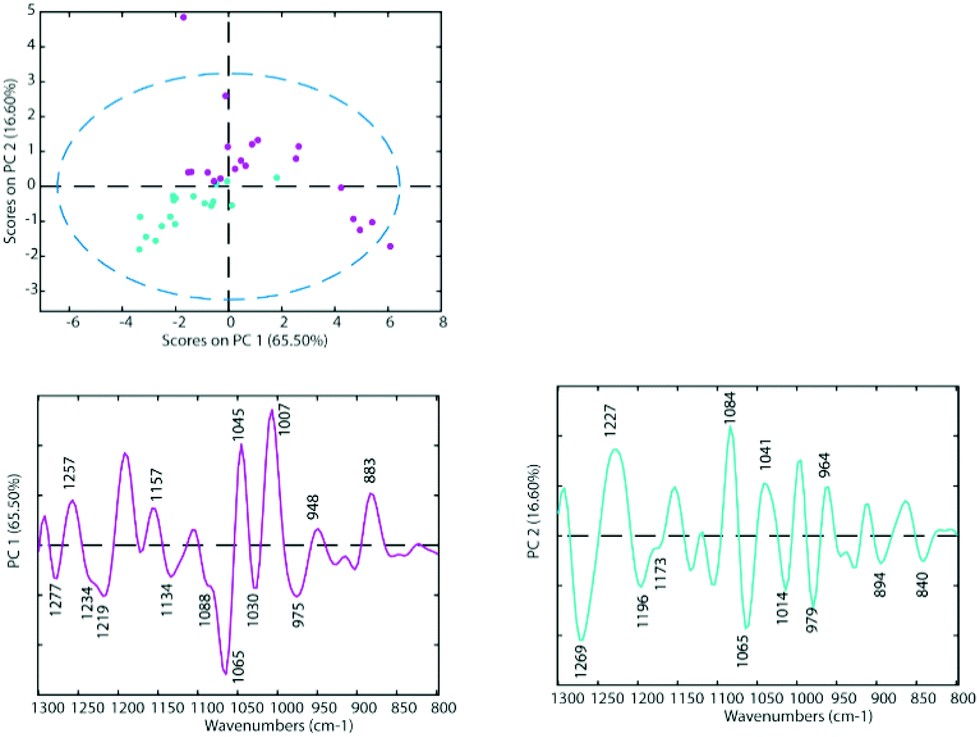 | ||
| Fig. 3 PCA Scores Plot of the untreated cell lines A2780 (blue) and A2780R (purple) and loadings of PC1 (left panel) and PC2 (right panel). | ||
 | ||
| Fig. 4 A: FT-IR absorbance (upper panel) and second derivative (lower panel) spectra of A2780 cells treated with acetone (blue), 1 (dark red), 2 (red), saline (green) and cisplatin (purple). B: FT-IR absorbance (upper panel) and second derivative (lower panel) spectra of A2780R cells treated with acetone (blue), 1 (dark red), 2 (red), saline (green) and cisplatin (purple). | ||
The differences between spectra are small hence PCA was performed on the second derivative spectra in the region from 1300–800 cm−1 where the main nucleic acid and carbohydrate bands reside. PCA reduces the dimensionality of the data set and can be used to study similarities and differences in the spectra. The Score Plots show the clusters in the PCA while the Loading Plots show the variables that are responsible for each PC as a function of the wavenumber. For PC1 the negative loadings are associated with positive scores and the positive loadings are associated with negative score values because second derivative spectra were used in the PCA model. For PC2 the negative loadings are associated with negative scores and the positive loadings associated with the positive scores. Fig. 3 shows the PCA Scores and Loading Plots from PCA on second derivative spectra of A2780 and A2780R. Each spectrum is represented by a Score point in the PCA PC1 versus PC2 Scores Plot. The spectra were collected from 3 cultures of cells with 5 to 7 technical replicates acquired for each culture.
Some separation is visible in the Scores Plot, mostly along PC2, which indicates that the macromolecular chemistry is quite different between A2780 and A2780R cell lines. However, PC1 shows more variance for cells from the A2780R cell line. The A2780R cell line is derived or isolated from A2780 cells after treatment with cisplatin. It was found that resistant cells are able to alter the metabolism of saccharides in order to form colonies. Strong negative PC1 loadings observed at 1277, 1234, 1219, 1134, 1088, 1065, 1030 and 975 cm−1 associated with mainly nucleic acid bands are probably indicative of cells in different states of division. Strong positive PC1 loadings are observed at 1257, 1157, 1045, 1007, 948 and 883 cm−1, which are more characteristic of C–O stretching vibrations of carbohydrates and indicative of metabolic differences between the cells. The separation of resistant and sensitive cell lines occurs along PC2. Strong PC2 positive loadings at 1227, 1084, 1041 and 964 cm−1 are mainly associated with nucleic acid modes and are associated with the A2780 sensitive cell line. The PC2 negative loadings are associated with the A2780R resistant cell line and show strong loadings for bands at 1269, 1196, 1065, 1014 and 979 cm−1. The 1269 cm−1 band is difficult to assign, while the other bands are tentatively assigned to C–O stretching vibrations from polysaccharides.
FT-IR spectra of cell lines inoculated with cisplatin, 1 and 2
For each drug treatment, three concentrations were prepared: 0.5, 5 and 50 μM. However, only concentrations of 5 μM and 50 μM of 1 and 2 seemed show an effect on the cells, and no effect was noticed using 0.5 μM. Treatment with 5 μM 1 and 2 showed an effect but it was weak and hard to interpret, therefore only data from the treatment with 50 μM 1 and 2 is shown in this study. Only a concentration of 50 μm cisplatin had an effect on the tested cells. Both the A2780 and the A2780R ovarian cell lines were treated with each drug. Three sets of replicates were prepared for each experiment. Each replicate comprised of 30 spectra, which were averaged for each drug concentration. These were compared to the untreated control cells. Fig. 4 (upper panels) shows the FT-IR absorbance spectra of the A2780 (cisplatin sensitive) and A2780R (cisplatin resistant) cell lines, untreated (blue), treated with 50 μM 1 (green), with 50 μM 2 (red) and with 50 μM cisplatin in the spectral region from 1300 to 800 cm−1. The major bands are assigned in Table 3 and the changes on treatment with drugs are summarised in Table 4.| Band position (cm−1) | |
|---|---|
| 1234 | ν as(PO2) overlapping of proteins and nucleic acids |
| 1211–1207 | ν as(PO2) |
| 1170–1169 | ν as(CO–O–C) and ν(C–O) from glycomaterials and proteins ν(C–O) RNA ribose |
| 1170 | ν as(C–O) in esters |
| 1122, 1121 | ν s(PO2−) in RNA and DNA νs(PO2−)RNA |
| 1053 | ν s(PO2−) in RNA and DNA νs(PO2−)RNA |
| 1011 | ν(C–O) deoxyribose |
| 965, 964 | ν as(PO3−) DNA and RNA ribose, ν(C–C) and ν(C–O) in deoxyribose of DNA tumour cells |
| 930 | N(COP) phosphorylated protein |
| 887 | C–C, C–O deoxyribose |
| 830, 827 | C2′ endo conformation of sugar |
| Symmetric (νs), asymmetric (νas) |
| Band cm−1 | 2 | 1 | Cisplatin | |||
|---|---|---|---|---|---|---|
| A2780 | A2780R | A2780 | A2780R | A2780 | A2780R | |
| 1234 | Red shift | Red shift | Red shift | Red shift | Red shift | Red shift |
| 1211 | Disappear | Disappear | Disappear | Disappear | Disappear | Disappear |
| 1170 | More intense | More intense | More intense | More intense | More intense | More intense |
| 1121 | More intense | No change | More intense | No change | More intense | No change |
| 1052 | Red shift | Red shift | Red shift | Red shift | Less intense | Less intense |
| 1009 | Red shift | More intense | Red shift | More intense | Less intense | More intense |
| 964 | Less intense | More intense | Less intense | More intense | Less intense | Less intense |
| 931 | No change | Blue shift and less intense | No change | Blue shift and less intense | More intense | No change |
| 885 | Less intense | Less intense | Less intense | Less intense | More intense | No change |
| 830 | Red shift | Red shift | Red shift | Red shift | No change | Red shift |
The assignment of FT-IR bands in biological samples is generally challenging due to the complex biochemical composition of cells including e.g. proteins, lipids and carbohydrates producing many overlapping bands in the FT-IR spectra. By calculating the second derivative, hidden spectral features can be resolved (Fig. 4, lower panels). Here, the A2780 cells treated with 1 and 2 show a blue shift in the bands at 1234, 1053, 1011, 930, 887 and 829 cm−1, a red shift in the bands at 1170 cm−1 and a decrease in intensity of the 964 cm−1 band. Bands at 1230, 1052 and 964 cm−1 are assigned to asymmetric and symmetric phosphodiester group vibrations of nucleic acids. Changes in these bands indicate DNA conformational changes possibly from denaturation and would be expected in response to the drug interacting with DNA. There is an increase of intensity in all the spectral features from drug-treated cells except for bands at 1230, 964, 884 and 827 cm−1. The treated A2780R cells show a blue shift of the bands at 1234, 1053, 1011, 964, 887 and 829 cm−1, while the bands 1170 and 930 cm−1 show a red shift. There is an increase in the absorbance of bands at 1234 and 1169 cm−1, assigned predominantly to C–O stretching modes from carbohydrates and a decrease in absorbance for bands at 965, 930, 885 and 827 cm−1 assigned to mainly RNA vibrational modes. The bands 1080 and 1207 cm−1 showed a significant decrease in absorbance with drugs 1, 2 and cisplatin.
To further investigate the spectra of the non-treated cells and the treated cells, PCA was applied for all samples after pre-processing. PCA was performed on the second derivative of infrared spectra from control cells and cells inoculated with cisplatin, 1 and 2. Fig. 5 shows a PC1 versus PC2 Scores Plot of the control cells, inoculated with saline or acetone and cells treated with 1 and 2 when using a drug concentration of 50 μM for both the A2780 and the A2780R cell line. The positive loading bands are correlated with the negative scores and vice versa.
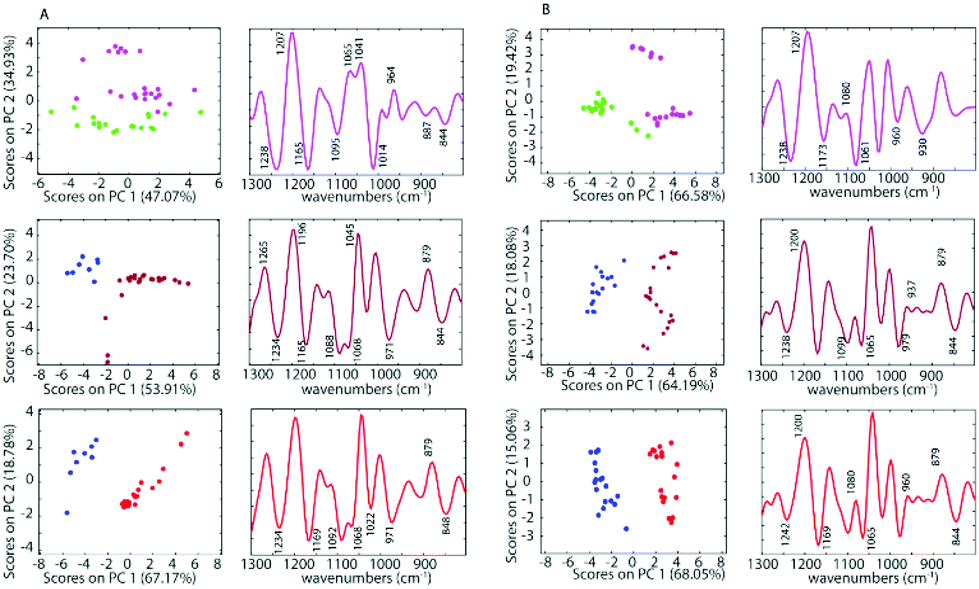 | ||
| Fig. 5 PCA Scores (left panels) and Loading Plots (right panels) of the A2780 cell line (A) and A2780R cell line (B) treated with 50 μM cisplatin (purple), 1 (dark red) and 2 (red) and saline (green) or acetone (blue) as controls. | ||
There is a clear separation between the scores of control cells and the drug inoculated cells along PC1 in both cell lines for 1 and 2, while for cisplatin the separation is along PC2. This indicates that the separation is not due to spectral features from the drug but rather biochemical changes induced in the cells affected by the drug. The spectra for each drug treatment and each cell line were individually assessed using PCA in the fingerprint region (1300 to 800 cm−1) where the greatest changes were observed. For each PCA Scores Plot the controls were separated well from spectra of the drug inoculated cells. The separation between treated cells and controls at the concentration of 50 μM for 1 and 2 occurs mostly along PC1 demonstrating a profound effect of these drugs on the cells. However, for cisplatin treated cells, the separation occurs along PC2, which indicates a weaker effect of cisplatin on the cells. For PC1, the negative bands in the Loading Plots correlate with the positive score values because the second derivatives were used in the PCA decomposition and not the raw spectra. In this case, the negative bands in the Loadings Plot refer to the treated cells, while the positive loadings correspond to the control cells. The PCA loadings for each experiment are remarkably similar irrespective of the drug or the cell type. The drugs appear to be eliciting a similar apoptotic response in both cell lines. The Loading Plots show that the bands responsible for the separation of the control cells from the cells treated with 1 or 2 are associated with changes in ν(C–O) vibrations in RNA (1169 cm−1), phosphodiester of nucleic acids DNA and RNA (1097 cm−1), ν(PO2−) and ν(C–O) at 1020 cm−1. This indicates that both drugs 1 and 2 affect the nucleic acids in the A2780 cell line. Fig. 5 shows that complexes 1 and 2 have a stronger effect compared to cisplatin on both cell lines. The spectra of the cisplatin treated cells separated well along PC2. For PC2, the negative bands in the Loading Plots correlate with the negative score values. Therefore, the negative PC scores represent the treated cells and show characteristic features at 1235, 1159, 1117, 1081, 1027, 983, 927, 903 and 845 cm−1. The positive PC loadings, on the other hand, represent the control sample and show characteristic bands at 1195, 1139, 1099, 1046, 1007, 962, 910 and 883 cm−1. Unlike the other drugs, cisplatin had quite a different effect on the both the A2780 and A2780R cell lines. The PCA loadings from spectra of cisplatin-treated cells compared to control cells are very different for the A2780 and A2780R cell lines, while they are similar for spectra of organoamidoplatinum drug-treated cells compared to control cells in A2780 and A2780R. Compounds 1 and 2 show some similar effects on both cell lines. However, less separation was observed when using cisplatin especially in the case of the A2780R cell line. The results indicate that 1 and 2 have a much more profound effect and a similar mode of action to each other and different from cisplatin. The A2780R cells appeared less affected by cisplatin than the A2780 cells. The bands 1238, 1173, 1080, 1061, 960, 887 and 844 cm−1 are correlated directly to the second derivative spectra of the inoculated cells with cisplatin. Some of them are shown as strong bands in the Loadings Plot, which indicates a stronger effect of cisplatin on bands such as 1238, 1173, 1080 and 1061 cm−1. They correlate with 1234, 1169, 1080 and 1053 cm−1 bands in the second derivative. One characteristic spectral feature that is highly affected by the drugs is around 1234 cm−1 and assigned to the asymmetric stretching vibration of phosphodiester functional groups of DNA and RNA polysaccharide backbone structures. Other bands around 1170, 1052 and 1009 cm−1 are tentatively assigned to symmetric stretching vibrations of PO2− groups in nucleic acids and stretching vibration of C–O–P and C–O–C of polysaccharides. The changes are consistent with those observed for apoptosis in other studies. Gao et al.47 combined FT-IR with fluorescence activated cell sorting (FACS) to analyze SW620 cells following treatment with 5-fluorouracil for 12, 24 and 48 h. The apoptotic cells had several spectral characteristics including the peaks at 1240 cm−1 which increased in wavenumber and a band at 1040 cm−1, associated with polysaccharides, appeared at 24 and 48 h, which was blue shifted and the absorbance 1040/1460 ratio increased at the late stage of apoptosis. Zhou et al.41 reported a number of differences between normal HL60 cells, differentiated cells induced by all-trans retinoic acid (ATRA) and PMA, and apoptotic cells induced by vircristine (VCR). Their results indicated that the α-helix content of the membrane protein of differentiated HL60 cells induced by ATRA and PMA increased, while the β-sheet content of membrane proteins of apoptotic cells induced by VCR also increased. Analysis of the lipid marker band at 2854–2853 cm−1 showed a higher membrane lipid content in HL60 cells during differentiation or apoptosis compared with that of untreated HL60 cells. The increased lipid content during differentiation and apoptosis was also corroborated by the higher intensity of the 1456–1455 cm−1 CH2-deformation band of the lipid methylene groups. Zhou et al.41 also reported an increase in the DNA/protein absorption ratio (1087 cm−1/1540 cm−1) during differentiation and apoptosis in leukemic cell lines. Gasparri and Muzio48 quantified apoptotic cells by using attenuated total reflection (ATR) on HL60 leukaemic cells with camptothecin and monitored apoptosis over time. Several ATR-FTIR spectral changes occurred during the apoptotic process and noted the apoptotic index was inversely correlated with the spectral area in the region 1200–900 cm−1, assigned to the absorption of nucleic acids. Hence the spectral changes observed in our study are consistent with changes indicative of apoptosis.
Conclusions
In this study we compared our new organoamidoplatinum(II) drugs with the model compound cisplatin. It was shown that both 1 and 2 have profound and similar effects irrespective of the cell line. However, cisplatin generated quite different Scores and Loadings Plots compared to the other drugs. The separation on the PC1 versus PC2 Scores Plots were not as dramatic compared to the organoamidoplatinum(II) complexes especially in the case of the A2780R cell line. Moreover, the Loading Plots were quite different between the sensitive and resistant cell line for cisplatin but were almost identical for the organoamide drugs. Based on the Loadings Plot both organoamide drugs and cisplatin showed significant effects on the nucleic acid structure. The results indicate that the organoamidoplatinum(II) complexes have a much more profound effect on both cisplatin sensitive and resistant cell lines when compared to cisplatin. While the organoamidoplatinum(II) drugs show potential toxicity, testing and in vivo studies are required before the compounds can be advanced as anti-tumour drugs.Conflicts of interest
There are no conflicts to declare.Acknowledgements
We thank Mr. Finlay Shanks for the technical support and Ms Alison Slater and Dr Kelly Waldeck for assistance with cell culture studies. B. R. W. is supported by an Australian Research Council (ARC) Future Fellowship grant FT120100926.References
- E. M. Swisher, K. K. Lin, A. M. Oza, C. L. Scott, H. Giordano, J. Sun, G. E. Konecny, R. L. Coleman, A. V. Tinker and D. M. O'Malley, Lancet Oncol., 2017, 18, 75–87 CrossRef CAS PubMed.
- I. Visintin, Z. Feng, G. Longton, D. C. Ward, A. B. Alvero, Y. Lai, J. Tenthorey, A. Leiser, R. Flores-Saaib and H. Yu, Clin. Cancer Res., 2008, 14, 1065–1072 CrossRef CAS PubMed.
- Z. Zhang, R. C. Bast, Y. Yu, J. Li, L. J. Sokoll, A. J. Rai, J. M. Rosenzweig, B. Cameron, Y. Y. Wang and X.-Y. Meng, Cancer Res., 2004, 64, 5882–5890 CrossRef CAS PubMed.
- G. Solyanik, Exp. Oncol., 2010, 32, 181–185 CAS.
- P. L. Fale, A. Altharawi and K. A. Chan, Biochim. Biophys. Acta, Mol. Cell Res., 2015, 1853, 2640–2648 CrossRef CAS PubMed.
- N. J. Wheate, S. Walker, G. E. Craig and R. Oun, Dalton Trans., 2010, 39, 8113–8127 RSC.
- A. L. Pinto and S. J. Lippard, Biochim. Biophys. Acta, Rev. Cancer, 1985, 780, 167–180 CrossRef CAS.
- D. Roberts, J. Schick, S. Conway, S. Biade, P. Laub, J. Stevenson, T. Hamilton, P. O'Dwyer and S. Johnson, Br. J. Cancer, 2005, 92, 1149–1158 CrossRef CAS PubMed.
- I. Kostova, Recent Pat. Anti-Cancer Drug Discovery, 2006, 1, 1–22 CrossRef CAS PubMed.
- E. R. Jamieson and S. J. Lippard, Chem. Rev., 1999, 99, 2467–2498 CrossRef CAS PubMed.
- M. Fuertes, J. Castilla, C. Alonso and J. Prez, Curr. Med. Chem., 2003, 10, 257–266 CrossRef CAS PubMed.
- B. Rosenberg, L. Van Camp and T. Krigas, Nature, 1965, 205, 698–699 CrossRef CAS PubMed.
- M. Galanski and B. K. Keppler, Curr. Med. Chem.: Anti-Cancer Agents, 2007, 7, 55–73 CrossRef CAS PubMed.
- B. Rosenberg, Cancer, 1985, 55, 2303–2316 CrossRef CAS PubMed.
- P. Ilinski, B. Lai, Z. Cai, W. Yun, D. Legnini, T. Talarico, M. Cholewa, L. K. Webster, G. B. Deacon, S. Rainone, D. R. Phillips and A. P. J. Stampfl, Cancer Res., 2003, 63, 1776–1779 CAS.
- G. J. Bosl and R. J. Motzer, N. Engl. J. Med., 1997, 337, 242–254 CrossRef CAS PubMed.
- V. Foltinová, L. Švihálková Šindlerová, V. Horváth, P. Sova, J. Hofmanova, R. Janisch and A. Kozubík, Scr. Med., 2008, 81, 105–116 Search PubMed.
- R. Xing, X. Wang, C. Zhang, Y. Zhang, Q. Wang, Z. Yang and Z. Guo, J. Inorg. Biochem., 2009, 103, 1039–1044 CrossRef CAS PubMed.
- M. Galanski, Recent Pat. Anti-Cancer Drug Discovery, 2006, 1, 285–295 CrossRef CAS PubMed.
- D. Kushev, E. Naydenova, J. Popova, L. Maneva, K. Grancharov and N. Spassovska, Z. Naturforsch., C: J. Biosci., 2003, 58, 103–108 CAS.
- W. R. Moore, M. E. Anderson, A. Meister, K. Murata and A. Kimura, Proc. Natl. Acad. Sci. U. S. A., 1989, 86, 1461–1464 CrossRef CAS.
- P. Heffeter, U. Jungwirth, M. Jakupec, C. Hartinger, M. Galanski, L. Elbling, M. Micksche, B. Keppler and W. Berger, Drug Resist. Updates, 2008, 11, 1–16 CrossRef CAS PubMed.
- G. Cossa, L. Gatti, F. Zunino and P. Perego, Curr. Med. Chem., 2009, 16, 2355–2365 CrossRef CAS PubMed.
- B. C. Bohrens, T. C. Hamilton, H. Masuda, K. R. Grotzinger, J. Whang-Peng, K. G. Louie, T. Knutsen, W. M. McKoy, R. C. Young and R. F. Ozols, Cancer Res., 1987, 47, 414–418 Search PubMed.
- T. Hambley, Chem. in Aust, 1991, 58, 154–156 CAS.
- K. S. Lovejoy and S. J. Lippard, Dalton Trans., 2009, 10651–10659 RSC.
- J. L. Van der Veer, Chem. Br., 1988, 24, 775–780 CAS.
- M. J. Cleare and J. D. Hoeschele, Bioinorg. Chem., 1973, 2, 187–210 CrossRef CAS.
- N. J. Wheate and J. G. Collins, Coord. Chem. Rev., 2003, 241, 133–145 CrossRef CAS.
- J. Czapla-Masztafiak, J. J. Nogueira, E. Lipiec, W. M. Kwiatek, B. R. Wood, G. B. Deacon, Y. Kayser, D. L. Fernandes, M. V. Pavliuk, J. Szlachetko, L. González and J. Sá, J. Phys. Chem. Lett., 2017, 8, 805–811 CrossRef CAS PubMed.
- L. K. Webster, G. B. Deacon, D. P. Buxton, B. L. Hillcoat, A. M. James, I. A. Roos, R. J. Thomson, L. P. Wakelin and T. L. Williams, J. Med. Chem., 1992, 35, 3349–3353 CrossRef CAS PubMed.
- T. Talarico, D. R. Phillips, G. B. Deacon, S. Rainone and L. K. Webster, Invest. New Drugs, 1999, 17, 1–15 CrossRef CAS PubMed.
- A. R. Battle, A. M. Bond, A. Chow, D. P. Daniels, G. B. Deacon, T. W. Hambley, P. C. Junk, D. N. Mason and J. Wang, J. Fluorine Chem., 2010, 131, 1229–1236 CrossRef CAS.
- K. Al-Jorani, A. Rüther, M. Martin, R. Haputhanthri, G. B. Deacon, H. L. Li and B. R. Wood, Sensors, 2018, 2018100406, DOI:10.20944/preprints201810.0406.v1.
- E. Wong and C. M. Giandomenico, Chem. Rev., 1999, 99, 2451–2466 CrossRef CAS PubMed.
- R. J. Parker, A. Eastman, F. Bostick-Bruton and E. Reed, J. Clin. Invest., 1991, 87, 772–777 CrossRef CAS PubMed.
- A. Mignolet, A. Derenne, M. Smolina, B. R. Wood and E. Goormaghtigh, Biochim. Biophys. Acta, Proteins Proteomics, 2016, 1864, 85–101 CrossRef CAS PubMed.
- L. Chiriboga, H. Yee and M. Diem, Appl. Spectrosc., 2000, 54, 1–8 CrossRef CAS.
- P. Lasch, L. Chiriboga, H. Yee and M. Diem, Technol. Cancer Res. Treat., 2002, 1, 1–7 CrossRef PubMed.
- K. R. Flower, I. Khalifa, P. Bassan, D. Démoulin, E. Jackson, N. P. Lockyer, A. T. McGown, P. Miles, L. Vaccari and P. Gardner, Analyst, 2011, 136, 498–507 RSC.
- J. Zhou, Z. Wang, S. Sun, M. Liu and H. Zhang, Biotechnol. Appl. Biochem., 2001, 33, 127–132 CrossRef CAS PubMed.
- E. Benedetti, M. P. Palatresi, P. Vergamini, F. Papineschi and G. Spremolla, Leuk. Res., 1985, 9, 1001–1008 CrossRef CAS PubMed.
- R. Haputhanthri, R. Ojha, E. I. Izgorodina, S.-X. Guo, G. B. Deacon, D. McNaughton and B. R. Wood, Vib. Spectrosc., 2017, 92, 82–95 CrossRef CAS.
- P. Skehan, R. Storeng, D. Scudiero, A. Monks, J. McMahon, D. Vistica, J. T. Warren, H. Bokesch, S. Kenney and M. R. Boyd, J. Natl. Cancer Inst., 1990, 82, 1107–1112 CrossRef CAS PubMed.
- Z. Movasaghi, S. Rehman and D. I. ur Rehman, Appl. Spectrosc. Rev., 2008, 43, 134–179 CrossRef CAS.
- G. Bellisola and C. Sorio, Am. J. Cancer Res., 2012, 2, 1–21 CAS.
- Y. Gao, X. Huo, L. Dong, X. Sun, H. Sai, G. Wei, Y. Xu, Y. Zhang and J. Wu, Mol. Med. Rep., 2015, 11, 2585–2591 CrossRef CAS PubMed.
- F. Gasparri and M. Muzio, Biochem. J., 2003, 369, 239–248 CrossRef CAS PubMed.
Footnote |
| † Electronic supplementary information (ESI) available. See DOI: 10.1039/c8an01558a |
| This journal is © The Royal Society of Chemistry 2018 |