
Raman spectroscopic features of primary cardiac microvascular endothelial cells (CMECs) isolated from the murine heart†
Szymon
Tott
 ab,
Marek
Grosicki
b,
Beata
Klimas
a,
Dominika
Augustynska
b,
Stefan
Chlopicki
bc and
Malgorzata
Baranska
*ab
ab,
Marek
Grosicki
b,
Beata
Klimas
a,
Dominika
Augustynska
b,
Stefan
Chlopicki
bc and
Malgorzata
Baranska
*ab
aFaculty of Chemistry, Jagiellonian University, Gronostajowa 2, 30-387 Krakow, Poland. E-mail: baranska@chemia.uj.edu.pl
bJagiellonian Centre for Experimental Therapeutics (JCET), Jagiellonian University, Bobrzynskiego 14, 30-348 Krakow, Poland
cDepartment of Experimental Pharmacology, Chair of Pharmacology, Jagiellonian University, Grzegorzecka 16, 31-531 Krakow, Poland
First published on 5th November 2018
Abstract
Gaining knowledge on the biochemical profile of primary endothelial cells on a subcellular level can contribute to better understanding of cardiovascular disease. In this work, primary cardiac microvascular endothelial cells (CMECs) isolated from the mouse heart and murine H5V endothelial cell line were characterized with the use of a Raman imaging technique. Primary CMECs displayed a distinct Raman-based biochemical phenotype as compared with other cells isolated from the heart and were characterized by a low lipid content. In contrast to the murine H5V endothelial cell line, CMECs did not display lipid droplets (LDs) in the cytoplasm, while the former have many low-unsaturated LDs. In conclusion, Raman imaging is a fast and efficient tool to analyse single coronary endothelial cells in a non-invasive manner that can prove useful to characterize biochemical changes in a single isolated primary endothelial cell from a diseased heart.
Introduction
The heart consists of different cell types, mostly endothelial cells, cardiomyocytes and fibroblasts.1 The communication between the cells, in particular, the cross-talk between cardiomyocytes and microvascular endothelial cells is crucial for maintaining cardiac homeostasis, development and autoregulation.2 The microvascular endothelium that lines arterioles, venules and capillaries is in direct contact with cardiomyocytes and modulates cardiac myocyte functions by releasing a number of substances.3–5 Since the first experimental observations of cardial cell–cell communication took place, a great number of cardio-active factors have been identified, including nitric oxide, various peptides and proteins.6,7 Disturbance in this communication often related to the altered microvascular coronary endothelial function results in a cardiac pathology development on the organ-level.8–10 To better understand phenotypic changes in primary coronary endothelial cells that could contribute to disease development, biochemical state of the healthy primary coronary endothelial cells must be well defined.Recently, Raman spectroscopy has been proven and utilized as an efficient tool for measurements of various biological samples. This technique provides an insight into the chemical composition and combined with microscopy techniques can be used for imaging of samples with a resolution limited only by a diffraction limit, that opens the possibility of imaging single cells.11,12 No special preparations of samples are required. Moreover, the non-destructive character of the measurement and its label-free nature allow information about various components to be obtained in a single measurement.11,13 The data mining protocol of the spectra combined with spatial information can be used for the analysis and identification of the particular cellular components as well as the intracellular structures such as the nucleus, nucleoli, lipid droplets and endoplasmic reticulum.14,15 Raman imaging was proven to be successful in studying various biological samples, including cell lines and primary cells, both live and fixed ones.16–19 This technique offers particularly interesting opportunities in the detection and investigation of endothelial dysfunction,20–24 as it allows tracing of phenotypic changes in the cells i.e. during inflammatory processes. A large cross-section of long aliphatic chain molecules’ scattering makes Raman spectroscopy useful in the research of lipidic biological structures e.g. lipid droplets (LDs). These structures, which received high interest in recent years with new discoveries of their functions in intracellular processes, are very common in various types of cells.
To study endothelial cells and their function, many models can be used, including primary cells isolated from organs and cell lines. Experiments performed on cell cultures are usually preferred since such cells are generally cost-effective and easier to culture, transfer and control over cellular functions and processes.25 However, an interpretation of results being drawn from experiments on cell lines has to be taken with caution. In the cell lines in two-dimensional cultures multiple passaging results in genetic and phenotypic alternations, lowering the relevance of such models to in vivo situation.26,27 In turn, primary cells provide data that are more significant and relevant for the whole organs but advanced techniques are required to acquire them and to characterize their phenotype.28 In particular, the number of primary coronary endothelial cells isolated from the murine heart is limited and their lifespan is short.
The aim of this study was to characterise biochemical compositions of primary cardiac microvascular endothelial cells (CMECs) in comparison to the murine heart H5V cell line with the use of Raman imaging. Despite the fact that Raman-based techniques already found applications in life sciences, targeting primary cells is a novel approach.19,29–32 High resolution label free confocal Raman imaging, due to the information-rich signal that can give simultaneously knowledge about a wide range of compounds, surpasses more widespread techniques like fluorescence microscopy in the studies on cells.
Experimental
Sample preparation
For the Raman measurements, CMECs and murine H5V endothelial cell lines were used.The murine heart endothelial cell line H5V was cultured in Dulbecco's modified Eagle cell culture medium (DMEM) (Gibco) supplemented with 10% (v/v) fetal bovine serum (Gibco), 2 mM L-glutamine (Gibco) and penicillin–streptomycin antibiotics solution (Life Technologies).
Primary CMECs were isolated from the hearts of healthy mice, through a CD31 positive immunomagnetic cell separation method. Briefly, mice were euthanized with ketamine and xylazine (100 and 10 mg kg−1, respectively). Hearts were collected under aseptic conditions, followed by atrial removal. The hearts were rinsed several times with cold DPBS (Gibco). Afterwards, tissues were mechanically minced and placed into digestion solution containing 1 mg ml−1 collagenase A (Sigma-Aldrich). Tissues were digested at 37 °C, for 45 minutes, under rotation. The obtained cellular suspension was dispersed by forcing it through a sterile 18G needle approximately 20 times. The suspension was filtered through a 70 μm cell strainer (BD Biosciences) in order to obtain a single cellular mixture. Remaining cells were centrifuged at 300g for 5 min. The cellular pellet was resuspended in 270 µl DMEM medium supplemented with 10% v/v FBS. Endothelial cells were separated from residual cells through a CD31 positive immunomagnetic cell separation method using a Miltenyi Biotec system.33–35 The separation method was performed in accordance with the manufacturer's guidelines. To the isolated cellular suspension 30 µl CD31 mouse MicroBeads (MiltenyiBiotec) were added, and the cells were incubated for 15 minutes at 4 °C. After rinsing, the cells were placed on the LS Columns positioned in the magnetic separator. CD31-positive cells were immobilized on the columns whereas additional cells were eluted. Flow through from the rinsed column was collected in order to obtain non-CD31 cells for further analysis. CD31-positive cells, including endothelial cells (retained on the column) were liberated through column rinsing after removal of the magnetic field.
The purity of isolated endothelial cells was determined by flow cytometry analysis. For that, the cells (5 × 10⁴) were suspended in 100 µl cell culture medium and 1 µl of: PE-CF594-conjugated CD31, PerCP-conjugated CD45 and BV421-conjugated CD146 antibodies were added (BD Pharmingen/Horizon). After incubation for 30 min at room temperature, the cell suspension was washed with 500 µl DPBS buffer and resuspended in 400 µl DPBS. The labelled cells were analysed using an LSR II flow cytometer (BD Biosciences). Primary CMECs were identified as the CD31/CD146-positive and CD45-negative population.
Before the Raman measurements, the H5V cell line, primary CMECs and eluted non-CD31 cells were placed on the CaF2 slides coated with 2% gelatine (Sigma-Aldrich) and incubated in appropriate cell culture medium until attached.
Isolated CMECs as well as non-CD31 cells were cultured in RPMI 1640 medium with L-glutamine (Gibco) supplemented with sodium pyruvate (Gibco), MEM Non-Essential Amino Acid Solution (Thermo Fisher), 10% (v/v) FBS (Gibco), 2.5 mg ml−1 ECGS (Sigma-Aldrich) and penicillin–streptomycin antibiotics solution (Life Technologies), until used during the Raman measurements.
H5V cells were cultured in DMEM with L-glutamine, supplemented with 10% (v/v) FBS and penicillin–streptomycin antibiotics solution.
Before the Raman measurements the cells have been fixed with 0.5% glutaraldehyde.
Raman imaging and data analysis
Raman measurements were performed on a WITec Confocal Raman Microscope (WITec alpha 300R, Jagiellonian Centre for Experimental Therapeutics). The imaging system was equipped with an air cooled solid state laser (532 nm), 60× immersive objective (Nikon Fluor, NA = 1), 600 grooves per mm grating and a back-illuminated CCD camera (Newton EMCCD DU970 BV). Maximum laser power was used in every measurement (ca. 35 mW). The scattered light was collected and directed to the spectrometer with a 50 µm multimodal optical fiber. During the measurements the cells were submerged in PBS.Raman imaging was performed with the integration time of 0.9 s for every single spectrum, in the range between 100–3700 cm−1 with the spectral resolution of 3 cm−1. In every single measurement the sampling density of 0.5 µm (with available spatial resolution of the spectrometer down to 0.36 µm) was maintained, and the size of the imaged area was set individually for each individual cell. The measurement setup and data acquisition were controlled by the WITec Control software.
Pre-processing and chemometric analysis were carried out with the use of WITec Project Plus Software. Cosmic spike removal (CRR) and background subtraction (BG, polynomial fit, order 3) were performed ahead of any analysis. The distribution of certain compounds on images by integration of selected Raman bands and k-means clustering (KMC) was implemented for further analysis of the data. For KMC in the range of 600–1800 cm−1, the Manhattan measure of distances was used. The number of generated classes was dependent on the number of features visible in the cells and varied between 3 and 6. The ranges used for the integration of selected bands are given in the section “Results and discussion”.
Results and discussion
Primary cardiac microvascular endothelial cells (CMECs)
Through the application of the immunomagnetic cell separation methods, a distinct heart cell population was isolated. These cells were defined as the CD45-negative and CD31/CD146 positive population, determined by flow cytometry analysis. The cells with following antigen expression patterns were identified as CMECs (Fig. 1).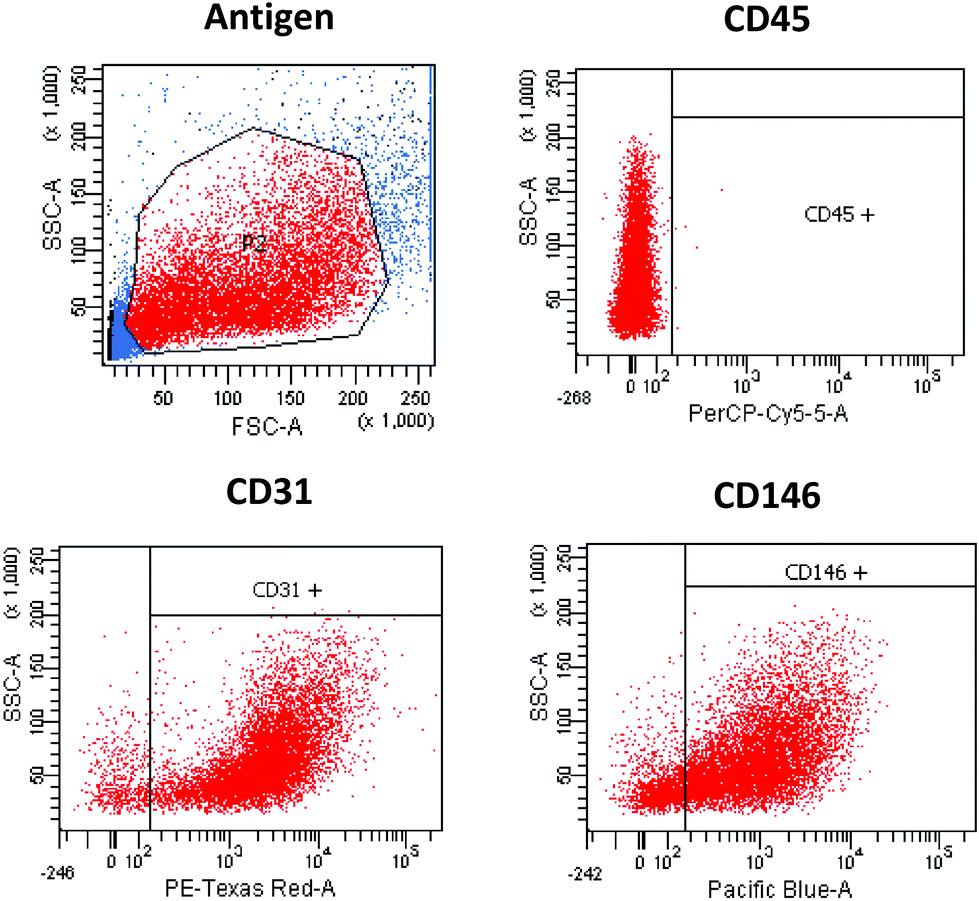 | ||
| Fig. 1 Flow-cytometry analysis of separated murine heart cardiac microvascular endothelial cells (CMECs). CMECs were isolated from the murine hearts through CD31-immunomagnetic cell separation methods. Purified cells were analysed against CD45, CD31 and CD146 antigen expression. CMECs were identified as CD45 negative and CD31/CD146 positive cells. | ||
High resolution Raman images of CMECs, calculated by integrating over wavenumber ranges of C–H stretching bands (3027–2800 cm−1) and in the region characteristic of DNA/RNA (808–775 cm−1), were obtained (Fig. 2). These endothelial cells do not exhibit particularly characteristic morphological features – they are small, non-parenchymal, with a slightly elongated nucleus. The images showing the distribution of DNA/RNA visualise a precisely regular ellipsoid nucleus with strongly visible nucleoli. The number and size of nucleoli may differ between single cells; however, in general two or three irregular nucleoli are observed within the nucleus.
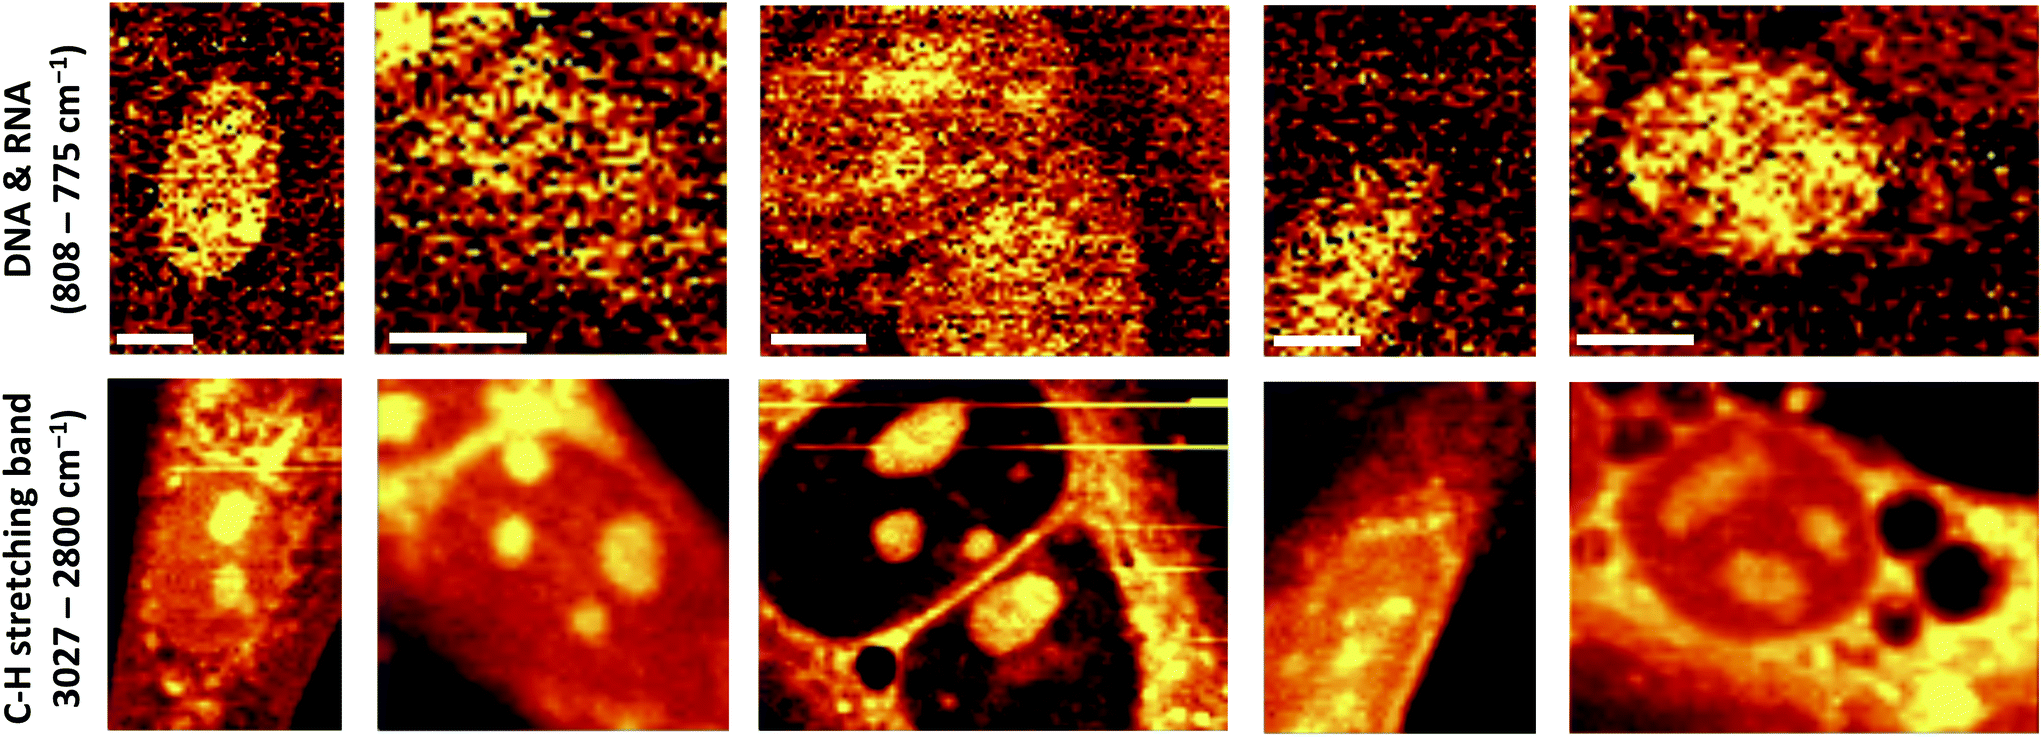 | ||
| Fig. 2 Distribution of DNA/RNA and C–H stretching band in selected primary CMECs generated by integration of Raman bands at 785 cm−1 (ring breathing modes of the DNA/RNA bases) and in a range of 3027–2800 cm−1 (C–H stretching bands), respectively. Scale bar on the images equals 8 μm. | ||
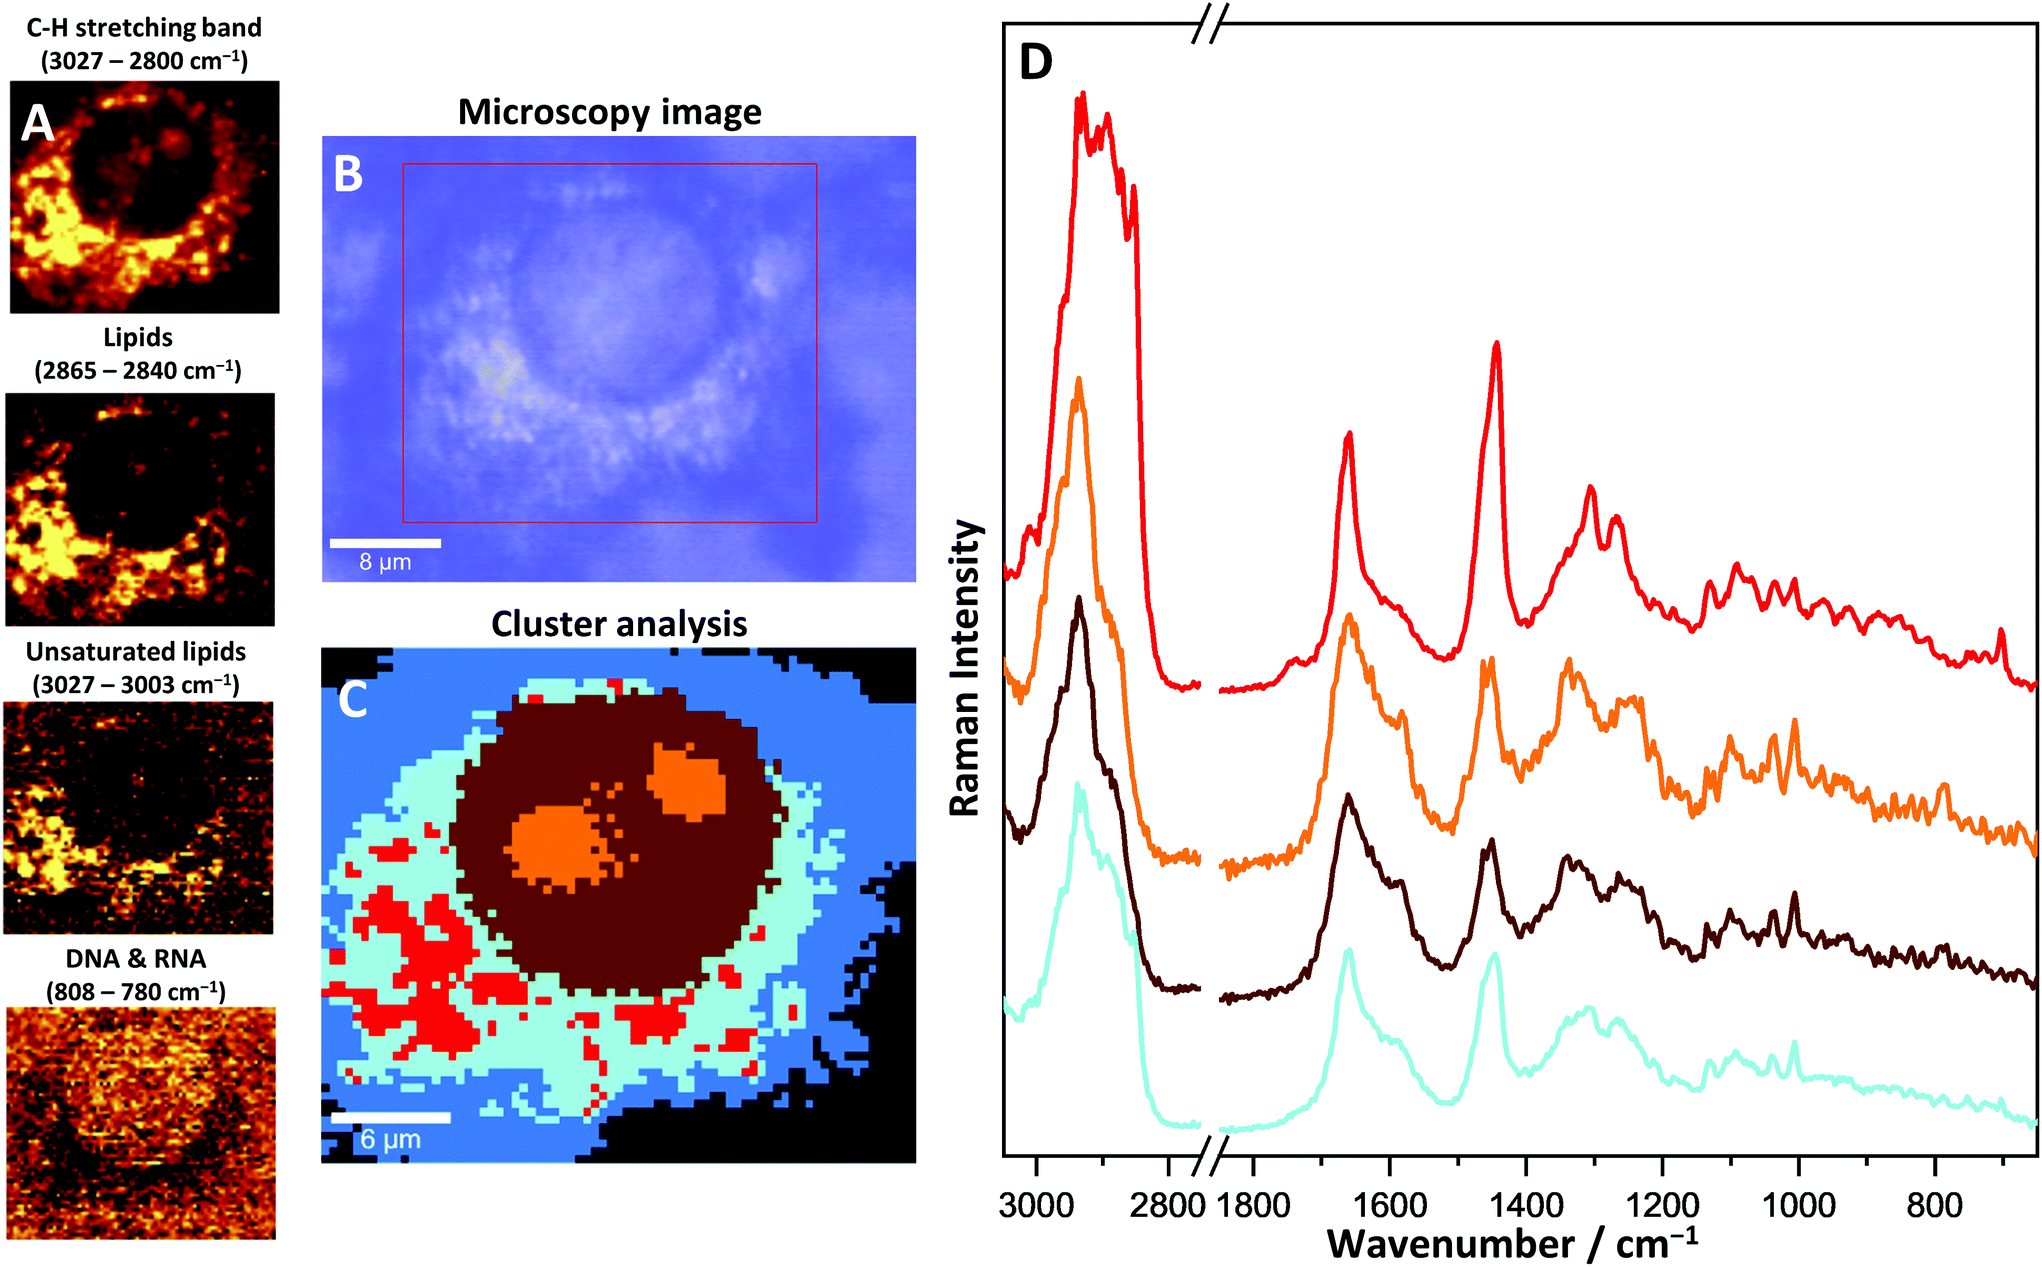
More details on cell morphology and biochemistry can be extracted through specific chemometric analysis. The k-means clustering (KMC) method was used for data mining (Fig. 3). Hyperspectral 2D Raman images were split into separate classes with similar biochemical features. For a better understanding of the obtained results, the KMC was compared with a microscopy image and Raman images showing distribution of specific bands. Four different classes can be distinguished and identified as cellular structures within a single CMEC (nucleus, nucleoli, endoplasmic reticulum and cytosol).
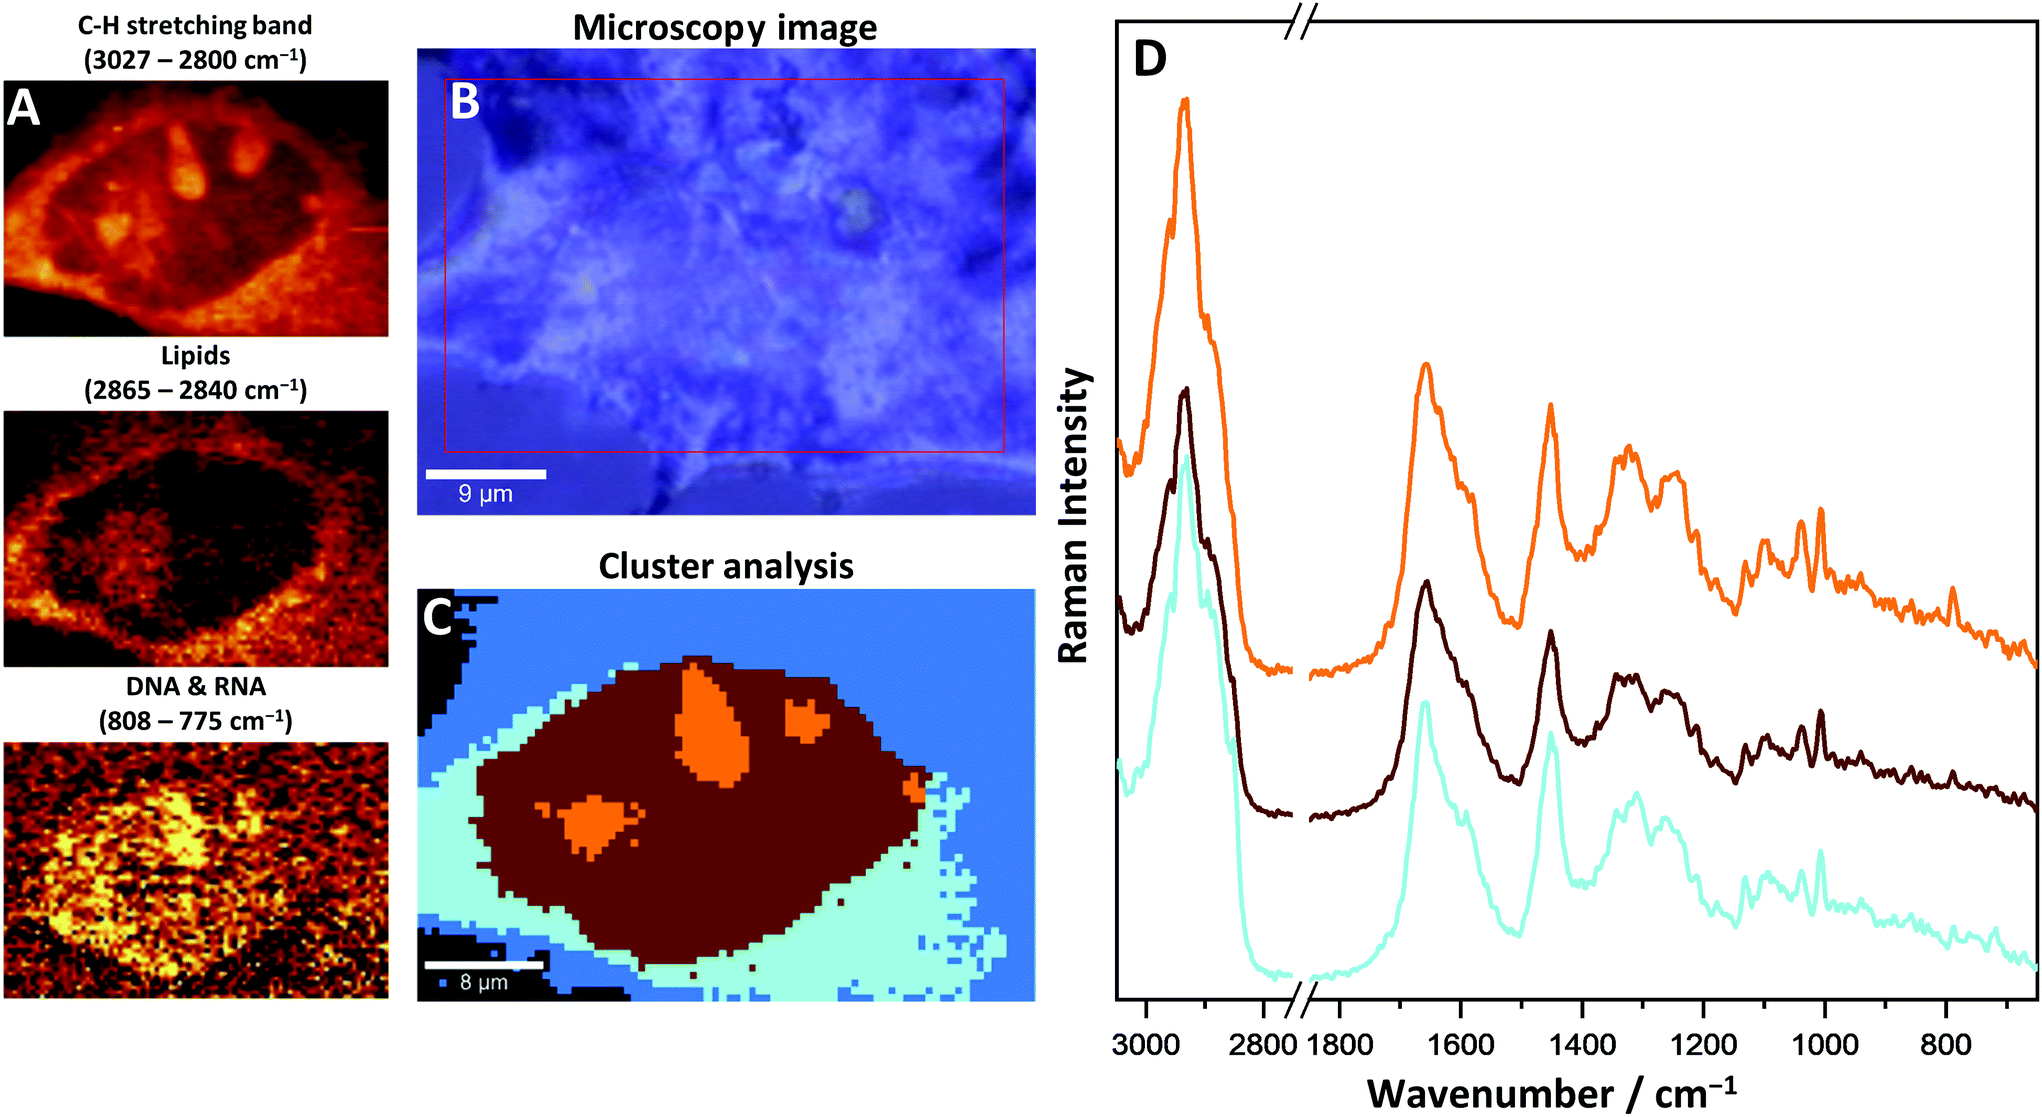 | ||
| Fig. 3 Raman imaging of a single CMEC; (A) false colour Raman images of distribution of C–H stretching band, lipids (2851 cm−1) and nucleic acids (785 cm−1); (B) microscopy image; (C) CA image; (D) average spectra of CA classes. The colours of spectra match the colours of classes from CA: endoplasmic reticulum (blue), nucleus (brown) and nucleoli (orange). | ||
The nucleus, as an organelle, contains mainly the genetic material of the cell. In Raman images DNA organized into chromosomes can be seen very distinctively. The bands at 785 cm−1 (ring breathing modes of the DNA/RNA bases), 1575 cm−1 (ring breathing modes), 1096 cm−1 (phosphate modes) and 1381 cm−1 (nucleic bases) on Raman spectra are specific for DNA and their distribution was used for the identification of the nucleus within the cells. A wide range of proteins, constituting chromatin, was recognized in the nucleus as well, especially with the use of a 1003 cm−1 band (assigned to phenylalanine aromatic ring-breathing mode). This band is unique for phenylalanine, and also gives an insight into the distribution and changes of protein concentrations within a single cell. By comparing nucleoli to the nucleus, due to their local increased density of nucleic chromatin, DNA, and protein-derived bands, they have shown a significantly elevated intensity as compared to the nucleus. Changes in the density between the nucleus and nucleoli were detected in the range of C–H stretching bands (3027–2800 cm−1) and were used to identify the nucleoli.
The analysis of Raman imaging based on lipid-specific bands does not show the presence of lipid droplets. Also, with KMC analysis LDs were not identified in CMECs.
The cytoplasm class can be split into two sub-classes: an internal one, close to the nucleus identified as the endoplasmic reticulum (light blue, Fig. 3C) and the more external cytosol class (blue, Fig. 3C). The most characteristic bands that differentiate the endoplasmic reticulum from the cytosol are related to the network of membranes and cytoskeleton structure, stored and metabolized lipids and mitochondria, which are not visible as single organelles due to their small size, below the spatial limit of detection. The band at 720 cm−1 was identified as characteristic of membrane phospholipids and is observed only on the average spectrum of the endoplasmic reticulum. The bands assigned to a long acyl chain of lipids show an increased intensity as compared to other classes, which indicates the presence of fatty acids scattered in the area of the endoplasmic reticulum. In this case, lipids can be relatively easily detected in the cells with the use of specific Raman bands, i.e. 1300 cm−1 (–CH2– twisting), 1447 cm−1 (–CH2– and –CH3– bending), 1667 cm−1 (C![[double bond, length as m-dash]](https://www.rsc.org/images/entities/char_e001.gif) C stretching) and 2855 cm−1 (C–H stretching). In CMECs, most lipids are located in the endoplasmic reticulum around the nucleus, however, lipid droplets were not observed. Specific bands that come from haemoproteins in mitochondria can be distinguished within the spectra measured at the cytoplasm area. Raman resonance occurred on the haem complex of cytochrome C, the important protein forming the part of the electron transport chain. As a result, the intensity of two bands was increased: at 1587 cm−1 (asymmetric C–C vibrations, ν19 mode) and 749 cm−1 (porphyrin breathing mode, ν15 mode). However, the intensities of these bands are relatively low due to the low concentration of haem in the sample. As a consequence the precise identification of the source of haem was not possible and the exogenous origin of this complex, as the residues of haemoglobin released during isolation, still must be considered.
C stretching) and 2855 cm−1 (C–H stretching). In CMECs, most lipids are located in the endoplasmic reticulum around the nucleus, however, lipid droplets were not observed. Specific bands that come from haemoproteins in mitochondria can be distinguished within the spectra measured at the cytoplasm area. Raman resonance occurred on the haem complex of cytochrome C, the important protein forming the part of the electron transport chain. As a result, the intensity of two bands was increased: at 1587 cm−1 (asymmetric C–C vibrations, ν19 mode) and 749 cm−1 (porphyrin breathing mode, ν15 mode). However, the intensities of these bands are relatively low due to the low concentration of haem in the sample. As a consequence the precise identification of the source of haem was not possible and the exogenous origin of this complex, as the residues of haemoglobin released during isolation, still must be considered.
Identification of CMECs in the fraction of various cells isolated from the heart
Raman imaging was applied to identify CMECs among various primary cardiac cells isolated from the heart. Images of the cells originating from the cellular fraction, before (Fig. 4C–F) and after carrying out the immunomagnetic separation (Fig. 4A and B), were obtained and analysed.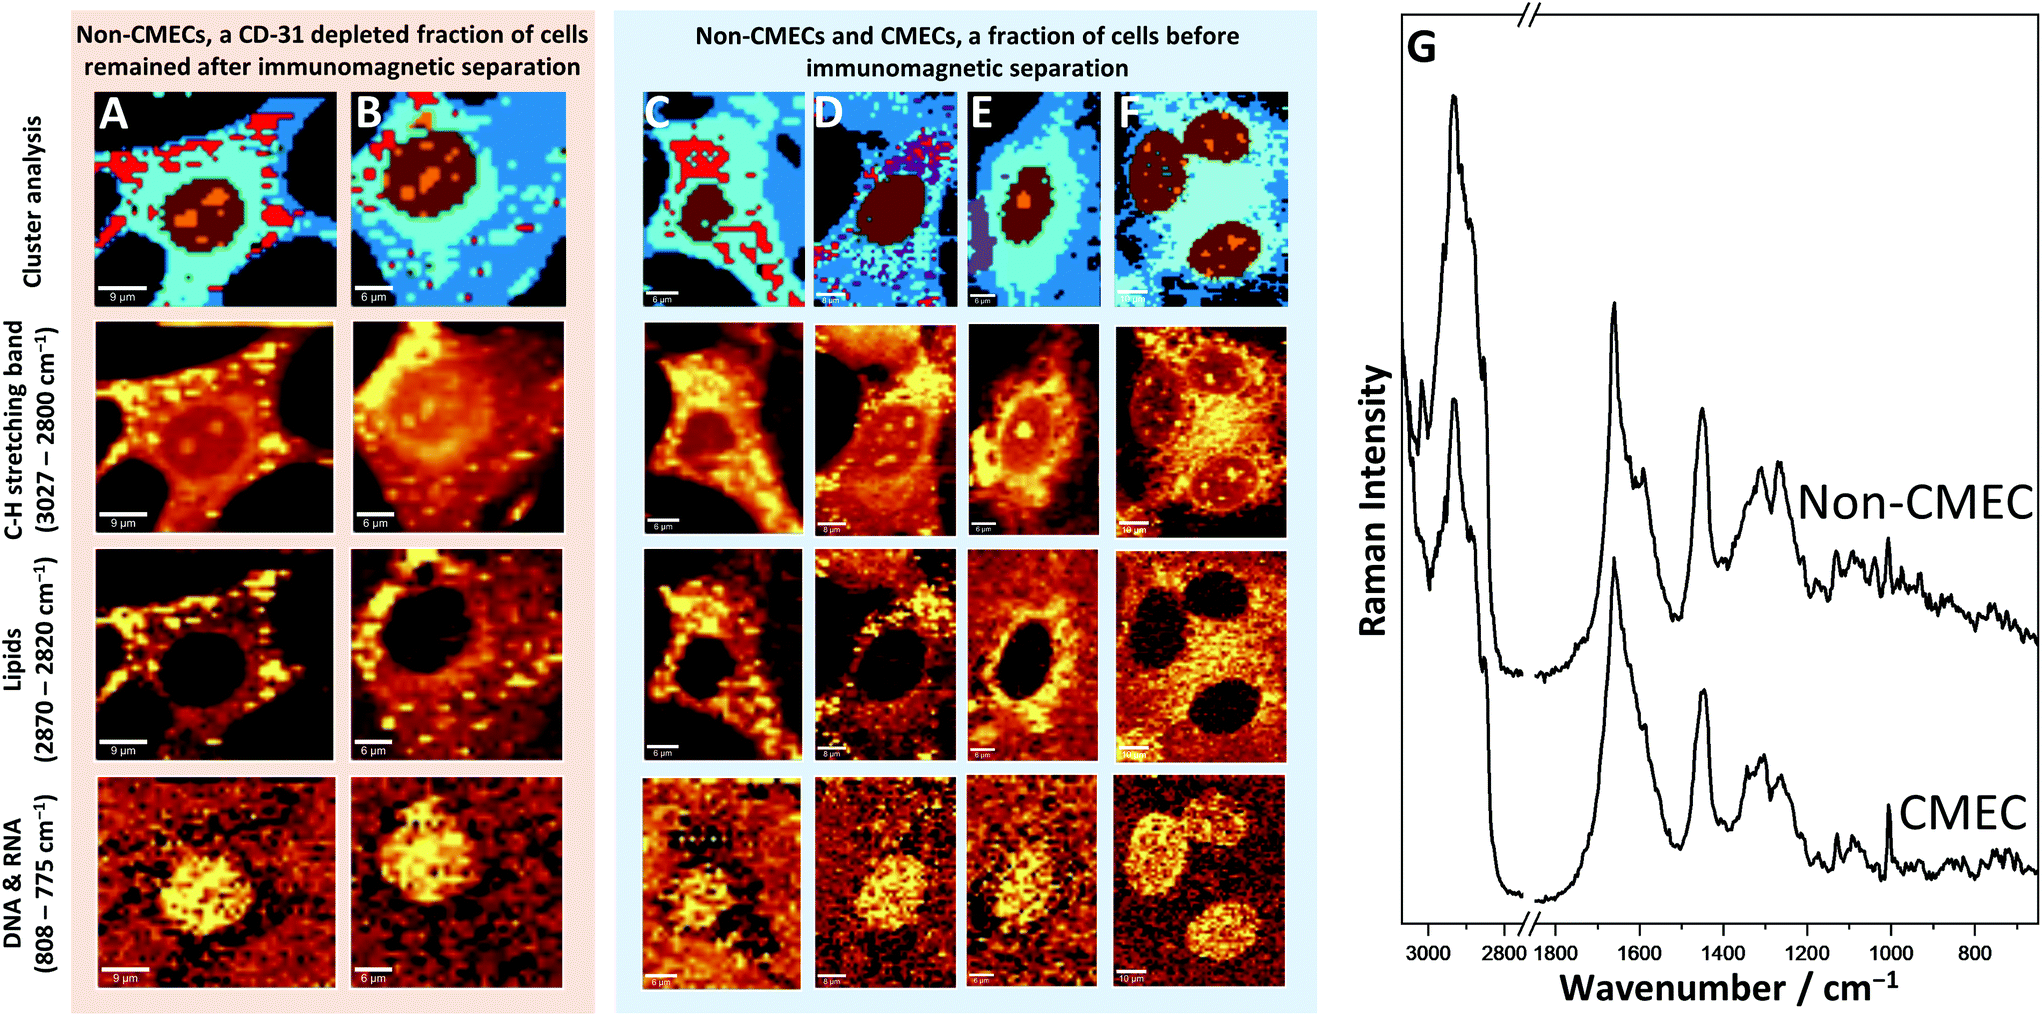 | ||
| Fig. 4 Various primary cells isolated from the heart. Cells in C and D are morphologically similar to non-endothelial fractions in A and B, and in E and F that can be identified as CMECs. The colours of classes correspond to cell organelles: cytoplasm (dark blue), endoplasmic reticulum (blue), nucleus (brown) and nucleoli (orange), lipid droplets (red), haem inclusions (violet). (G) A comparison of normalized, averaged Raman spectra of the whole cytoplasm area of a non-endothelial (non-CMEC) and endothelial cell (CMEC) is shown. | ||
The cells after their separation (CD-31 depleted) (Fig. 4A and B) revealed different features in comparison to the fraction of CMECs (CD45-negative and CD31/CD146 positive population). The fraction assigned as non-endothelial cardiac cells, probably contains mainly cardiomyocytes and fibroblasts (Fig. 4A and B). The cells of that fraction were characterized by multiple lipid droplets, that could be observed within the whole cytosol and occupied a wide area of the cell. It should be noted that the shape of these cells was different in relation to endothelial fractions (Fig. 2), as they were slightly oblong and of stellar shape instead of the regular, circular form as observed for CMECs.
In the cellular fraction before the immunomagnetic separation, which contained CD-31 depleted cells and a pure fraction of CMECs, it was possible to separate two groups of cells with the help of Raman imaging. The first group, due to phenotypical similarities can be identified as CMECs (Fig. 4E and F). The most significant and easily recognisable similarity was the lack of any lipid droplets in these cells and very regular shape typical of endothelial cells.
KMC allowed for separation of the class of exogenous haem (Fig. 4D and E, violet). This observation is easily explained, as the studied fraction could still contain red blood cells; the most probable source of haem in the sample. The next steps of isolation allowed extraction of this impurity from the fraction of pure CMECs, and caused haem to not be observed in the final fraction in such large amounts.
The second group of cells identified within this fraction (Fig. 4C and D) showed substantial similarities with the CD-31 depleted fraction of cells (Fig. 4A and B). Comparison of Raman images, as well as comparison of average spectra from LDs from both groups revealed their very similar spectral features. It may indicate that these cells belong to the same type of cardiac cell, but they are not the CMECs.
The biochemical composition averaged from the cytoplasm of both types of cells can be compared by looking at their Raman spectra (Fig. 4G). These average spectra are not so significantly different from each other, however, small alterations can be found. The lack of lipid droplets in the endothelial cells (CMECs) is visible by lower intensity bands originating from C–H vibrations (1300 cm−1, 1447 cm−1, 3000–2800 cm−1), –CH (1267 cm−1, 3013 cm−1) and CC (1666 cm−1). However, from that comparison it can be seen that averaged spectra do not exhibit differences between CMECs and non-CMECs as good as their Raman images, where LDs are seen distinctively.
H5V cell line
An optical image, Raman distribution images of selected bands and KMC results were obtained for a single cell of the H5V line (Fig. 5). The most characteristic and distinctive difference to primary CMEC features is the presence of lipid droplets in the cytosol. LDs visible in different cells from the H5V cell line are shown in the Raman images in Fig. 1S (ESI†). With the use of KMC analysis of one single H5V cell, LDs (red class, Fig. 5C) were separated within the endoplasmic reticulum and average spectra were calculated. The size of observed LDs varied, but usually did not exceed 2 µm. LDs, as structures mainly constituted by long-chain lipids, show a very high intensity of specific lipid bands which make these structures easily distinguishable within the cytoplasm. In the averaged spectra many bands originating from the acyl chain can be derived, e.g. 1082 cm−1 (C–C chain vibrations), 1310 cm−1 (–CH2– twisting), 1454 cm−1 (–CH2– and –CH3– bending) and 2851 cm−1 (C–H stretching). Furthermore, the observed bands at 1274 cm−1 (C–H deformations), 1660 cm−1 (CC stretching) and 3012 cm−1 (C–H stretching) are evidence of the presence of unsaturated fatty acids within LDs. As fatty acids in the cells are usually stored as esters,36 the Raman band at 1736 cm−1 (CO stretching), which is characteristic of the ester bond, is elevated on the LD average spectrum.
 | ||
| Fig. 5 Raman imaging of a single H5V cell; (A) false colour Raman images of distribution of C–H stretching band, lipids (2851 cm−1), unsaturated lipids (3013 cm−1) and nucleic acids (785 cm−1); (B) microscopy image; (C) CA image; (D) average spectra of CA classes. The colours of spectra match the colours of classes from CA: endoplasmic reticulum (blue), nucleus (brown) and nucleoli (orange), lipid droplets (red). | ||
Besides the presence of LDs, the overall phenotype of the H5V cell is comparable to the one observed for primary CMECs. The shape and size of cells of both types, as well as cellular organelles, are similar. Nucleus and nucleoli in the H5V cell have typical spectral features, with bands at 785 cm−1, 1575 cm−1, 1096 cm−1 and 1381 cm−1 of increased intensity as compared to the cytoplasm. The high density of chromatin in nucleoli affects spectra in a similar way to CMECs by an increased intensity of DNA/RNA, and the protein band located at 1003 cm−1. Similarly as observed before for primary CMECs, haem was identified within the cytoplasm.
Conclusions
In this work, a Raman-based approach to characterize the biochemical content of primary endothelial cells is presented. Cardiac microvascular endothelial cells (CMECs), isolated from the murine heart were characterized and their biochemical profile was compared to that of the murine H5V endothelial cell line, with the use of highly spatially resolved confocal Raman imaging. Chemometric analysis allowed for separation of the signals originating from particular subcellular structures. The applied method allows not only characterization of the morphological features of the cell, but also supplementation of it with the concerned chemical information, i.e. the general composition of cells and visualisation of LDs. It was observed that CMECs did not exhibit the presence of lipid droplets, and most of the lipids in these cells were located in the endoplasmic reticulum around the nucleus. In contrast to CMECs, the H5V cells containing LDs widely spread within the cytoplasm. LDs of H5V cells were partially composed of unsaturated fatty acids.In addition, based on the comparison of the following features: the presence and location of lipid droplets, and shape and size of the nucleus, nucleoli, and the cell, we were able to identify primary cardiac endothelial cells in the early phase of their isolation, when they appear in the mixture containing other cardiac cells. This observation suggests that the confocal Raman imaging-based sorting technique might prove to be useful to relatively quickly recognize various types of primary cardiac cells.
In conclusion, the non-invasive, non-destructive and label-free nature of Raman imaging allowed us to characterise the spatially localized biochemical content of single primary cardiac endothelial cells isolated from the mice heart in comparison to other murine cardiac cells and the murine coronary endothelial cell line. Further studies are necessary to follow the analysis on a subcellular level and track the changes within selected organelles and other intra-cellular structures in primary endothelial cells isolated from the diseased heart that should provide a novel insight into the biochemical phenotype of coronary endothelial cells in heart disease.
Conflicts of interest
The authors declare that they have no competing interests.Acknowledgements
This work was supported by National Science Centre (Poland), grant Symfonia No. DEC-2015/16/W/NZ4/00070.All experiments were approved by the Local Ethics Committee of Jagiellonian University, in Krakow, Poland, and were compliant with the Guidelines for Animal Care and Treatment of the European Communities and the Guide for the Care and Use of Laboratory Animals published by the US National Institutes of Health (NIH Publication No. 85-23, revised 1996).
References
- J. Y. Kresh and J. A. Armour, Technol. Health Care, 1997, 5, 159–169 CAS.
- D. Tirziu, F. J. Giordano and M. Simons, Circulation, 2010, 122, 928–937 CrossRef PubMed.
- J. Li and F. W. Sellke, in Endothelial Biomedicine, ed. W. C. Aird, Cambridge University Press, Cambridge, 2017, pp. 602–608 Search PubMed.
- T. Aoyagi and T. Matsui, J. Cell Sci. Ther., 2011, S5, 1–3 Search PubMed.
- D. L. Brutsaert, Eur. Heart J., 1990, 11(Suppl G), 8–16 CrossRef PubMed.
- D. L. Brutsaert, Physiol. Rev., 2003, 83, 59–115 CrossRef CAS PubMed.
- V. F. M. Segers, D. L. Brutsaert and G. W. De Keulenaer, Front. Physiol., 2018, 9, 382 CrossRef PubMed.
- C. S. P. Lam and L. H. Lund, Heart, 2016, 102, 257–259 CrossRef CAS PubMed.
- C. N. Marti, M. Gheorghiade, A. P. Kalogeropoulos, V. V. Georgiopoulou, A. A. Quyyumi and J. Butler, J. Am. Coll. Cardiol., 2012, 60, 1455–1469 CrossRef CAS PubMed.
- B. Jug, B. G. Salobir, N. Vene, M. Šebeštjen, M. Šabovič and I. Keber, Heart Vessels, 2009, 24, 271–276 CrossRef PubMed.
- K. Klein, A. M. Gigler, T. Aschenbrenner, R. Monetti, W. Bunk, F. Jamitzky, G. Morfill, R. W. Stark and J. Schlegel, Biophys. J., 2012, 102, 360–368 CrossRef CAS PubMed.
- E. Brauchle and K. Schenke-Layland, Biotechnol. J., 2013, 8, 288–297 CrossRef CAS PubMed.
- F. Lyng, E. Gazi and P. Gardner, in Biomedical Applications of Synchrotron Infrared Microspectroscopy, 2011, pp. 147–185 Search PubMed.
- C. Krafft, T. Knetschke, R. H. W. Funk and R. Salzer, Vib. Spectrosc., 2005, 38, 85–93 CrossRef CAS.
- A. C. S. Talari, Z. Movasaghi, S. Rehman and I. ur Rehman, Appl. Spectrosc. Rev., 2015, 50, 46–111 CrossRef CAS.
- A. R. Boyd, L. L. McManus, G. A. Burke and B. J. Meenan, J. Mater. Sci. Mater. Med., 2011, 22, 1923–1930 CrossRef PubMed.
- K. Majzner, A. Kaczor, N. Kachamakova-Trojanowska, A. Fedorowicz, S. Chlopicki and M. Baranska, Analyst, 2013, 138, 603–610 RSC.
- S. W. Fogarty, I. I. Patel, F. L. Martin and N. J. Fullwood, PLoS One, 2014, 9, e106283 CrossRef PubMed.
- K. Kochan, E. Kus, A. Filipek, K. Szafrańska, S. Chlopicki and M. Baranska, Analyst, 2017, 142, 1308–1319 RSC.
- M. Baranska, A. Kaczor, K. Malek, A. Jaworska, K. Majzner, E. Staniszewska-Slezak, M. Z. Pacia, G. Zajac, J. Dybas and E. Wiercigroch, Pharmacol. Rep., 2015, 67, 736–743 CrossRef CAS PubMed.
- K. Czamara, K. Majzner, A. Selmi, M. Baranska, Y. Ozaki and A. Kaczor, Sci. Rep., 2017, 7, 1–10 CrossRef PubMed.
- M. Z. Pacia, E. Buczek, A. Blazejczyk, A. Gregorius, J. Wietrzyk, S. Chlopicki, M. Baranska and A. Kaczor, Anal. Bioanal. Chem., 2016, 408, 3381–3387 CrossRef CAS PubMed.
- M. Z. Pacia, L. Mateuszuk, E. Buczek, S. Chlopicki, A. Blazejczyk, J. Wietrzyk, M. Baranska and A. Kaczor, J. Raman Spectrosc., 2016, 47, 1310–1317 CrossRef CAS.
- K. Czamara, F. Petko, M. Baranska and A. Kaczor, Analyst, 2016, 141, 1390–1397 RSC.
- T. Geiger, A. Wehner, C. Schaab, J. Cox and M. Mann, Mol. Cell. Proteomics, 2012, 11, M111.014050 CrossRef PubMed.
- G. Kaur and J. M. Dufour, Spermatogenesis, 2012, 2, 1–5 CrossRef PubMed.
- A. T. C. C. S. Development Organization Workgroup ASN-0002, Nat. Rev. Cancer, 2010, 10, 441 CrossRef PubMed.
- C. Pan, C. Kumar, S. Bohl, U. Klingmueller and M. Mann, Mol. Cell. Proteomics, 2009, 8, 443–450 CrossRef CAS PubMed.
- K. Kochan, E. Kus, E. Szafraniec, A. Wislocka, S. Chlopicki and M. Baranska, Analyst, 2017, 142, 3948–3958 RSC.
- J. Dybas, M. Grosicki, M. Baranska and K. M. Marzec, Analyst, 2018, 143, 3489–3498 RSC.
- J. M. Surmacki, B. J. Woodhams, A. Haslehurst, B. A. J. Ponder and S. E. Bohndiek, Sci. Rep., 2018, 8, 12604 CrossRef PubMed.
- R. Smith, K. L. Wright and L. Ashton, Analyst, 2016, 141, 3590–3600 RSC.
- F. M. Marelli-Berg, E. Peek, E. A. Lidington, H. J. Stauss and R. I. Lechler, J. Immunol. Methods, 2000, 244, 205–215 CrossRef CAS PubMed.
- L. Leach, Y. Bhasin, P. Clark and J. A. Firth, Placenta, 1994, 15, 355–364 CrossRef CAS PubMed.
- J. R. van Beijnum, M. Rousch, K. Castermans, E. van der Linden and A. W. Griffioen, Nat. Protoc., 2008, 3, 1085 CrossRef CAS PubMed.
- T. Fujimoto and R. G. Parton, Cold Spring Harbor Perspect. Biol., 2011, 3, a004838 Search PubMed.
Footnote |
| † Electronic supplementary information (ESI) available. See DOI: 10.1039/c8an01308j |
| This journal is © The Royal Society of Chemistry 2018 |