Dual functional PDMS sponge SERS substrate for the on-site detection of pesticides both on fruit surfaces and in juice†
Ji
Sun
 a,
Lin
Gong
a,
Yuntao
Lu
a,
Dongmei
Wang
a,
Zhengjun
Gong
a and
Meikun
Fan
a,
Lin
Gong
a,
Yuntao
Lu
a,
Dongmei
Wang
a,
Zhengjun
Gong
a and
Meikun
Fan
 *ab
*ab
aFaculty of Geosciences and Environmental Engineering, Southwest Jiaotong University, Chengdu, 610031, China. E-mail: meikunfan@gmail.com
bState-province Joint Engineering Laboratory of Spatial Information Technology of High-Speed Rail Safety, Chengdu, 610031, China
First published on 8th May 2018
Abstract
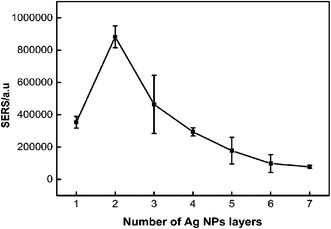
In this study, a versatile dual-functional polydimethylsiloxane (PDMS) sponge Surface Enhanced Raman Scattering (SERS) substrate has been fabricated for the on-site detection of pesticide residues both on the surface and in solution with minimum or no sample pretreatment. The PDMS sponge was fabricated using white granulated sugar and soft white sugar as pore-forming reagents. Later, multiple rounds of Ag NP deposition were performed by incubating the PDMS sponge in the Ag NP solution with the help of 3-mercaptopropyltrimethoxysilane (APTMS). The highest SERS enhancement was achieved through 2 rounds of Ag NP deposition. Under optimum conditions, with Rhodamine 6G (R6G) as the probe molecule, the limit of detection (LOD) reached 2 femtomoles (20 μL at a concentration of 100 pM). The analytical performance for potential on-site applications of the substrate has been demonstrated with pesticide-spiked agricultural products taken as examples. Without sample pretreatment, the pesticide triazophos and methyl parathion were successfully detected by swabbing on the fruit surface with LODs of 0.79 ng and 1.58 ng, respectively. In addition, the lowest detected concentrations of triazophos and methyl parathion in fruit juice were found to be 100 ppb and 1 ppm. More importantly, the PDMS sponge SERS substrate can be safely stored for 36 days without affecting its SERS activity.
1. Introduction
Pesticide residues in agricultural products have caught world-wide attention.1,2 It is said that approximately 4% of the vegetables and fruit imported exceeded the permitted values for pesticide residues in the United States every year.3 The key to shortening the time for assessment of potential damage is to provide real-time safety information on food from production to consumption,4 which in turn probably could save millions of dollars in the food industry (and even people's lives). Therefore, there has been an increasing demand for methods that are capable of performing fast, on-site detection and identification of various unwanted chemicals in foods.5,6At present, various techniques for the rapid analysis of pesticides on site have been reported, such as enzyme-linked immunosorbent assay (ELISA),7 enzyme inhibition8 and SERS.9,10 For SERS, the advantages are that the targets (such as pesticide residues) can be rapidly analyzed (a few seconds to a few minutes), and the sensitivity can be as low as the level of single molecules.11,12 In addition, the full width at half maximum of the SERS bands is approximately 1 nm, which makes it possible for different kinds of pollutants to be analyzed simultaneously and without interfering with each other.13 Thanks to these merits, SERS is in fact now being widely used in biomedical research,14 environmental monitoring,15 food safety,16 national security17 and other fields.
With the fast–growing interest in the use of SERS as a sensing technique, countless SERS substrates have been reported in the literature. The SERS substrates developed can probably be divided into the following two material development categories. The first category focuses on the enhancement and reproducibility of Raman signals by manipulating the properties of the substrate,18–21 such as the materials and combinations, sizes, shapes, and even assembled structures. On the other hand, the second category pays more attention to its adaptability for practical applications (such as on-site analysis). In other words, not only the SERS performance but also the sampling capability is becoming the substrate development goal. For example, various flexible SERS substrates have been reported. These include the flexible SERS substrates that can perform direct swab sampling from a surface, such as metallic NP modified filter paper,22 sandpaper,23 swabs17 and PDMS,24,25 and substrates that perform sampling through dabbing or simple coating, such as PVA,26,27 Ag-agar gel,28 and Ag-NC/PE.29 It is believed that the latter polymer-gel-based flexible SERS substrates have better sampling efficiencies due to their better capability of adapting to surfaces of different shapes and roughness.30
However, it is clear that the above application-oriented SERS substrate mainly focuses on surface analysis. In other words, the applicability of this type of substrate is limited. Using food-safety screening as an example, the reported flexible SERS substrates are probably good for screening illegal chemicals on the surfaces of raw agricultural products, such as fruits and vegetables, but not suitable for processed food products, such as juices. On the other hand, although there are SERS substrates that can perform onsite detection of diluted solution samples,31,32 they are not flexible so that they cannot be used for surface analysis. To the best of our knowledge, we are not aware of a report that shows SERS substrates that can perform both surface and dilute solution analysis, which would be otherwise preferred to fulfill the food-safety screening task of from field to kitchen.
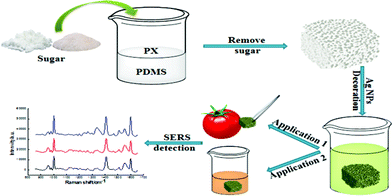
In the present work, we report the fabrication of a universal SERS substrate for on-site food-safety screening applications based on PDMS sponge modified with Ag NPs (Scheme 1). On one hand, the flexible porous PDMS sponge can be easily prepared by simple template method.33,34 In addition, the porous PDMS sponge can be used not only for surface sampling but also for absorption of analytes from liquid based on its flexibility and porous structures. On the other hand, the three dimensional structure of PDMS sponge has plenty of pores, resulting in large amount of absorbed Ag NPs, and hence more SERS hot spots. The pesticide residues on the surface of fruits and in the vegetable juice were detected almost with no or minimum pretreatment.
2. Experimental
2.1 Materials
Sylgard 184 Polydimethylsiloxane elastomer base and Sylgard 184 Polydimethylsiloxane elastomer curing agent were bought from Dow Corning Corporation (Michigan, USA). Silver nitrate (99%), sodium citrate (99%), 3-mercaptopropyltrimethoxysilane (APTMS), R6G, triazophos, methyl parathion, and methanol were purchased from Sigma-Aldrich (Shanghai, China). Paraxylene and ethanol were bought from Kelong Chemicals Co., Ltd (Chengdu, China). White granulated sugar and soft sugar were purchased from a local store (Chengdu, China). Ultrapure water (18.24 MΩ cm) was used through the experiment.2.2 Apparatus
All SERS measurements were implemented on a customized Raman microscope equipped with a Pixis-100BR CCD (Princeton Instruments, USA), Acton SP-2500i spectrograph and He–Ne laser (14 mW). An excitation wavelength of 632.8 nm and a 20× objective (N.A. = 0.45) were also used. The PDMS was activated in a Plasma oven (PDC-M, Chemical Instrument Co., Ltd, Suzhou, China). The Ag NPs and the PDMS sponge-SERS substrates were characterized by a UV-2600 (UV-2600, Japan) and a scanning electron microscope (SEM; Inspect F, FEI, USA). The sampling recovery efficiency was determined by high-performance liquid chromatography (HPLC, Waters 2695, USA), equipped with a LiChrospher®100 RP 18 column (4.6 mm × 250 mm, 5 μm, Merck), and UV-detector.2.3 Preparation of PDMS sponge
The PDMS sponge was prepared according to the literature.33 Specifically, 1 g PDMS elastomer base and 0.1 g curing agent were weighed and mixed in a beaker (25 mL). A total of 2.55 mL xylene was added followed by vigorous stirring. Later, a total weight of 1.8–9.8 g sugar granules (white granulated sugar/soft white sugar, 1![[thin space (1/6-em)]](https://www.rsc.org/images/entities/char_2009.gif) :
:![[thin space (1/6-em)]](https://www.rsc.org/images/entities/char_2009.gif) 1) was added to the solution and mixed thoroughly. Then, the beaker was allowed to stand in a 70 °C water bath for 12 h. Finally, the product was removed from the bath and rinsed with water (80 °C) to dissolve the sugar. Then, the PDMS sponge was heated in the vacuum oven at 70 °C for 2 h.
1) was added to the solution and mixed thoroughly. Then, the beaker was allowed to stand in a 70 °C water bath for 12 h. Finally, the product was removed from the bath and rinsed with water (80 °C) to dissolve the sugar. Then, the PDMS sponge was heated in the vacuum oven at 70 °C for 2 h.
2.4 Preparation of Ag NPs
Briefly, 0.017 g AgNO3 in 100 mL water was added to a conical flask (250 mL), and then brought to vigorous boiling with magnetic stirring (400 rpm (revolutions per min)). A total of 4 mL 1% (w/w) sodium citrate was quickly added to the flask. The heating was maintained for 1 h and the stirring continued till the solution cooled to room temperature. The UV-Vis spectrum of the Ag NPs later was recorded by a UV-Vis spectrophotometer.2.5 Preparation of APTMS solution and APTMS sol-gel35
Two types of APTMS solution were used. The 5% APTMS solution was prepared by using anhydrous ethanol as the solvent. For the APTMS sol–gel, briefly, 400 μL APTMS and 332 μL 0.1 mM HCl were added to 33 mL water. This solution should be intensely stirred for 1 h. The as-prepared APTMS solution and APTMS sol–gel all should be used in the same day.2.6 Preparation of PDMS sponge SERS substrate
The PDMS sponge was activated in a Plasma oven for 15 min before immersing into the APTMS solution. The as-prepared PDMS sponge was then soaked in 5% APTMS solution. It was sonicated for 10 s every 20 min in the first 2 h. After 10 h, the PDMS sponge was removed from the solution and successively washed with copious amounts of ethanol and water. Then, the PDMS sponge was immersed in the Ag NPs solution for 4 h for the first round of Ag NPs loading. Note that sonication was applied for 10 s every 30 min. Later, the sponge was removed from the solution, rinsed with water, and left in the APTMS sol–gel solution for another 30 min. Similarly, sonication was applied for 10 s every 10 min. Then, the next round of Ag NPs deposition was carried out till optimum SERS activity was achieved. The PDMS sponge-SERS substrates were characterized using a scanning electron microscope.2.7 SERS measurement
For the SERS experiment, the as-prepared PDMS sponges were cut into 0.5 × 0.5 × 0.5 cm3 cubes. Then, 20 μL of different concentrations (10 nM–100 pM) of ethanolic solutions of R6G were dropped onto the PDMS sponge cubes. The SERS measurements were then performed on a customized Raman microscope. Each spectrum presented in this work was the average of 10 spectra obtained at random positions on the same sample.For the detection of pesticides on glass, the glass was washed twice with anhydrous ethanol and water and then dried in air. In all, 10 μL of different concentrations of triazophos and 20 μL of methyl parathion in methanol were dropped on the clean glass slide, respectively. Once dry, 5 μL methanol was dropped on the same spot. The PDMS sponge was applied immediately to the surface to recover the pesticides. For the spiked fruit samples, 10 μL of different concentrations of triazophos or 20 μL methyl parathion in methanol were dropped on the clean surfaces of cherry tomatoes or plums, respectively. Once dry, 5 μL methanol was dropped on the same spot before applying the PDMS sponge to recover the pesticides. For spiked samples in juice, different concentrations of triazophos and methyl parathion dispersed in methanol were spiked into the carrot juice. The spiked sample then was filtered through filter paper. The PDMS sponge then was cut into the same small pieces and soaked in the juice for 30 min with occasional manual shaking. Then, the PDMS sponge-SERS substrate was removed from the juice and used for Raman detection.
2.8 HPLC analysis
Inspired by the ref. 36, 20 μL of 20 ppm triazophos in methanol was dropped on the surface of cherry tomatoes. Once dry, 5 μL methanol was dropped on the same spot. The PDMS sponge SERS substrate then was immediately applied to the surface to recover the pesticides. Finally, the sponge was placed in a small beaker filled with 1 mL of methanol and sonicated for 20 min to extract the pesticide. Then, the mixture was filtered through a 0.45 μm microporous membrane before HPLC analysis. Three parallel detections were performed. A similar procedure was followed for the analysis of pesticides on the plum. The experimental conditions for the HPLC analysis can be found in the ESI.†2.9 Data analysis
The LOD of R6G was calculated using the following formula (eqn (1)):| LOD = V × C (mole). | (1) |
The volume of R6G was recorded as V. The molar concentration of R6G was recorded as C.
The LOD of pesticides were calculated using the following formula (eqn (2)):
| LOD = V × C × ρ (g). | (2) |
The volume of pesticides was recorded as V. The mass concentration of pesticides was recorded as C. The density of the solvent used to dilute the pesticide was recorded as ρ.
The sampling efficiency (SE) of triazophos on the surfaces of cherry tomatoes and plum were calculated using the following formula (eqn (3)):
 | (3) |
The amounts of triazophos detected on the surface of the fruit (cherry tomatoes and plums) were recorded as M1, and the absolute amount (spiked amount) of triazophos on the surface of the fruit were recorded as M2.
3. Results and discussion
3.1 Optimization of SERS performance
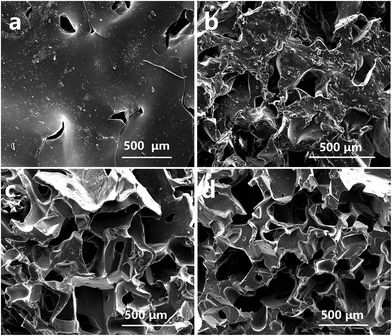 | ||
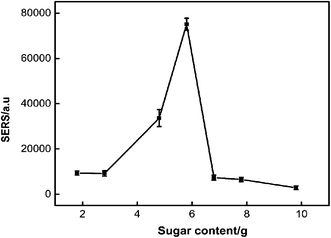
| Fig. 1 a–d SEM images of the structure of PDMS-SERS substrate prepared with different amounts of sugar (1.8 g, 3.8 g, 5.8 g, 7.8 g), respectively. | ||
3.2 SERS Performance of the substrate
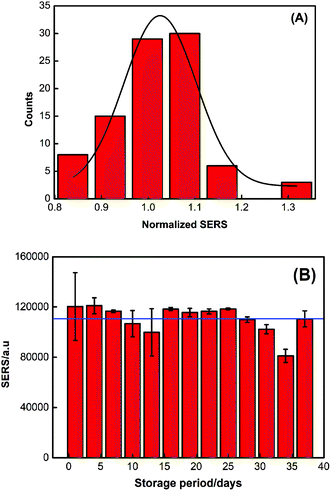
The shelf life of the PDMS sponge-SERS substrate was also examined. The SERS data was collected every three days, and the results were listed in Fig. 4B. It can be seen from Fig. 4B that although there are variations in the day-to-day measurement, the data does not deviate far from average (RSD of ∼10.4%). In other words, the 36 days of storage does not affect the repeatability of the substrate.
3.3 SERS spectra of triazophos
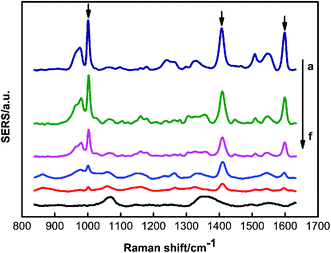
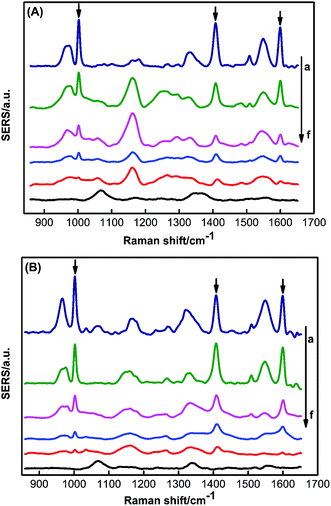
To verify the sensitivity of the PDMS sponge-SERS substrate for the pesticide, triazophos on the glass surface was analyzed. Fig. 5 represented the SERS spectra of different concentrations of triazophos on the surface of the glass. Fig. S4 (ESI†) showed the SERS spectra of different concentrations of methyl parathion on the surface of the glass. The results showed the LOD of triazophos and methyl parathion on the surface of glass were 0.79 ng and 1.58 ng, respectively.To verify the performance of a practical application of the PDMS sponge SERS substrate, triazophos on different fruit surfaces and in carrot juice were analyzed. Fig. 6A and B represent the SERS spectra of different concentrations of triazophos on the surfaces of cherry tomatoes and plum, respectively. Fig. S5A and B (ESI†) showed the SERS spectra of different concentrations of methyl parathion on the surface of Cherry Tomatoes and Plum, respectively. Obviously, the LOD of triazophos on the surface of Cherry Tomatoes and Plum were 0.79 ng, and the LOD of and methyl parathion on the surface of Cherry Tomatoes and Plum were 1.58 ng. The sampling efficiency of triazophos on the surfaces of cherry tomatoes and plum was 50.1% and 43.7%, respectively (ESI†).
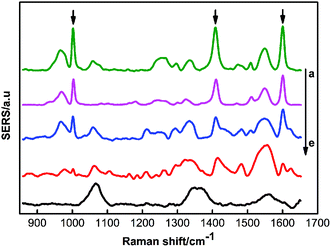
Fig. 7 demonstrated the SERS spectra of different concentrations of triazophos in the carrot juice. Also note that the lowest detection concentration of triazophos in the carrot juice was 100 ppb. Fig. S7 (ESI†) showed SERS spectra of different concentrations of methyl parathion in the carrot juice. Obviously, the lowest detection concentration of methyl parathion in the carrot juice was 1 ppm.
4. Conclusions
In this report, a dual-functional SERS substrate with a three-dimensional porous structure was fabricated for the detection of pesticides on fruit surfaces and in juice. Under optimum conditions, with R6G as the probe, the LOD reached 2 femtomoles. The spatial variation of the substrate was found to be ∼10% (RSD), and it could be safely stored for at least 36 days. In addition, carrot juice and two kinds of fruits which had all been spiked with triazophos were analyzed. The results showed that the LOD of the triazophos on the surface of fruits was 0.79 ng. The lowest concentration of the triazophos detected in the carrot juice was 100 ppb. For the surface detection, no pretreatment of the samples is needed. For the juice, only simple filtration was performed before SERS analysis. We believe this substrate may find great potential in the future for on-site food-safety screening.Conflicts of interest
There are no conflicts to declare.Acknowledgements
The authors are thankful for the financial support from the National Natural Science Foundation of China (no. 21677117), Science and Technology Project of Sichuan Province (no. 2017GZ0388).Notes and references
- M. Anastassiades, S. J. Lehotay, D. Stajnbaher and F. J. Schenck, J. AOAC Int., 2003, 86, 412–431 Search PubMed.
- C. A. Damalas and I. G. Eleftherohorinos, Int. J. Environ. Res. Public Health, 2011, 8, 1402–1419 CrossRef PubMed.
- C. Shende, F. Inscore, A. Sengupta, J. Stuart and S. Farquharson, Sens. Instrum. Food Qual. Saf., 2010, 4, 101–107 CrossRef.
- R. H. Farahi, A. Passian, L. Tetard and T. Thundat, ACS Nano, 2012, 6, 4548–4556 CrossRef PubMed.
- C. H. Lee, M. E. Hankus, L. Tian, P. M. Pellegrino and S. Singamaneni, Anal. Chem., 2011, 83, 8953–8958 CrossRef PubMed.
- J. F. Li, Y. F. Huang, Y. Ding, Z. L. Yang, S. B. Li, X. S. Zhou, F. R. Fan, W. Zhang, Z. Y. Zhou, D. Y. Wu, B. Ren, Z. L. Wang and Z. Q. Tian, Nature, 2010, 464, 392–395 CrossRef PubMed.
- E. Watanabe, S. Miyake and Y. Yogo, J. Agric. Food Chem., 2013, 61, 12459–12472 CrossRef PubMed.
- A. Amine, H. Mohammadi, I. Bourais and G. Palleschi, Biosens. Bioelectron., 2006, 21, 1405–1423 CrossRef PubMed.
- W. Xu, X. Ling, J. Xiao, M. S. Dresselhaus, J. Kong, H. Xu, Z. Liu and J. Zhang, Proc. Natl. Acad. Sci. U. S. A., 2012, 109, 9281–9286 CrossRef PubMed.
- T. Yang, Z. Zhang, B. Zhao, R. Hou, A. Kinchla, J. M. Clark and L. He, Anal. Chem., 2016, 88, 5243–5250 CrossRef PubMed.
- S. Nie, Science, 1997, 275, 1102–1106 CrossRef PubMed.
- M. Fan, G. F. Andrade and A. G. Brolo, Anal. Chim. Acta, 2011, 693, 7–25 CrossRef PubMed.
- M. K. Fan, P. H. Wang, C. Escobedo, D. Sinton and A. G. Brolo, Lab Chip, 2012, 12, 1554–1560 RSC.
- R. A. Alvarez-Puebla and L. M. Liz-Marzan, Small, 2010, 6, 604–610 CrossRef PubMed.
- M. K. Fan, F. S. Cheng, C. Wang, Z. J. Gong, C. Y. Tang, C. Z. Man and A. G. Brolo, Chem. Commun., 2015, 51, 1965–1968 RSC.
- C. P. Yao, F. S. Cheng, C. Wang, Y. H. Wang, X. W. Guo, Z. J. Gong, M. K. Fan and Z. Y. Zhang, Anal. Methods, 2013, 5, 5560–5564 RSC.
- Z. J. Gong, H. J. Du, F. S. Cheng, C. Wang, C. C. Wang and M. K. Fan, ACS Appl. Mater. Interfaces, 2014, 6, 21931–21937 Search PubMed.
- H.-X. Lin, J.-M. Li, B.-J. Liu, D.-Y. Liu, J. Liu, A. Terfort, Z.-X. Xie, Z.-Q. Tian and B. Ren, Phys. Chem. Chem. Phys., 2013, 15, 4130–4135 RSC.
- P. G. Etchegoin, Phys. Chem. Chem. Phys., 2009, 11, 7348–7349 RSC.
- K. Kneipp, Y. Wang, H. Kneipp, L. T. Perelman, I. Itzkan, R. R. Dasari and M. S. Feld, Phys. Rev. Lett., 1997, 78, 1667 CrossRef.
- M. Moskovits, Rev. Mod. Phys., 1985, 57, 783 CrossRef.
- C. H. Lee, L. M. Tian and S. Singamaneni, ACS Appl. Mater. Interfaces, 2010, 2, 3429–3435 Search PubMed.
- M. K. Fan, Z. G. Zhang, J. M. Hu, F. S. Cheng, C. Wang, C. Y. Tang, J. H. Lin, A. G. Brolo and H. Q. Zhan, Mater. Lett., 2014, 133, 57–59 CrossRef.
- X. Lin, W. L. J. Hasi, S. Han, X. T. Lou, D. Y. Lin and Z. W. Lu, Phys. Chem. Chem. Phys., 2015, 17, 31324–31331 RSC.
- H. R. Zhan, F. S. Cheng, Y. Q. Chen, K. W. Wong, J. Mei, D. Hui, W. M. Lau and Y. Liu, Composites, Part B, 2016, 84, 222–227 CrossRef.
- R. M. Li, M. Z. Si, Y. P. Kang, X. F. Zi, Z. Q. Liu and D. Q. Zhang, J. Colloid Interface Sci., 2010, 343, 52–57 CrossRef PubMed.
- Z. Gong, C. Wang, C. Wang, C. Tang, F. Cheng, H. Du, M. Fan and A. G. Brolo, Analyst, 2014, 139, 5283–5289 RSC.
- C. Lofrumento, M. Ricci, E. Platania, M. Becucci and E. Castellucci, J. Raman Spectrosc., 2013, 44, 47–54 CrossRef.
- N. Zhou, G. Meng, Z. Huang, Y. Ke, Q. Zhou and X. Hu, Analyst, 2016, 141, 5864–5869 RSC.
- A. Raza and B. Saha, Forensic Sci. Int., 2013, 233, 21–27 CrossRef PubMed.
- S. Fateixa, S. F. Soares, A. L. Daniel-da-Silva, H. I. Nogueira and T. Trindade, Analyst, 2015, 140, 1693–1701 RSC.
- K. Shin and H. Chung, Analyst, 2015, 140, 5074–5081 RSC.
- A. Zhang, M. Chen, C. Du, H. Guo, H. Bai and L. Li, ACS Appl. Mater. Interfaces, 2013, 5, 10201–10206 Search PubMed.
- S. J. Choi, T. H. Kwon, H. Im, D. I. Moon, D. J. Baek, M. L. Seol, J. P. Duarte and Y. K. Choi, ACS Appl. Mater. Interfaces, 2011, 3, 4552–4556 Search PubMed.
- M. Fan and A. G. Brolo, Phys. Chem. Chem. Phys., 2009, 11, 7381–7389 RSC.
- P. Wang, L. Wu, Z. Lu, Q. Li, W. Yin, F. Ding and H. Han, Anal. Chem., 2017, 89, 2424–2431 CrossRef PubMed.
- Q. Tan, S. Li, J. Ren and C. Chen, Int. J. Mol. Sci., 2011, 12, 890–904 CrossRef PubMed.
- M. Chen, I. Y. Phang, M. R. Lee, J. K. Yang and X. Y. Ling, Langmuir, 2013, 29, 7061–7069 CrossRef PubMed.
- C. J. Addison and A. G. Brolo, Langmuir, 2006, 22, 8696–8702 CrossRef PubMed.
- A. A. Jabbar, A. M. Alwan and A. J. Haider, Plasmonics, 2017, 1–12 Search PubMed.
- G. Wei, H. Zhou, Z. Liu and Z. Li, Appl. Surf. Sci., 2005, 240, 260–267 CrossRef.
Footnote |
| † Electronic supplementary information (ESI) available. See DOI: 10.1039/c8an00476e |
| This journal is © The Royal Society of Chemistry 2018 |

