 Open Access Article
Creative Commons Attribution 3.0 Unported Licence
A luminescent metal–organic framework as an ideal chemosensor for nitroaromatic compounds†
Hongming Hea,
Si-Hang Chena,
De-Yu Zhanga,
En-Cui Yang *a and
Xiao-Jun Zhao
 *ab
*ab
aKey Laboratory of Inorganic–Organic Hybrid Functional Material Chemistry, Ministry of Education, Tianjin Key Laboratory of Structure and Performance for Functional Molecules, College of Chemistry, Tianjin Normal University, Tianjin 300387, P. R. China. E-mail: encui_yang@163.com; xiaojun_zhao15@163.com; Fax: +86-22-23766556
bDepartment of Chemistry, Collaborative Innovation Center of Chemical Science and Engineering, Nankai University, Tianjin 300071, P. R. China
First published on 8th August 2017
Abstract
A luminescent two-dimensional metal–organic framework, [(Pr2(TATMA)2)·4DMF·4H2O]n (1), was solvothermally synthesized based on the semi-rigid organic ligand 4,4′,4′′-s-triazine-1,3,5-triyltri-m-aminobenzoate (H3TATMA). 1 possesses binuclear {Pr2(COO)6} subunits and fully deprotonated TATMA3− organic ligands, which can be further simplified into a 3,6-connected kgd topology with the Schläfli symbol of (43)2(46·66·83). More importantly, 1 displays fast and reversible solid-state detection of nitroaromatic compounds, especially for TNP, via a luminescence response.
Introduction
Nitroaromatic compounds (NACs) are common toxic and hazardous chemicals, which should not be neglected in our daily life. To date, NACs have been extensively used in many fields including industry, agriculture, and military. Due to its extensive use and difficulty in degradation, it triggers a series of security and environmental issues.1 Hence, it is vitally important to effectively detect NACs for homeland security and environmental protection. It is noteworthy that 2,4,6-trinitrophenol (TNP) is the most common nitro explosive, which possesses stronger explosive force as compared to other nitro explosives. In addition, TNP is also widely applied in the fireworks, industrial dye, and leather fields. Due to its frequent and excessive use, a large number of PAs are released into the environment; this leads to a series of serious health complications including genovariation, respiratory infection, and anemia. Thus, it is particularly important to efficiently detect TNP among all the NACs.Metal–organic frameworks (MOFs)2–5 can be considered as a new class of fascinating porous crystalline materials, which have attracted significant attention in the past few decades. Due to their intriguing varieties of architectures, high surface areas, and tunable structures, MOFs have emerged as promising materials with a wide range of potential applications. Among them, luminescent MOFs,6–14 as fast-growing organic–inorganic hybrid luminescent crystalline materials, have received significant attention for the detection of hazardous substances because luminescent MOFs have the unique advantage of functional diversity. Luminescent MOFs are composed of two different parts: metal ions/clusters and organic bridging ligands, which can be considered as light-emitting sources. Numerous factors, including metal ion, organic ligand, temperature, and solvent system, can affect the structural assembly process and luminescent properties of these luminescent MOFs.15–18 Among them, the organic ligand plays the most important role in adjusting their structure and functionality. Recently, extensive efforts have been focused on the design of novel semi-rigid tritopic ligands such as 1,3,5-tri(4-carboxyphenoxy)benzene19–21 and 1,3,5-tri(4-(2H-tetrazol-5-yl)phenoxy) benzene.22 These ligands can be widely applied to construct MOFs due to their intriguing architectures and remarkable properties. On the other hand, the functional luminescent ligands not only can be used to construct luminescent MOFs, but also contain functional groups to enhance the recognition effect of ions, solvents, and small molecules. Hence, triazines as functional groups can be designed and synthesized to form luminescent MOFs as sensors because they generate interactions between guest molecules and the MOF skeleton to affect their luminescent properties. Motivated by the abovementioned aspects, our research strategy has evolved as follows. Considering that triazines can serve as a hydrogen-bonding recognition group, we introduced it into semi-rigid tritopic ligands, which can serve as a luminescent emitting source for the detection of toxic and harmful substances. Recently, some luminescent MOFs based on semi-rigid tritopic ligands have been prepared as sensors. For example, Zhang et al. reported a two-dimensional (2D) Eu-MOF, [Eu(L)(H2O)2]·NMP·H2O (H3L = 4,4′,4′′-s-triazine-1,3,5-triyltri-m-aminobenzoate).23 The resultant sample can detect Fe2+/Fe3+ cations and exhibit high sensitivity for Cr2O72− anions. Qian et al. have reported a Ln-MOF, Tb(TATAB)·(DMF)4·(H2O)·(MeOH)0.5 (H3TATAB = 4,4′,4′′-s-triazine-1,3,5-triyltri-p-aminobenzoic acid), which exhibits high selectivity for Hg2+ ions.24 However, no previous investigations have reported the use of these MOFs as sensors for NACs besides a zeolitic MOF, (Me2NH2)·[Zn2L]·3.5DMF (H5L = 2,5-(6-(4-carboxyphenylamino)-1,3,5-triazine-2,4-diyl-diimino)diterephthalic acid).25 Evidently, it is a big challenge to generate novel luminescent MOFs with these ligands to detect the NACs.
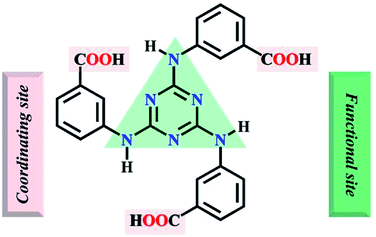
Herein, the semi-rigid ligand 4,4′,4′′-s-triazine-1,3,5-triyltri-m-aminobenzoate (H3TATMA, Scheme 1) was utilized for self-assembly with inorganic Pr(III) ions. Acting as a functional organic ligand, H3TATMA contains triazines as functional sites and –COOH groups as coordinating sites. Interestingly, the solvothermal reaction generates a 2D luminescent MOF (namely 1) with the kgd topology. The resultant sample was able to detect NACs, especially TNP, via luminescent quenching.
Experimental
Materials and methods
All solvents and chemical reagents for syntheses were purchased from commercial sources and used without purification. H3TATMA was successfully prepared according to the reported literature.15 Room-temperature powder X-ray diffraction (PXRD) spectra were obtained using a Rigaku D/Max-2500 diffractometer with a Cu-target tube (λ = 1.5418 Å) at 40 kV and 100 mA in the 2θ range from 4 to 40°. Thermogravimetric analyses (TGA) were conducted using a Perkin-Elmer TGA thermogravimetric analyser at the heating rate of 10 °C min−1 in the range of 30–800 °C under an air flow. Elemental analyses (C, H, and N) were conducted using a Perkin-Elmer 240 analyzer. Fourier-transform infrared spectra (FT-IR) were obtained via a Nicolet Impact 410 FT-IR spectrometer using KBr pellets in the range of 4000–400 cm−1. All room-temperature luminescent measurements were performed using a Fluoromax-4 spectrofluorometer. All liquid UV-vis data were obtained using a UV-2450 machine.Synthesis of [Pr2(TATMA)2·4DMF·4H2O]n (1)
A mixture of Pr(NO3)3·6H2O (35 mg, 0.08 mmol), H3TATMA (20 mg, 0.04 mmol), N,N-dimethylformamide (DMF, 4 mL), H2O (1.3 mL), and aqueous HNO3 solution (2 M, 0.12 mL) was sealed in a 20 mL capped vessel was and stirred for 5 min at room temperature. The vessel was heated at 85 °C for 3 days and then allowed to cool to room temperature. Block crystals of 1 were obtained by filtration, washing with fresh DMF (3 × 5 mL), and drying in air. Yield: 68% (based on H3TATMA). FT-IR (KBr): 3422 (br), 1654 (s), 1622 (s), 1516 (s), 1402 (s), 1356 (s), 1242 (s), 1101 (s), 935 (s), 811 (s), 763 (s), 664 (s), 595(s), 415 (s) (Fig. S1†). Anal. calcd for C60H66O20N16Pr2: C 44.67, H 4.09, N 13.90%; found: C 44.75, H 4.17, N 14.01%.X-ray structure determination and structure refinement
The crystallographic data for 1 was obtained using a Bruker SMART APEX II CCD with Mo-Kα radiation (λ = 0.71073 Å) at room temperature. The SADABS program was applied to correct the incident and diffracted absorption effects.26 The structures were successfully solved by the direct methods and further refined by the full matrix least-squares against F2 values using the SHELXTL package.27 All the non-hydrogen atoms can be located from the Fourier maps and further refined by anisotropic thermal parameters. Since many disordered molecules exist in the structure of 1, their corresponding diffraction data can be removed using the PLATON/SQUEEZE route.28,29 The solvent molecules were determined from the TGA data and elemental analyses (C, H, and N). The crystallographic data and structure processing parameters for 1 are summarized in Table 1, and the selected bond lengths and bond angles are listed in Table S1.†| Compound | 1 |
| Empirical formula | C60H66O20N16Pr2 |
| Formula weight | 1612 |
| Crystal system | Monoclinic |
| Space group | Cc |
| a (Å) | 24.8728 (13) |
| b (Å) | 14.1665 (8) |
| c (Å) | 22.8202 (12) |
| β (°) | 97.374 (2) |
| V (Å3) | 7974.4 (7) |
| Z | 4 |
| ρcalc (g cm−3) | 1.093 |
| μ (mm−1) | 1.260 |
| Nref | 14![[thin space (1/6-em)]](https://www.rsc.org/images/entities/char_2009.gif) 286 286 |
| F(000) | 2592.0 |
| R(int) | 0.0652 |
| Goodness-of-fit on F2 | 0.980 |
| R1, wR2 [I > 2σ(I)] | 0.0507, 0.1073 |
| R1, wR2 (all data) | 0.0693, 0.1181 |
Results and discussion
Crystal structure
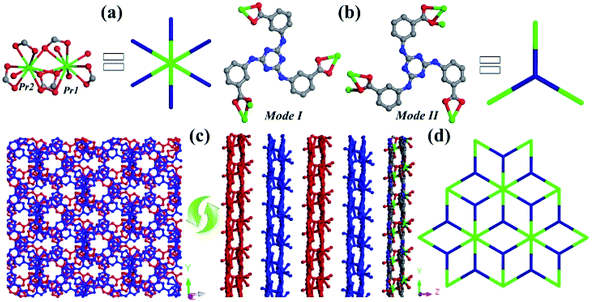
Single-crystal X-ray diffraction analysis reveals that 1 crystallizes in the monoclinic Cc space group and exhibits a 2D layered structure with binuclear {Pr2(COO)6} subunits extended by three-connected TATMA3− ligands. The asymmetric unit of 1 contains two crystallographically independent Pr3+ cations, two deprotonated TATMA3− ligands, and four coordinated oxygen atoms (Fig. S2†). As shown in Fig. 1a, the Pr1 cation is ten coordinated by seven oxygen atoms (Pr1–O = 2.494–2.807 Å) from four carboxylate groups of TATMA3− ligands and three coordinated oxygen atoms. The Pr2 cation is bound with nine oxygen atoms (Pr2–O = 2.451–2.648 Å) from three chelating, two bridging carboxylate moieties of TATMA3− ligands and one coordinated oxygen atom. The unique Pr1 and Pr2 ions are bridged via three carboxylate groups to form a binuclear {Pr2(COO)6} subunit. As shown in Fig. 1b, the TATMA3− ligands show μ1–η1:η1, μ1–η1:η1, and μ2–η1:η2 coordination modes in mode I, and μ1–η1:η1, μ2–η1:η2, and μ2–η1:η2 coordination mode II. Moreover, the ratio of the two coordination modes in 1 is 1![[thin space (1/6-em)]](https://www.rsc.org/images/entities/char_2009.gif) :
:![[thin space (1/6-em)]](https://www.rsc.org/images/entities/char_2009.gif) 1 (mode I:mode II). Each TATMA3− ligand is connected to three {Pr2(COO)6} subunits to generate a 2D layer. The different layers can be further packed together in an ABAB fashion (Fig. 1c). Topologically, the {Pr2(COO)6} subunit and TATMA3− ligand can be considered as 6-connected and 3-connected nodes, respectively. Thus, 1 can be simplified into a 3,6-connected kgd topology with the Schläfli symbol of (43)2(46·66·83) (Fig. 1d).22,30
1 (mode I:mode II). Each TATMA3− ligand is connected to three {Pr2(COO)6} subunits to generate a 2D layer. The different layers can be further packed together in an ABAB fashion (Fig. 1c). Topologically, the {Pr2(COO)6} subunit and TATMA3− ligand can be considered as 6-connected and 3-connected nodes, respectively. Thus, 1 can be simplified into a 3,6-connected kgd topology with the Schläfli symbol of (43)2(46·66·83) (Fig. 1d).22,30
FT-IR spectra, PXRD, TGA analysis
The FT-IR spectra of 1 exhibit strong and broad bands at 3422 cm−1, which should be attributed to the stretching vibrations of –OH. The characteristic peak at 1694 cm−1 in the organic ligand H3TATMA should be ascribed to the carbonyl asymmetric stretching band (C![[double bond, length as m-dash]](https://www.rsc.org/images/entities/char_e001.gif) O) of –COOH. However, this characteristic peak at 1694 cm−1 is not present in the spectrum of 1; this implies that all the carboxyl groups of the ligand are deprotonated. The characteristic multiple bands for the asymmetric (vas) and symmetric (vs) stretching vibrations of the carboxylate group are observed between 1654 and 1402 cm−1, and their different separations (Δv = vas − vs) suggest the various coordination modes of the carboxylate groups (Fig. S1†). In addition, the room-temperature PXRD patterns of the resultant crystals of 1 demonstrate the phase purity of a large number of crystal samples (Fig. S3†). Furthermore, the PXRD patterns analyses indicate that 1 can retain high crystallinity after being soaked in DMF and kept in air for one week; this suggests that the layered structure possesses good stability (Fig. S3†). The TGA data of the crystals of 1 (Fig. S4†) exhibits a slow weight loss of 23.32% before 250 °C, which corresponds to the loss of guest molecules (calculated to be 23.68%). The framework starts to collapse and decompose with an increase in temperature. The residue is Pr2O3 (expt: 20.32%; calcd: 20.42%).
O) of –COOH. However, this characteristic peak at 1694 cm−1 is not present in the spectrum of 1; this implies that all the carboxyl groups of the ligand are deprotonated. The characteristic multiple bands for the asymmetric (vas) and symmetric (vs) stretching vibrations of the carboxylate group are observed between 1654 and 1402 cm−1, and their different separations (Δv = vas − vs) suggest the various coordination modes of the carboxylate groups (Fig. S1†). In addition, the room-temperature PXRD patterns of the resultant crystals of 1 demonstrate the phase purity of a large number of crystal samples (Fig. S3†). Furthermore, the PXRD patterns analyses indicate that 1 can retain high crystallinity after being soaked in DMF and kept in air for one week; this suggests that the layered structure possesses good stability (Fig. S3†). The TGA data of the crystals of 1 (Fig. S4†) exhibits a slow weight loss of 23.32% before 250 °C, which corresponds to the loss of guest molecules (calculated to be 23.68%). The framework starts to collapse and decompose with an increase in temperature. The residue is Pr2O3 (expt: 20.32%; calcd: 20.42%).
Luminescent and sensing properties
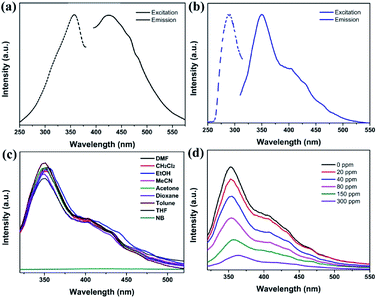
The solid luminescent properties of the free H3TATMA ligand and 1 were determined at room temperature. The excitation and emission spectra of crystals of 1 dispersed in DMF were studied and have been discussed because it is insoluble and retains its structure in DMF well. It exhibits an excitation band at 292 nm, and displays luminescence with an emission band at 350 nm (Fig. 2a). In contrast, the maximum excitation and emission wavelengths of the H3TATMA ligand in DMF are at 357 nm and 426 nm, respectively (Fig. 2b). These results indicate that the luminescent property of 1 is mostly attributed to the emission of the organic linker. The spectral blue-shift is mainly due to the coordination of the TATMA3− ligand to the central Pr3+ ion. It leads to less vibrations of the skeleton and reduces the loss of energy via radiationless decay of the intraligand emission excited state.31,32To investigate the luminescent sensing ability of 1, the emission spectra of the ground crystal powder of 1 dispersed in DMF with 600 ppm of different analytes were obtained under excitation at 292 nm due to its insolubility and highly luminescent intensity in DMF (Fig. 2c). It is noteworthy that the luminescent intensities of 1 are significantly dependent on the different solvents. Interestingly, 1 exhibits significant luminescent quenching behaviour in nitrobenzene (NB).33,34 To further monitor its luminescent response to NB, 1 was titrated with NB at different concentrations in a DMF solution at room temperature (Fig. 2d). The results show that the emission intensity of 1 decreases continuously with an increase in NB concentration.
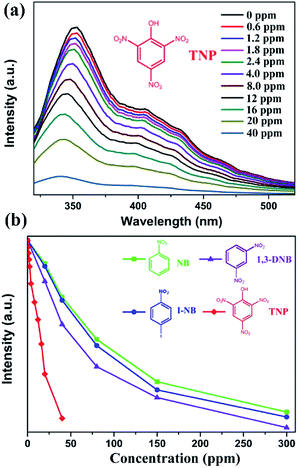
As discussed above, the luminescent quenching behaviour of the resultant sample is mainly related to the electron-withdrawing –NO2 group. Hence, we further investigated the luminescent quenching behaviour of 1 to detect a series of NACs including 1-iodo-4-nitrobenzene (I-NB), 1,3-dinitrobenzene (1,3-DNB), and TNP. The luminescent quenching behaviour was monitored by luminescence spectroscopy (λex = 292 nm) when different amounts of analytes were added to the DMF solution (Fig. S5†). As shown in Fig. 3 and S6,† the results indicate that TNP is the most effectively detected NAC due to the presence of three nitro groups in it. With an increase in the amount of –NO2 groups, electron transfer becomes much easier; this leads to a more effective luminescent quenching performance.35–37 Moreover, there is a considerable degree of overlap between the absorption band of TNP and the emission spectrum of 1 in DMF (Fig. S7†). In addition, the N atoms in the TATMA3− ligand can provide hydrogen-bonding interactions with the highly acidic phenol group (–OH) of TNP. The hydrogen-bonding interactions play an important role as electron-transfer bridges to improve the high selectivity of TNP.34–36 As abovementioned, the nature of the quenching mechanism may be mainly attributed to a combination of multiple factors including competitive absorption, electron transfer, and hydrogen-bonding interactions. However, further research is still needed to confirm the accurate process. As shown in Fig. S3,† the PXRD results exhibit that the original framework of 1 is still well retained after the testing experiments for the NACs.
The corresponding quenching efficiency is quantitatively given by the Stern–Volmer equation: I0/I = 1 + KSV[Q], where I0 is the origin luminescent intensity without any analyte, I is the corresponding luminescent intensity after the addition of different amounts of the analyte as quencher, [Q] is the molar concentration of the quenching constant (M−1), and KSV is the Stern–Volmer constant. If the plots of I0/I vs. [Q] plot are approximately linear, the Stern–Volmer constant (KSV) can be determined precisely. The corresponding Stern–Volmer plots for all the NACs are almost linear at low concentrations (Fig. S8†), but the subsequent plots deviate from linearity at higher concentrations (Fig. S9†). This performance may be caused by the self-absorption phenomenon.38–43 The Stern–Volmer constants (KSV) are 4.1 × 10³ M−1 for NB, 5.0 × 10³ M−1 for I-NB, 6.1 × 10³ M−1 for 1,3-DNB, and 1.6 × 10⁴ M−1 for TNP. As shown in Table 2, the corresponding KSV of TNP is higher than those of some previously reported MOFs such as [Eu2(L1)1.5(H2O)2EtOH]·DMF (2.0 × 10³ M−1),44 [Eu2(TDC)3(CH3OH)2]·CH3OH (1.1 × 10⁴ M−1),45 Zn2(H2L)2(Bpy)2(H2O)3·H2O (1.36 × 10⁴ M−1),46 and [Cd(IPA)(L)] (1.52 × 10⁴ M−1).47 However, the value is lower than those of some luminescent MOFs such as [Cd4(hbhdpy)2(bdc)3(DMA)2]·(H2O)4 (2.5 × 10⁴ M−1)49 and [Tb(L)1.5(H2O)]·3H2O (7.47 × 10⁴ M−1).50
| MOF | Medium | KSV/M−1 |
|---|---|---|
| a L1 = 5,5′-(carbonylbis(azanediyl))diisophthalate, TDC = thiophene-2,5-dicarboxylate, Bpy = 4,4′-bipyridine, L2 = 3-pyridylcarboxaldehyde nicotinoylhydrazone, IPA = Isophthalate, bpydb = 4,4′-(4,4′-bipyridine-2,6-diyl)dibenzoate, hbhdpy = 4-(2-hydroxy-3-methoxy-benzyli-dene-hydrazinocarbonyl)-N-pyridin-4-yl-benzamide, L3 = 2-(2-acetoxy-propionylamino)-terephthalate, H2bdc = 1,4-dicarboxybenzene, H2bdc–NH2 = 2-aminoterephthalic acid, DMF = N,N′-dimethylformamide, DMA = N,N′-dimethylacetamide. | ||
| [Eu2(L1)1.5(H2O)2EtOH]·DMF44 | DMF | 2.0 × 10³ |
| [Eu2(TDC)3(CH3OH)2]·CH3OH45 | Methanol | 1.1 × 10⁴ |
| [Zn2(H2L)2(Bpy)2(H2O)3]·H2O46 | Water | 1.36 × 10⁴ |
| [Cd(IPA)(L2)]47 | 1.52 × 10⁴ | |
| [Pr2(TATMA)2·4DMF·4H2O] | DMF | 1.6 × 10⁴ |
| [Eu3(bpydb)3(HCOO)(μ3-OH)2(DMF)](DMF)3(H2O)2 (ref. 48) | Water | 2.1 × 10⁴ |
| [Cd4(hbhdpy)2(bdc)3(DMA)2]·(H2O)4 (ref. 49) | DMA | 2.5 × 10⁴ |
| [Cd4(hbhdpy)2(bdc-NH2)3(DMA)2]·(H2O)4 | 4.8 × 10⁴ | |
| [Tb(L3)1.5(H2O)]·3H2O50 | Water | 7.47 × 10⁴ |
The excellent sensing performances of 1 in suspension elicit widespread interest in detecting trace NACs in the vapour state at room temperature. Among the four NACs, liquid NB has highest vapour pressure as compared to the three solid NACs at room temperature.51 Hence, we applied a thin film device to implement the real-time solid–gas monitoring of NB vapour at room temperature.52 As shown in Fig. 4a, the emission intensity of 1 decreased continuously with an increase in exposure time under NB vapour. In addition, the corresponding quenching efficiency (%) was determined using the formula: (I0 − I)/I0 × 100%, where I0 and I are the maximum emission intensities of 1 before and after exposure to NB vapour, respectively. As illustrated in Fig. 4b, NB can quench the emission intensity to 91.9% after an exposure time of about 500 s. The quenching phenomenon of 1 in the vapour state is similar to the liquid sensing process; this demonstrates that the quenching mechanism is based on the nature of the resultant sample.53
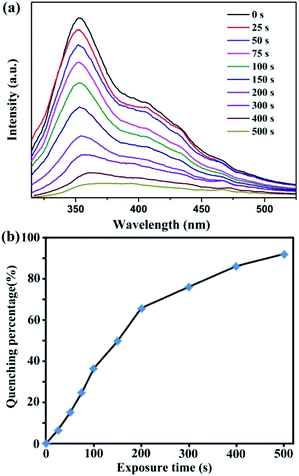 | ||
| Fig. 4 Time-dependent emission spectra (a) and the corresponding luminescent quenching percentage (b) after exposure of 1 to NB vapour at room temperature. | ||
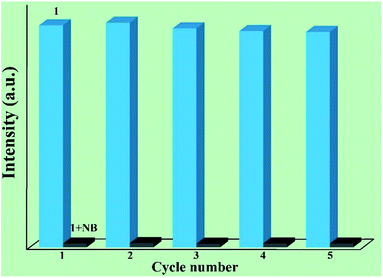
Furthermore, it is very important to separate and recycle the crystal sample after use. In fact, 1 can be recycled by centrifuging the dispersed solution after use and washing several times with DMF. As shown in Fig. 5, the luminescent intensity and quenching ability of 1 exhibit very little change after five cycles. Furthermore, the high stability of the recovered sample is demonstrated via the PXRD patterns (Fig. S3†).
Conclusion
In summary, a luminescent 2D MOF was successfully synthesized based on the semi-rigid tritopic ligand H3TATMA with triazines as functional sites and –COOH groups as coordinating sites. The resultant sample displayed fast and reversible solid-state detection of NAC. In addition, the corresponding Ksv values are 4.1 × 10³ M−1 for NB, 5.0 × 10³ M−1 for I-NB, 6.1 × 10³ M−1 for 1,3-DNB, and 1.6 × 10⁴ M−1 for TNP. We anticipate that this study provides a new avenue to obtain new structures using these functional semi-rigid ligands and opens a promising approach to design MOF-based sensors for NCAs in the future.Acknowledgements
We really appreciate the financial funds received from the 973 Program (2014CB845601) and the NSFC (Grants 21371134, 21571140, and 21531005).Notes and references
- S. A. Boyd, G. Sheng, B. J. Teppen and C. T. Johnston, Environ. Sci. Technol., 2001, 35, 4227 CrossRef CAS PubMed.
- G. Maurin, C. Serre, A. Cooper and G. Feréy, Chem. Soc. Rev., 2017, 46, 3104 RSC.
- H. Furukawa, K. E. Cordova, M. O'Keeffe and O. M. Yaghi, Science, 2013, 341, 1230444 CrossRef PubMed.
- B. Li, M. Chrzanowski, Y. Zhang and S. Ma, Coord. Chem. Rev., 2016, 307, 106 CrossRef CAS.
- M. O'Keeffe, M. A. Peskov, S. J. Ramsden and O. M. Yaghi, Acc. Chem. Res., 2008, 41, 1782 CrossRef PubMed.
- H. He, F. Sun, J. Jia, Z. Bian, N. Zhao, X. Qiu, L. Gao and G. Zhu, Cryst. Growth Des., 2014, 14, 4258 CAS.
- H. Xu, C.-S. Cao, X.-M. Kang and B. Zhao, Dalton Trans., 2016, 45, 18003 RSC.
- H. He, Y. Song, F. Sun, Z. Bian, L. Gao and G. Zhu, J. Mater. Chem. A, 2015, 3, 16598 CAS.
- Z. Hu, W. P. Lustig, J. Zhang, C. Zheng, H. Wang, S. J. Teat, Q. Gong, N. D. Rudd and J. Li, J. Am. Chem. Soc., 2015, 137, 16209 CrossRef CAS PubMed.
- H. He, F. Sun, T. Borjigin, N. Zhao and G. Zhu, Dalton Trans., 2014, 43, 3716 RSC.
- K. S. Asha, K. Bhattacharyya and S. Mandal, J. Mater. Chem. C, 2014, 2, 10073 RSC.
- K. S. Asha, G. S. Vaisakhan and S. Mandal, Nanoscale, 2016, 8, 11782 RSC.
- T. K. Kim, J. H. Lee, D. Moon and H. R. Moon, Inorg. Chem., 2013, 52, 589 CrossRef CAS PubMed.
- J.-L. Du, C.-P. Li, J.-P. Gao, X.-Y. Zhang, X. Jing, Y.-J. Mu and L.-J. Li, RSC Adv., 2016, 6, 101380 RSC.
- Q. Gao, Y. B. Xie, J. R. Li, D. Q. Yuan, A. A. Yakovenko, J. H. Sun and H. C. Zhou, Cryst. Growth Des., 2012, 12, 281 CAS.
- H. He, J. Du, H. Su, Y. Yuan, Y. Song and F. Sun, CrystEngComm, 2015, 17, 1201 RSC.
- S. Gao, R.-Q. Fan, L.-S. Qiang, P. Wang, S. Chen, X.-M. Wang and Y.-L. Yang, CrystEngComm, 2014, 16, 1113 RSC.
- J.-F. Eubank, R.-D. Walsh and M. Eddaoudi, Chem. Commun., 2005, 2095 RSC.
- X.-M. Lin, J.-L. Niu, D.-N. Chen, Y.-N. Lu, G. Zhang and Y.-P. Cai, CrystEngComm, 2016, 18, 6841 RSC.
- Z.-W. Wang, M. Chen, C.-S. Liu, X. Wang, H. Zhao and M. Du, Chem.–Eur. J., 2015, 21, 17215 CrossRef CAS PubMed.
- A. K. Chaudhari, S. S. Nagarkar, B. Joarder and S. K. Ghosh, Cryst. Growth Des., 2013, 13, 3716 CAS.
- H. He, Y. Song, F. Sun, N. Zhao and G. Zhu, Cryst. Growth Des., 2015, 15, 2033 CAS.
- G.-X. Wen, Y.-P. Wu, W.-W. Dong, J. Zhao, D.-S. Li and J. Zhang, Inorg. Chem., 2016, 55, 10114 CrossRef CAS PubMed.
- T. Xia, T. Song, G. Zhang, Y. Cui, Y. Yang, Z. Wang and G. Qian, Chem.–Eur. J., 2016, 22, 18429 CrossRef CAS PubMed.
- L. Di, J.-J. Zhang, S.-Q. Liu, J. Ni, H. Zhou and Y.-J. Sun, Cryst. Growth Des., 2016, 16, 4539 CAS.
- G. M. Sheldrick, SADABS, Program for Empirical Absorption Correction for Area Detector Data, University of Gottingen, Gottingen, Germany, 1996 Search PubMed.
- G. M. Sheldrick, SHELXTL Version 5.1 Software Reference Manual, Bruker AXS. Inc., Madison, WI, 1997 Search PubMed.
- A. L. Spek, J. Appl. Crystallogr., 2003, 36, 7 CrossRef CAS.
- A. L. Spek, PLATON, A multipurpose crystallographic tool, Utrecht University, The Netherlands, 2001 Search PubMed.
- J. K. Nath, A. M. Kirillov and J. B. Baruah, Cryst. Growth Des., 2015, 15, 737 CAS.
- A. Thirumurugan and S. Natarajan, Dalton Trans., 2004, 18, 2329 Search PubMed.
- H. He, F. Sun, N. Zhao, R. Yuan and G. Zhu, RSC Adv., 2014, 4, 21535 RSC.
- Y.-C. He, H.-M. Zhang, Y.-Y. Liu, Q.-Y. Zhai, Q.-T. Shen, S.-Y. Song and J.-F. Ma, Cryst. Growth Des., 2014, 14, 3174 CAS.
- Y. Wu, J. Wu, Z. Luo, J. Wang, Y. Li, Y. Han and J. Liu, RSC Adv., 2017, 7, 10415 RSC.
- Y. Hu, M. Ding, X.-Q. Liu, L.-B. Sun and H.-L. Jiang, Chem. Commun., 2016, 52, 5734 RSC.
- X. Luo, X. Zhang, Y. Duan, X. Wang and J. Zhao, Dalton Trans., 2017, 46, 6303 RSC.
- Z. Hu, B. J. Deibert and J. Li, Chem. Soc. Rev., 2014, 43, 5815 RSC.
- Q.-Y. Li, Z. Ma, W.-Q. Zhang, J.-L. Xu, W. Wei, H. Lu, X. Zhao and X.-J. Wang, Chem. Commun., 2016, 52, 11284 RSC.
- M. Bagheri, M. Y. Masoomi, A. Morsali and A. Schoedel, ACS Appl. Mater. Interfaces, 2016, 8, 21472 CAS.
- W. Liu, X. Huang, C. Xu, C. Chen, L. Yang, W. Dou, W. Chen, H. Yang and W. Liu, Chem.–Eur. J., 2016, 22, 18769 CrossRef CAS PubMed.
- X. H. Zhou, L. Li, H. H. Li, A. Li, T. Yang and W. Huang, Dalton Trans., 2013, 42, 12403 RSC.
- S. S. Nagarkar, B. Joarder, A. K. Chaudhari, S. Mukherjee and S. K. Ghost, Angew. Chem., Int. Ed., 2013, 52, 2881 CrossRef CAS PubMed.
- H. Sohn, M. J. Sailor, D. Magde and W. C. Trogler, J. Am. Chem. Soc., 2003, 125, 3821 CrossRef CAS PubMed.
- W. Liu, X. Huang, C. Xu, C. Y. Chen, L. Z. Yang, W. Dou, W. M. Chen, H. Yang and W. S. Liu, Chem.–Eur. J., 2016, 22, 18769 CrossRef CAS PubMed.
- F. Zhang, Y. Wang, T. S. Chu, Z. H. Wang, W. Li and Y. Y. Yang, Analyst, 2016, 141, 4502 RSC.
- Y. J. Deng, N. J. Chen, Q. Y. Li, X. J. Wu, X. L. Huang, Z. H. Lin and Y. G. Zhao, Cryst. Growth Des., 2017, 17, 3170 CAS.
- B. Parmar, Y. Rachuri, K. K. Bisht, R. Laiya and E. Suresh, Inorg. Chem., 2017, 56, 2627 CrossRef CAS PubMed.
- X.-Z. Song, S.-Y. Song, S.-N. Zhao, Z.-M. Hao, M. Zhu, X. Meng, L.-L. Wu and H.-J. Zhang, Adv. Funct. Mater., 2014, 24, 4034 CrossRef CAS.
- X.-J. Hong, Q. Wei, Y.-P. Cai, S.-R. Zheng, Y. Yu, Y.-Z. Fan, X.-Y. Xu and L.-P. Si, ACS Appl. Mater. Interfaces, 2017, 9, 4701 CAS.
- L.-H. Cao, F. Shi, W.-M. Zhang, S.-Q. Zang and T. C. W. Mak, Chem.–Eur. J., 2015, 21, 15705 CrossRef CAS PubMed.
- S. Pramanik, C. Zheng, X. Zhang, T. J. Emge and J. Li, J. Am. Chem. Soc., 2011, 133, 4153 CrossRef CAS PubMed.
- J. H. Wang, M. Li and D. Li, Chem. Sci., 2013, 4, 1793 RSC.
- D. Tian, Y. Li, R.-Y. Chen, Z. Chang, G.-Y. Wang and X.-H. Bu, J. Mater. Chem. A, 2014, 2, 1465 CAS.
Footnote |
| † Electronic supplementary information (ESI) available: PXRD, TGA, FT-IR and so on. CCDC 1529378. For ESI and crystallographic data in CIF or other electronic format see DOI: 10.1039/c7ra06320b |
| This journal is © The Royal Society of Chemistry 2017 |

