 Open Access Article
Creative Commons Attribution 3.0 Unported Licence
Diameter effect of gold nanoparticles on photothermal conversion for solar steam generation
Ankang Guo,
Yang Fu ,
Gang Wang and
Xianbao Wang
 *
*
Hubei Collaborative Innovation Center for Advanced Organic Chemical Materials, Key Laboratory for the Green Preparation and Application of Functional Materials, Ministry of Education, Hubei Key Laboratory of Polymer Materials, School of Materials Science and Engineering, Hubei University, Wuhan 430062, China. E-mail: wangxb68@aliyun.com; Fax: +86 2788661729; Tel: +86 2788661729
First published on 17th January 2017
Abstract
Photothermal conversion has shown great potential for the effective use of solar energy. Au nanoparticles (Au NPs) were a satisfactory material for photothermal conversion, mainly due to their surface plasmon resonance (SPR) effect. Herein, the diameter effect of Au NPs on photothermal conversion was explored for generating solar steam. The diameters varied from 3 to 40 nm, and the results showed that the photothermal conversion efficiency was enhanced by increasing the diameters of the Au NPs with constant total superficial areas under a xenon lamp. This study is important for the further exploration of the photothermal effect of Au NPs and their practical applications in large-scale solar steam generation, seawater desalination and sterilization of waste.
Introduction
Renewable energy sources, especially solar energy has attracted intense study, as it is a pure, abundant and fairly accessible energy.1,2 The photothermal conversion of nanomaterials is caused by effectively capturing solar energy, giving the opportunity for an extensive range of applications, from large-scale power supply, water purification, and desalination to sterilization through generating steam.3,4 Several factors have been studied for nanocomposites to expedite efficient photothermal conversion and solar steam generation under sunlight irradiation without any simulated light concentration, such as the enhanced absorption and scattering in the solar spectrum, the heat localization on the surface of nanofluids, the thermal insulation of nanofluids and generating micro-bubbles with minimal dissipated energy.5–8Nanoscale heating is achieved due to a specific optical property, named surface plasmon resonance (SPR), of metallic nanomaterials including Au, Ag, Cu, Al and so on.9–12 Under solar illumination, these nanoparticles, especially gold nanoparticles (Au NPs), can generate ideal micro-sources of heat due to strong light absorption at the range of plasmonic resonance wavelength.13–16 The heat produced by Au NPs was transferred into the surrounding fluid, meanwhile, the vapor bubble nucleated at the particle–fluid interface, aggregated, buoyed and escaped from the surface of fluid eventually.17
Several researches have also focused on the photothermal conversion and vapor formation of nanomaterials under irradiation. This specific optical property has enabled numerous applications across a broad range of fields, such as energy technology,18–20 protein imaging,21,22 plasmon catalysis23,24 and biomedicine.25–27 Halas's group reviewed the studies of hot carrier science and technology,28 and reported solar steam generation enabled by several kinds of nanoparticles designed for high reproducibility and photothermal conversion efficiency.5,29,30 However, the high repeatability, and the precise effects of radiation intensity and radiation as well as the kinds of nanoparticles on photothermal conversion efficiency are required for further study. To reduce the heat loss by heating the bulk liquid, Hadi et al. and George et al. found that local generation of steam was advisable by the designed material structure, which floated on the surface of the liquid.8,31 Similarly, Wang et al., Liu et al., and Yu et al. reported a similar bio-inspired plasmonic film for high-performance evaporation.6,7,32 They also mixed Au NPs (light absorptive particles) and polystyrene NPs (scattering particles) to limit the incident light at the surface of the fluids and generate heat.33 A new alveolate structure with large area, small taper angle and varying nanogaps was also prepared to decrease plasmon propagation length.34 Moreover, numerous nanostructures were designed and optimized to improve their photothermal efficiency, such as noble metals coated single-walled carbon nanotubes,35 nanoparticles located on a solid substrate in solution,16 plasmonic titanium nitride nanodisks,36 GO/Au NPs composites,37 etc.
The size and morphology of Au NPs were two key factors for the photothermal conversion.38 Here, we synthesized Au NPs with different sizes by a seeding growth method. The diameter effect of Au NPs on the photothermal conversion efficiency was studied using three accessible and reproducible methods through monitoring the changes of temperature, the vapor pressure and mass loss of the nanofluids. The xenon lamp was used as a radiation source for high repeatability. The experimental results evidenced that the photothermal conversion efficiency had obviously positive correlation with the diameters of Au NPs, which are almost identical to the theoretical calculation.39
Experimental
Materials
Gold chloride hydrate (HAuCl4·3H2O, Au ≥ 48%), sodium citrate dihydrate (C6H5Na3O7·2H2O, 99%), hexadecyl trimethyl ammonium bromide (CTAB, 99%), sodium borohydride (NaBH4, 99%), ascorbic acid (AA, 99%) were supplied by Aladdin (http://www.aladdin-e.com/) and used as received. Ultrapure deionized water was used in the processes of dissolving, dilution and synthesis. All glassware was soaked and cleaned with aqua regia.Synthesis of Au NPs
Au NPs with different sizes were synthesized using a seeding growth method with some modifications.40 The schematic illustration for the synthesis procedure of Au NPs are shown in Fig. 1. Briefly, gold seed (sample A) was synthesized in ice bath and growth solution was synthesized and prepared at 40–45 °C. Sample B and C were synthesized by different proportions of gold seed and growth solution. Sample D was prepared from sample C through replacing gold seed with Au NPs, and sample E was synthesized using Au NPs from sample D as “crystal nucleus” in the growth solution.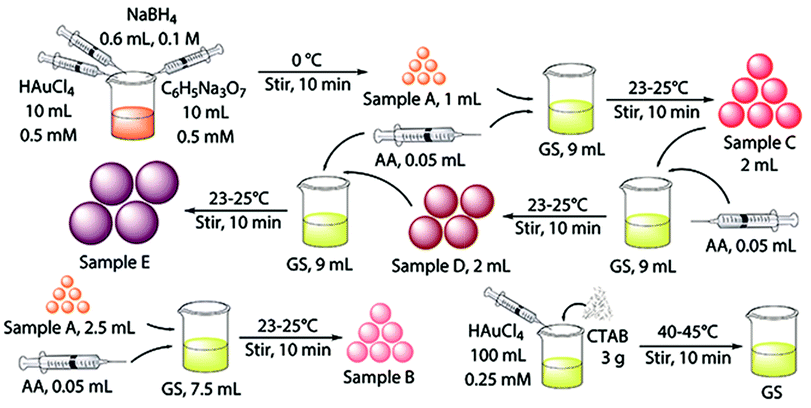 | ||
| Fig. 1 Schematic illustration for the synthesis procedure of Au NPs with different diameters (CTAB: hexadecyl trimethyl ammonium bromide; AA: ascorbic acid). | ||
Gold seed (sample A) and sample B were concentrated by thiol capping and subsequent solvent extraction. They were put into the refrigerator, cooled and centrifuged at 1500 rpm for 20 min to remove the most of excess CTAB. Subsequently, the upper liquids were extracted. Specifically, 10 mL each sample was stirred for 1 h with 10 μL dodecanethiol, and then, 1 mL toluene and 20 mg KI were added to the Au NPs dispersions and shake for 5 min. The upper portion was extract layer. Sample C, D and E were concentrated by a centrifuge at 25 °C. They were centrifuged at 8500 rpm, 6800 rpm and 6000 rpm for 35 min, respectively. The extract of the five sizes of Au NPs were diluted properly for characterization.
The different sizes of Au NPs were diluted according to the proportion of Tables 1 and 2 before the tests.
| Water | Sample A | Sample B | Sample C | |
|---|---|---|---|---|
| a dAu is the diameter of Au NPs, ratio of dAu is the diameter ratio of different Au NPs, εx/sample C is the dilution ratio of different samples to sample C. | ||||
| dAu (nm) | — | 3.4 | 5.3 | 8.1 |
| Ratio of dAu | — | 1.000 | 1.568 | 2.376 |
| εx/sample C | 1.000 | 0.421 | 0.660 | 1.000 |
| Water | Sample A | Sample B | Sample C | |
|---|---|---|---|---|
| a dAu is the diameter of Au NPs, ratio of dAu is the diameter ratio of different Au NPs, εx/sample E is the dilution ratio of different samples to sample E. | ||||
| dAu (nm) | — | 8.1 | 16.7 | 37.8 |
| Ratio of dAu | — | 1.000 | 2.061 | 4.679 |
| εx/sample E | 1.000 | 0.214 | 0.440 | 1.000 |
A transmission electron microscope (TEM, TECNAI F20 electron microscope operating at a bias voltage of 200 kV) was used to observe the shapes and sizes of Au NPs. The size distributions and morphologies of Au NPs were determined by TEM images through a software application (Nano Measurer 1.2). The optical absorbance spectrum at 25 °C was measured using a UV-VIS-NIR spectrophotometer (Shimadzu UV-VIS-NIR UV-3600 double beam spectrophotometer). The IR camera (FLIR E4) was used to measure the temperature of samples before and after irradiation.
Photothermal conversion
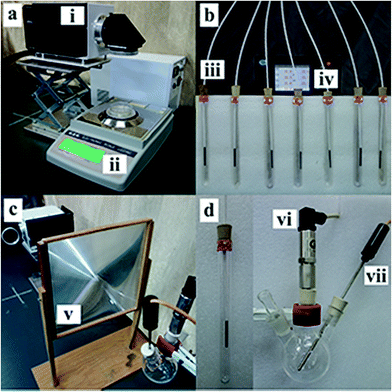
The size effects of Au NPs on the photothermal conversion efficiency were studied by monitoring the changes in temperature, pressure and mass loss of the nanofluids. More importantly, the containers (Petri dish, tube and three-necked flask) shown in Fig. 2 are all made by quartz, which have same heat capacity.As is shown in Fig. 2a, the evaporation rates of water were quantified by recording the mass change as a function of time. 10 mL Au NPs dispersion was put in a Petri dish (6 cm diameter), which was placed on an electronic balance and the data are transfer to a computer through a data wire. And each sample was irradiated for thirty minutes.
To reduce the heat loss, the evolution of photothermal conversion from Au NPs dispersed in water was quantified in an improved system consisting of seven 15 mL quartz tubes half embedded in a custom-built lab-scale support bracket (EPE) and seven thermocouples to monitor the liquid temperature, as is shown in Fig. 2b. The tubes that contained 10 mL diluted Au NPs were irradiated under the xenon lamp for half an hour. Notably, and the seven tubes were divided into three groups (2, 2 and 3) owing to the limitation of the spot size.
The efficiency of solar steam generation from Au NPs with different sizes was monitored by a pressure sensor, which was shown in Fig. 2c. The 50 mL three-necked flask containing 20 mL dilute Au NPs was illuminated with the xenon lamp. A 0.07 m−2 Fresnel lens was used to aggregate light into the glass flask. Each sample was irradiated for two minutes and flasks were replaced in every two test interval.
Results and discussion
Characterization of Au NPs
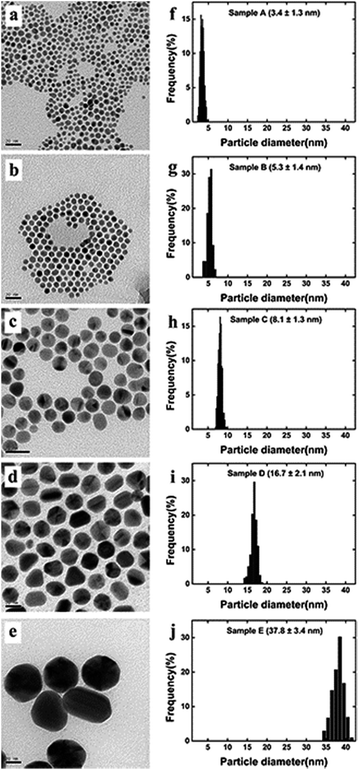
The TEM images, histograms and UV-vis spectra for Au NPs with different sizes are shown in Fig. 3 and 4, respectively. The absorption band of Au NPs at 525 nm becomes intense and sharp with increasing Au NPs size from 3.5 to 38 nm.40 As can be seen, the redshift from 520 to 530 nm is obvious as the Au NPs increase in size between 3.5 and 38 nm.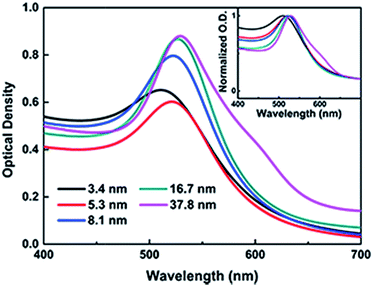 | ||
| Fig. 4 UV-vis spectra of Au NPs with different diameters, and the normalized traces were in the inset. | ||
Calculations of the dilution ratio
In the theory of local surface plasmon resonance (LSPR), Au NPs efficiently generate heat with electromagnetic radiation. This process was strongly enhanced in the presence of plasmon resonance and also depended on the shapes and sizes of Au NPs. The intensity of LSPR and the effect of photothermal conversion decayed exponentially from the surface to the particle center of Au NPs.39 Therefore, the Au NPs surface could be approximately considered as the effective area of photothermal conversion, namely, the sum of superficial area of all particles should be unified for each sample.Under the premise of constant precursor concentration, the number of particles in each sample is calculated by the following basic equations:
 | (1) |
 | (2) |
Considering that the excessive dosage of reducing agents and continuous stirring in the process of synthesis, the conversion ratio is assumed to be 100%, which means α is equal to 1.40 So the eqn (1) could be rewrite as:
 | (3) |
The sum of superficial area of all particles is given by:
| S0 = 4πrAu2 | (4) |
 | (5) |
 | (6) |
And the factor k is a constant. Thus, eqn (6) can be rewritten as:
 | (7) |
This equation reveals the important dependence of the superficial area on the size:
 | (8) |
The superficial area is inversely proportional to Au NPs radius. And the dilution ratio of different samples can be calculated by two simple equations:
| VaSa = VbSb | (9) |
 | (10) |
To reduce experimental errors by controlling εa/b < 5, the five samples with different sizes were divided into two experimental groups. The total superficial area of particles of sample C and E were used as dilution standard in group 1 (G1) and group 2 (G2) respectively. More importantly, sample C was a connection, which appeared in both G1 and G2, and this connection made the photothermal conversion efficiency of five samples divided into two comparable groups (Tables 1 and 2).
Mass loss vs. time
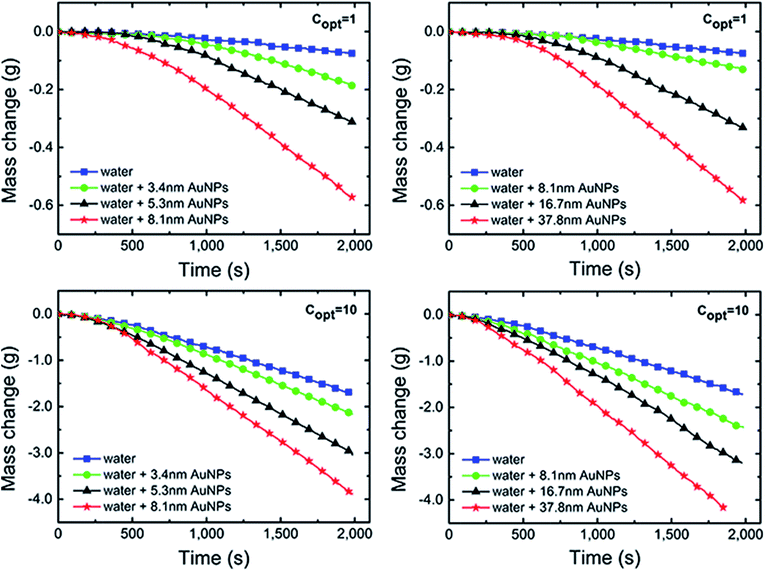
There are four non-negligible hypotheses in the process of measuring and efficiency calculation: (i) assuming that the radiation from the xenon lamp was projected on the Au NPs nanofluids entirely, that is, the radiation spot was no greater than the Au NPs nanofluids container; (ii) ignoring the mass loss in the radiation process; (iii) ignore the impediment from dust and tiny particles in the air to the xenon lamp radiation; and (iv) assuming that the irradiation intensity is always constant and stable, which means the attenuation of irradiation was ignored throughout the process of testing.As is shown in Fig. 5, the evaporation rates of Au NPs nanofluids were measured by recording the mass changes as a function of time and the results were compared with pure water under 1 and 10 kW m−2 illumination, respectively.
After an initial preheated period, the curves approached linearly, meaning the evaporation rate of all samples reaches a constant value.
Compared with pure water, Au NPs nanofluids in both G1 and G2 had higher evaporation rates and lost more mass. In G1, the evaporation rates increased with increasing Au NPs diameters. After irradiated of ∼2000 seconds at 10 kW m−2, the mass loss of Au NPs nanofluids with 3.4 nm, 5.3 nm and 8.1 nm were 1.76, 4.43 and 7.79 times higher than that of pure water, respectively. This trend can be also found in G2. As the sizes of particles increased, the mass loss and evaporation rate were increased and all results from Au NPs nanofluids exceed that of pure water significantly.
By the connection of sample C (8.1 nm Au NPs), the combination of Fig. 4a and b indicated that the evaporation rate increased with the particles size in 3–40 nm. The sum of superficial area of each size of particles in G1 was 4.63 times higher than that in G2. Therefore, it is reasonable that the mass loss and evaporation of Au NPs nanofluids in G2 were not significantly higher than that in G1, although the particles sizes in G2 were larger.
Three kinds of efficiencies were used to quantify and compare the effect of diameters on the photothermal efficiencies, including gasification efficiency (ηg), thermal efficiency (ηth) and loss efficiency (ηl). The gasification efficiency (ηg) was used to calculate the ratio of vaporization heat to total radiation.8
 | (11) |
 | (12) |
 | (13) |
 | (14) |
This equation reveals that the photothermal conversion efficiency is proportional to the average rate of mass change.
The vaporazation efficiency was calculated in different samples under the 1 and 10 kW m−2 illumination, respectively, and the vaporization was assumed to occur at 375 K as shown in Fig. 6. It is clear that the vaporization efficiency improved with the size of Au NPs increasing both in G1 and G2 under the 1 and 10 kW m−2 solar illumination. About 4.4% was improved in vaporization efficiency of water under 1 kW m−2 solar illumination comparing that under 10 kW m−2 solar illumination. Take sample A (3.4 nm) for example, the gasification slightly improved from 8.46% to 9.85% with the intensity of radiation was increased from 1 to 10 kW m−2.
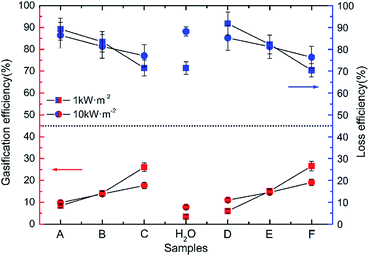 | ||
| Fig. 6 The vaporazation efficiency and loss efficiency of pure water and Au NPs dispersions with different diameters (sample A to F) under solar illumination with 1 and 10 kW m−2, respectively. | ||
The main reason is the ratio of the energy loss caused by scattering and refraction to total radiation decreased when the intensity of radiation was increased. In G1 and G2, the inclination of line represented the capacity gaps of different sizes of Au NPs. And the lines have higher degree of inclination under 10 kW m−2 solar illumination in both G1 and G2, which means one solar radiation intensity is too weak to satisfy the all energy needed to driver vaporization reaction. In other words, the outstanding potential of Au NPs dispersion to produce heat could be excited more efficiently in a relatively higher light intensity.
There are two main reasons for the low vaporization efficiency of Au NPs. One is that the concentration of precursor solution is extremely low (2.5 × 10⁻⁴ M). Another is that Au NPs nanofluids could not make the radiation locked in a special and small region, which means a large amount of radiant energy was loss including transmission, scattering, refraction and heating all of the liquid.
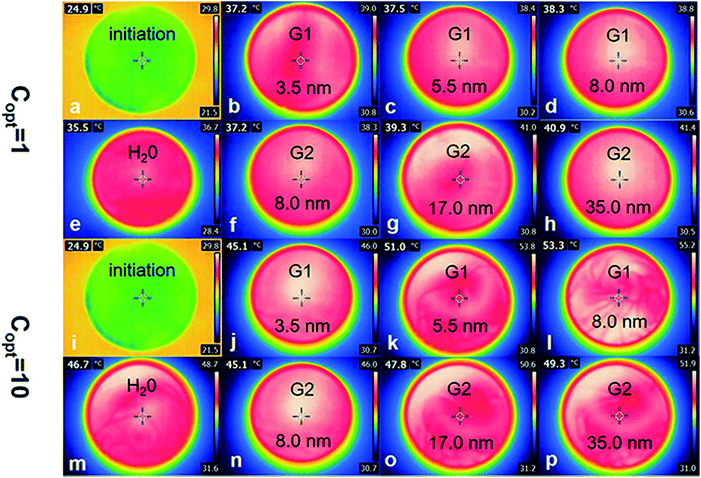
To further study the thermal efficiency and loss efficiency, IR camera was used to capture the temperature of Au NPs nanofluids before and after irradiation (Fig. 7).
The thermal efficiency (ηth) in this system can be calculated by eqn (15).41
 | (15) |
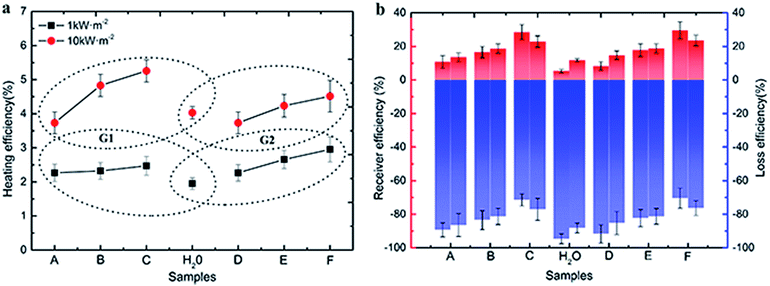
As is shown in Fig. 8a, the thermal efficiency of Au samples raised significantly when the irradiation intensity increased to ten times. Compared with the irradiation intensity at 1 kW m−2 solar illumination, the thermal efficiency of water increased by 2.08 percent from 1.95 to 4.03, and the efficiency of other six samples were also increased (1.89 percent on average), among them, the efficiency of sample A (3.4 nm) was increased form 2.27–3.73%. The irradiation intensity needed by the photothermal efficiency of Au NPs is a constant value, in the case of the volume and concentration of Au NPs nanofluids and irradiated area are constant. In the early stages of improving irradiation intensity, the photothermal efficiency increased and reached the maximum value. And the efficiency decreased gradually from the maximum value with the intensity of irradiation increased. 10 kW m−2 solar illumination exceeded the limitation of maximum irradiation in this test system.
Low heating efficiency is less than loss efficiency, because most of the irradiation energy is used to maintain the temperature balance. Different from irradiation at 1 kW m−2, 10 kW m−2 solar illumination could provide more energy to heat the Au NPs nanofluids under the condition of temperature-steady surroundings. However, for the 1 kW m−2 solar illumination system, only a small part of energy is used to heat nano-fluids, which results in higher heating efficiency under 10 kW m−2 solar illumination than 1 kW m−2 solar illumination.
In this system, there is an identical equation that the sum of gasification efficiency, thermal efficiency and loss efficiency identically equal to 1, which can be rewrite as:
| ηg + ηth + ηl = 1 | (16) |
The sum of gasification efficiency and thermal efficiency were defined as a receiver efficiency (ηe), and it was calculated as:
| ηe = ηg + ηth | (17) |
The receiver efficiency (red column) and loss efficiency (blue column) of samples were calculated under both 1 kW m−2 (left column) and 10 kW m−2 (right column) solar illumination in the Fig. 7b. It is clear that the receiver efficiency of both Au NPs and water were higher under 1 kW m−2 solar illumination. And the receiver efficiency improved with the sizes of Au NPs in G1 and G2 under both 1 kW m−2 and 10 kW m−2 solar illumination, while the loss efficiency decreased with increasing the sizes of Au NPs. For the smallest particles (3.4 nm), the receiver efficiency was about 11%, and the loss efficiency was about 89%. However, the highest receiver efficiency was only reached ∼30%, which was produced by the biggest Au NPs (sample E), and the loss efficiency reached ∼40%. The loss energy was mainly used for heating the surrounding liquid. Additionally, the color of Au NPs nanofluids was changed from pink to mulberry rather than brown or black, so they have a relative narrow absorption spectrum.
Compared with the theoretical photothermal conversion model, the case that the heat produced by Au NPs transfer to the whole fluid but totally vaporing the ambient water always exist in the whole process of heating water. However, the calculation of the conduction losses need to be further explored, because the vapor temperature was undulate in the whole process of heating water.
Temperature changes vs. time
In order to reduce the heat loss, quartz tubes were half coated by expandable polyethylene (EPE). Under the xenon lamp radiation, the temperature curves were shown in Fig. 9, which clearly showed that Au NPs had excellent photothermal conversion capability compared with pure water. In G1, the bulk temperature increased by ∼17 K, ∼20 K and ∼26 K for 3.4 nm, 5.3 nm and 8.1 nm Au NPs after 2500 s irradiation, respectively, whereas the increase of temperature is ∼11 K for pure water. And in G2, the temperature increased by ∼12 K, ∼16 K and ∼26 K for 8.1 nm, 16.7 nm and 37.8 nm Au NPs after 2500 s irradiation, respectively. Just as the trend that found in mass change curves, by the connection of sample C (8.1 nm Au NPs), the combination of Fig. 9a and b indicated that the temperature increased with the diameter of Au NPs in the range of 3–40 nm. The temperature change of Au NPs with different size could be calculated by Fig. 7, which matched the earlier report.39 However, the temperature change is proportional to the radius of Au NPs rather than the square of radius, which can be accepted because of the heat loss through the whole process.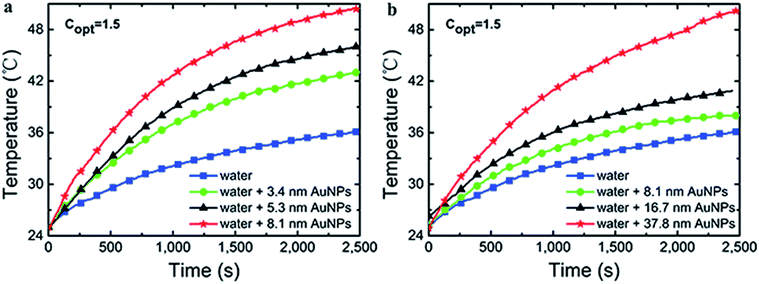 | ||
| Fig. 9 The temperature changes with time for Au NPs fluids from G1 (a) and G2 (b) under 1.5 kW m−2 illumination. | ||
There was a temperature limitation for Au NPs, which was depended on the shape and size of Au NPs, the radiation intensity and the ambient temperature. Under the intense and long enough illumination, the process of temperature changed consisted of the following procedures: (i) temperature increased with time; (ii) Au NPs reached their own photothermal conversion limitation and had constant conversion efficiency, but the temperature still increased and (iii) the temperature became constant when the absorption and dissipation of energy reached equilibrium. In the process of (ii) and (iii), the rate of rise of temperature slowed down until reached the point of energy balance.
Pressure changes vs. time
The curves of pressure changes were shown in Fig. 10. The three-necked flask was firmly sealed and the generation of solar vapor was constrained by ever-increasing pressure as the time of radiation was extended. Thus, the rate of steam generation was slowed done at ∼1200 s. The evaporation rate increased with the size of Au NPs in 3–40 nm, which echoed the trend of mass changes and temperature changes.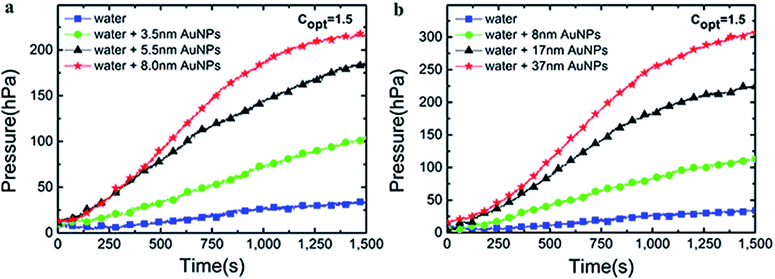 | ||
| Fig. 10 The pressure changes over time of Au nanoparticles from G1 (a) and G2 (b) under 1.5 kW m−2 solar illumination. | ||
Conclusions
Au NPs with different diameters (∼3.4, 5.3, 8.1, 16.7 and 37.8 nm) were synthesized using a modified seeding growth method. The photothermal conversion efficiency of Au NPs fluids with different sizes by using three simple and effective test methods. The experimental results evidenced that the photothermal conversion efficiency was enhanced by increasing Au NPs diameters in 3–40 nm, which was broadly in line with the reported theoretical calculations. More importantly, our findings provided an extensive reference value for the further study about photothermal conversion material especially precious metal nanocomposites, and were useful for a wide range of novel photothermal applications such as desalination system, water purification or sterilization system and photothermal therapy.Acknowledgements
This work is financially supported by the Ministry of Science and Technology of China (Grant 2016YFA0200200) and National Natural Science Foundation of China (Grants 51272071, 51203045 and 21401049) and Hubei Provincial Department of Science & Technology (2014CFA096).Notes and references
- M. A. Shannon, P. W. Bohn, M. Elimelech, J. G. Georgiadis, B. J. Marinas and A. M. Mayes, Nature, 2008, 452, 301–310 CrossRef CAS PubMed.
- M. K. Gupta and S. C. Kaushik, Renewable Energy, 2010, 35, 1228–1235 CrossRef.
- E. Cartlidge, Science, 2011, 334, 922–924 CrossRef PubMed.
- M. Elimelech and W. A. Phillip, Science, 2011, 333, 712–717 CrossRef CAS PubMed.
- O. Neumann, A. S. Urban, J. Day, S. Lal, P. Nordlander and N. J. Halas, ACS Nano, 2013, 7, 42–49 CrossRef CAS PubMed.
- Z. Wang, Y. Liu, P. Tao, Q. Shen, N. Yi, F. Zhang, Q. Liu, C. Song, D. Zhang, W. Shang and T. Deng, Small, 2014, 10, 3234–3239 CrossRef CAS PubMed.
- Y. Liu, S. Yu, R. Feng, A. Bernard, Y. Liu, Y. Zhang, H. Duan, W. Shang, P. Tao, C. Song and T. Deng, Adv. Mater., 2015, 27, 2768–2774 CrossRef CAS PubMed.
- H. Ghasemi, G. Ni, A. M. Marconnet, J. Loomis, S. Yerci, N. Miljkovic and G. Chen, Nat. Commun., 2014, 5, 4449 CAS.
- G. V. Hartland, Chem. Rev., 2011, 111, 3858–3887 CrossRef CAS PubMed.
- K. A. Willets and R. P. Van Duyne, Annu. Rev. Phys. Chem., 2007, 58, 267–297 CrossRef CAS PubMed.
- M. W. Knight, L. Liu, Y. Wang, L. Brown, S. Mukherjee, N. S. King, H. O. Everitt, P. Nordlander and N. J. Halas, Nano Lett., 2012, 12, 6000–6004 CrossRef CAS PubMed.
- J. S. DuChene, W. Niu, J. M. Abendroth, Q. Sun, W. Zhao, F. Huo and W. D. Wei, Chem. Mater., 2013, 25, 1392–1399 CrossRef CAS.
- S. Eustis and M. A. El-Sayed, Chem. Soc. Rev., 2006, 35, 209–217 RSC.
- P. K. Jain, X. Huang, I. H. El-Sayed and M. A. El-Sayed, Acc. Chem. Res., 2008, 41, 1578–1586 CrossRef CAS PubMed.
- E. Ringe, M. R. Langille, K. Sohn, J. Zhang, J. Huang, C. A. Mirkin, R. P. Van Duyne and L. D. Marks, J. Phys. Chem. Lett., 2012, 3, 1479–1483 CrossRef CAS PubMed.
- G. Baffou, J. Polleux, H. Rigneault and S. Monneret, J. Phys. Chem. C, 2014, 118, 4890–4898 CAS.
- A. Polman, ACS Nano, 2013, 7, 15–18 CrossRef CAS PubMed.
- H. A. Atwater and A. Polman, Nat. Mater., 2010, 9, 205–213 CrossRef CAS PubMed.
- D. Erickson, D. Sinton and D. Psaltis, Nat. Photonics, 2011, 5, 583–590 CrossRef CAS.
- J. A. Schuller, T. Taubner and M. L. Brongersma, Nat. Photonics, 2009, 3, 658–661 CrossRef CAS.
- J. Lee, A. O. Govorov and N. A. Kotov, Angew. Chem., 2005, 117, 7605–7608 CrossRef.
- S. Ibrahimkutty, J. Kim, M. Cammarata, F. Ewald, J. Choi, H. Ihee and A. Plech, ACS Nano, 2011, 5, 3788–3794 CrossRef CAS PubMed.
- P. Christopher, H. Xin and S. Linic, Nat. Chem., 2011, 3, 467–472 CAS.
- J. R. Adleman, D. A. Boyd, D. G. Goodwin and D. Psaltis, Nano Lett., 2009, 9, 4417–4423 CrossRef CAS PubMed.
- P. K. Jain, I. H. El-Sayed and M. A. El-Sayed, Nano Today, 2007, 2, 18–29 CrossRef.
- G. von Maltzahn, J. H. Park, K. Y. Lin, N. Singh, C. Schwöppe, R. Mesters, W. E. Berdel, E. Ruoslahti, M. J. Sailor and S. N. Bhatia, Nat. Mater., 2011, 10, 545–552 CrossRef CAS PubMed.
- Z. J. Lim, J. J. Li, C. Ng, L. L. Yung and B. Bay, Acta Pharmacol. Sin., 2011, 32, 983–990 CrossRef CAS PubMed.
- M. L. Brongersma, N. J. Halas and P. Nordlander, Nat. Nanotechnol., 2015, 10, 25–34 CrossRef CAS PubMed.
- Z. Fang, Y. Zhen, O. Neumann, A. Polman, F. J. de Abajo, P. Nordlander and N. J. Halas, Nano Lett., 2013, 13, 1736–1742 CrossRef CAS PubMed.
- N. J. Hogan, A. S. Urban, C. Ayala-Orozco, A. Pimpinelli, P. Nordlander and N. J. Halas, Nano Lett., 2014, 14, 4640–4645 CrossRef CAS PubMed.
- G. Ni, N. Miljkovic, H. Ghasemi, X. Huang, S. V. Boriskina, C. Lin, J. Wang, Y. Xu, M. M. Rahman, T. Zhang and G. Chen, Nano Energy, 2015, 17, 290–301 CrossRef CAS.
- S. Yu, Y. Zhang, H. Duan, Y. Liu, X. Quan, P. Tao, W. Shang, J. Wu, C. Song and T. Deng, Sci. Rep., 2015, 5, 13600 CrossRef PubMed.
- D. Zhao, H. Duan, S. Yu, Y. Zhang, J. He, X. Quan, P. Tao, W. Shang, J. Wu, C. Song and T. Deng, Sci. Rep., 2015, 5, 17276 CrossRef CAS PubMed.
- K. Bae, G. Kang, S. K. Cho, W. Park, K. Kim and W. J. Padilla, Nat. Commun., 2015, 6, 10103 CrossRef CAS PubMed.
- X. Wang, C. Wang, L. Cheng, S. T. Lee and Z. Liu, J. Am. Chem. Soc., 2012, 134, 7414–7422 CrossRef CAS PubMed.
- U. Guler, J. C. Ndukaife, G. V. Naik, A. G. Nnanna, A. V. Kildishev, V. M. Shalaev and A. Boltasseva, Nano Lett., 2013, 13, 6078–6083 CrossRef CAS PubMed.
- A. F. Zedan, S. Moussa, J. Terner, G. Atkinson and M. S. El-Shall, ACS Nano, 2013, 7, 627–636 CrossRef CAS PubMed.
- M. J. Chiu and L. K. Chu, Phys. Chem. Chem. Phys., 2015, 17, 17090–17100 RSC.
- A. O. Govorov and H. H. Richardson, Nano Today, 2007, 2, 30–38 CrossRef.
- D. R. Jana, L. Gearheart and C. J. Murphy, Langmuir, 2001, 17, 6782–6786 CrossRef.
- H. Zhang, H. Chen, X. Du and D. Wen, Sol. Energy, 2014, 100, 141–147 CrossRef CAS.
| This journal is © The Royal Society of Chemistry 2017 |

