 Open Access Article
Creative Commons Attribution 3.0 Unported Licence
Lithium-ion conductivity in Li6Y(BO3)3: a thermally and electrochemically robust solid electrolyte†
Beatriz
Lopez-Bermudez
a,
Wolfgang G.
Zeier
a,
Shiliang
Zhou
 a,
Anna J.
Lehner
b,
Jerry
Hu
b,
David O.
Scanlon
cd,
Benjamin J.
Morgan
*e and
Brent C.
Melot
*a
aDepartment of Chemistry, University of Southern California, Los Angeles, CA 90089, USA. E-mail: melot@usc.edu
bMaterials Research Laboratory, University of California, Santa Barbara, CA 93106, USA
cUniversity College London, Kathleen Lonsdale Materials Chemistry, 20 Gordon Street, London WC1H 0AJ, UK
dDiamond Light Source Ltd., Diamond House, Harwell Science and Innovation Campus, Didcot, Oxfordshire OX11 0DE, UK
eDepartment of Chemistry, University of Bath, Claverton Down, BA2 7AY, UK
First published on 8th February 2016
Abstract
The development of new frameworks for solid electrolytes exhibiting fast Li-ion diffusion is critical for enabling new energy storage technologies. Here, we present a combined experimental and computational investigation into the ionic conductivity of Li6Y(BO3)3, a new class of solid electrolytes with a pseudo-layered structure. Temperature-dependent impedance spectroscopy shows the pristine material exhibits an ionic conductivity of 2.2 × 10⁻³ S cm−1 around 400 °C, despite the fact that density functional theory calculations point to multiple remarkably low-energy diffusion pathways. Our calculations indicate small energy barriers for lithium interstitials to diffuse along one-dimensional channels oriented in the c-direction, and also for lithium vacancies diffusing within ac planes. This coexistence of diffusion mechanisms indicates that Li6Y(BO3)3 is an extremely versatile host for exploring and understanding mechanisms for lithium-ion conductivity. We also find no evidence for reactivity with moisture in the atmosphere and that the material appears electrochemically stable when in direct contact with metallic lithium. This robust stability, alongside ionic conductivity that can be manipulated through appropriate aliovalent substitution, make Li6Y(BO3)3 an exceptionally promising new class of solid electrolyte.
1 Introduction
Today, the most widely used lithium-ion electrolytes consist of fluorinated salts dissolved in non-aqueous organic solvents.1 Setting aside safety and toxicity concerns, these salt solutions are incompatible with cell voltages above 5 V, which lies outside the window of electrochemical stability for these solvents.2 Accordingly, there have been intense efforts to identify solid electrolytes with greater electrochemical stability, which would represent a critical step towards all-solid-state batteries with higher open-circuit voltages and improved safety characteristics.3,4 To date, however, even the highest room-temperature ionic conductivities reported for solid electrolytes fall below those of commercial liquid electrolytes.5 Furthermore, known solid lithium-ion electrolytes are often notoriously unstable under operating conditions.6To be effective, solid electrolytes require high ionic conductivity, low electrical conductivity, and robust stability when in contact with alkaline metals like Li and Na.7 Developing new materials that meet these criteria is particularly challenging. Known solid electrolytes typically belong to one of a few structural families, notably perovskite,8–11 NASICON,12–15 or garnet16–21 lattices, which have all been heavily investigated over the years.
Here, we report the first observation of lithium-ion conductivity in Li6Y(BO3)3, which is structurally distinct from all of the previously known solid electrolytes. This is not the first study on Li6Y(BO3)3, but previous work has focused on the luminescent properties of rare-earth substituted compositions for use in lasers22–31 and neutron scintillation detectors.32,33 Although related borates like Li3BO3 and other ionically-conducting glasses have been studied,34–37 to our knowledge, this is the first study of ionic transport properties of Li6Y(BO3)3.
Using a combination of experimental and computational tools, we have investigated the nature of lithium transport through this new solid electrolyte. Temperature-dependent impedance spectroscopy on polycrystalline pellets shows an ionic conductivity of 2.2 × 10⁻³ S cm−1 near temperatures of 400 °C. Energy barriers for lithium-ion diffusion calculated using density functional theory show low-energy pathways for both lithium vacancies (0.23 eV) and lithium interstitials (0.20 eV), suggesting the potential for “bipolar” ionic conductivity, with the dominant conduction mechanism tunable through changes in sample stoichiometry. The presence of complex and numerous pathways for ionic conductivity in a robustly stable material makes Li6Y(BO3)3 a promising new framework for the continued development of fast Li-ion conducting solid electrolytes.
2 Experimental
2.1 Synthesis
Polycrystalline samples of Li6Y(BO3)3 were prepared via solid-state reactions using stoichiometric amounts of LiOH (Sigma Aldrich, ≥98%, powder), Y2O3 (Sigma Aldrich, 99.99%, powder) and H3BO3 (Sigma Aldrich, reagent grade plus ≥ 99.5%, powder). Prior to use, LiOH was dried at 300 °C for 24 h, and stored under vacuum. The starting materials were thoroughly ground for 30 min in an agate mortar, pressed into pellets using an isostatic press, and placed into a zirconia crucible. The resulting pellets were isolated from contact with the crucible using a small amount of powder with the same composition in order to avoid inadvertent contamination. The pellets were heated to 600 °C at 5 °C min−1 in a tube furnace under flowing N2 and held for 12 h to decompose the precursors. The pellets were subsequently ground, reformed into pellets, and heated to 600 °C at 5 °C min−1 for 24 h, always under a stream of flowing N2. This process was repeated three time to obtain phase pure materials according to standard laboratory X-ray diffraction. The use of N2 atmosphere was found to be critical for obtaining phase-pure samples, as will be discussed.2.2 Characterization
3 Theoretical methods
3.1 Density functional theory calculations
All density functional theory (DFT) calculations were performed using the VASP code.41,42 Interactions between the core and valence electrons were described with the PAW method.43 The calculations were performed using the PBEsol exchange–correlation functional.44 PBEsol is a revision of the PBE functional specifically tailored for solids, and yields structural data in excellent agreement with experiment. A planewave cutoff of 520 eV and a k-point sampling of 4 × 1 × 4 for the 76 atom unit cell of Li6Y(BO3)3 were used, with the ionic forces converged to less than 0.01 eV Å−1. Geometry optimized lithium vacancies, lithium interstitials, and Frenkel pairs were calculated in a 2 × 1 × 2 (304) atom supercell with a 2 × 2 × 2 Monkhorst–Pack special k-point grid, and all calculations were spin polarised.3.2 Climbing nudged elastic band calculations
Diffusion barriers for lithium vacancies and interstitials were calculated using the climbing nudged elastic band (CNEB) method,45 using the same 304 atom supercell as the geometry optimised defects, and only the Γ-point sampled. The end-point geometries were taken from the optimised defect structures. Each pathway was modeled using a minimum of three images (excluding the end-points), and was deemed to be converged when ionic forces on all images were less then 0.02 eV Å−1.4 Results
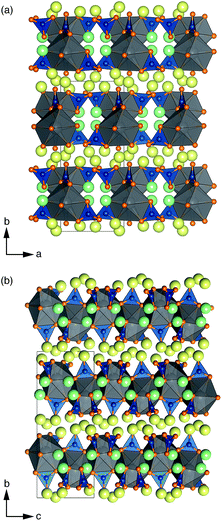
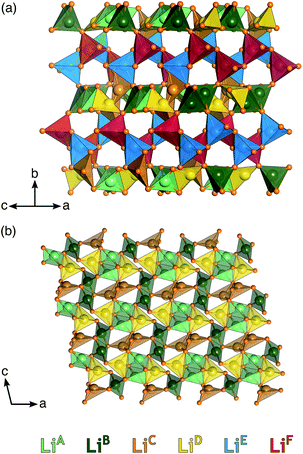
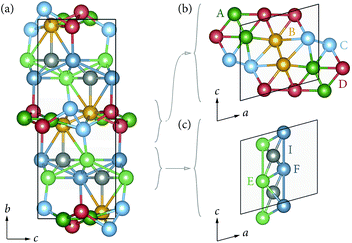
Li6Y(BO3)3 crystallizes in a monoclinic space group and can be considered a polyanionic compound since all of the oxygen ions in the structure are part of BO3 planar triangles (Fig. 1(a) and (b)). YO8 dodecahedra share edges with each other to form chains that zig–zag along the c-axis, with BO3 group fanning out perpendicular to the chain axis.Stoichiometric Li6Y(BO3)3 has six non-equivalent Li sites (see Fig. 2) in a dense and highly connected network. The layers containing the YO8 chains are separated by planes of lithium. These Li-rich planes contain four distinct sites, denoted LiA, LiB, LiC, and LiD, are colored yellow in Fig. 1(a) and (b). Each of the sites within this layer adopt a highly distorted tetrahedral environment, whereas the two other sites, LiE and LiF, are positioned between the YO8 chains, to form an edge-sharing chain of LiO5 trigonal bipyramids (see Fig. 2). All observed reflections could be indexed to the reported unit cell with no secondary reflections observed as seen in ESI Fig. S2.† Aside from the peak profile, only the lattice parameters could be accurately refined and were found to be a = 7.182(2) Å, b = 16.44(1) Å, c = 6.641(5) Å and β = 105.37(3)°, with RBragg = 6.99%.
4.1 Ionic conductivity
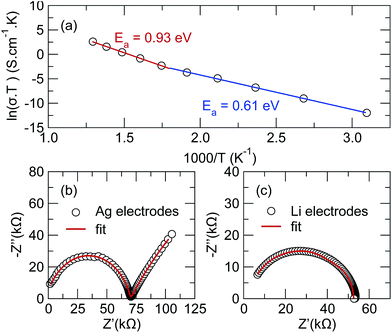
AC impedance measurements were collected between temperatures of 25 °C and 450 °C under flowing nitrogen, with the results shown in Fig. 3(a). Prior to measuring the impedance, differential scanning calorimetry and thermal gravimetric analysis were performed up to 1100 °C in N2, but showed no reactivity until the melting temperature of ∼870 °C (ESI Fig. S3†). This implies the title phase is exceptionally stable to very high temperatures and does not exhibit any phase changes over the temperature interval of interest.The ionic conductivity at room temperature was too low to measure; however, above 50 °C, impedance measurements using Ag electrodes reveal a single semicircle with a linear tail, as expected when the motion of Li-ions through the pellet is blocked at the interface of the silver electrode (Fig. 3(b)). Replacing silver with a non-blocking lithium foil, shown in Fig. 3(c), causes the tail to disappear, confirming its association with the diffusion of lithium through the pellet. Conductivity measurements using Li electrodes could only be collected to 150 °C due to the low melting point of metallic Li.
After heating, the Li electrodes were removed and no sign of discoloration could be seen on the pellet. To further test the stability of the phase when in contact with Li, a pellet was wrapped in Li foil, placed in a carbon-coated fused silica tube and heated to 300 °C for several hours. After gently peeling away the resulting ingot of Li, the pristine white pellet was recovered, demonstrating a very robust stability when in direct contact with metallic Li foil.
The single semicircle in the impedance data was fit using an equivalent circuit consisting of a resistor in series with two parallel CPE/resistor components; a model meant to take into account the contact resistance of the silver (or Li) in series with ionic conductivity through the bulk and grain boundaries of the pellet. Despite the significantly increased temperature, no contribution from electrical conductivity was detected, with the dc resistance of the pellet remaining outside the range of the voltmeter, suggesting it to be several MΩ at minimum. It should be noted that the data in Fig. 3(b) fails to pass through the origin because of the high frequency limit of the potentiostat and that since the pellet is not fully dense, the individual arcs associated with the grain boundary and bulk transport cannot be fully resolved. For this reason, the reported conductivity values should be taken as a lower estimate for the true bulk conductivity of the material.46 A table of the ionic conductivity values at each temperature is given in ESI Table S1.†
The temperature-dependent ionic conductivity, shown in Fig. 3(a), increases from 1.9 × 10⁻⁸ S cm−1 at 50 °C to 2.2 × 10⁻³ S cm−1 by 400 °C, indicating good ionic conductivities at higher temperatures. Two regions with distinctly different slopes can be see, with a crossover occurring around 300 °C. Fitting the interval between 50 °C and 300 °C to an Arrhenius expression gives an activation energy of Ea = 0.61 eV while fitting from 350 °C and 500 °C indicates an activation energy of Ea = 0.93 eV. The observation of two distinct linear regions in the Arrhenius plot is not uncommon, and generally indicates competition between two or more diffusion mechanisms.47
4.2 MAS NMR spectroscopy
MAS NMR experiments were performed to examine the local environments of lithium in the samples. We first collected 1H NMR data, which are shown on the left hand side of ESI Fig. S4.† No obvious differences were found between the empty rotor and samples made or stored in air for several weeks, showing no significant exchange of Li+ for H+ after synthesis. There is also no evidence that preparing the phase in air versus dry N2 results in proton substitution into the bulk. This stability with respect to proton exchange contrasts with Li-conducting garnets, such as Li6BaLa2Ta2O12, where rapid proton exchange can degrade the material's performance over time.21The right-hand side of ESI Fig. S4† shows signals between 15 and 20 ppm in the 11B spectra corresponding to the three crystallographic sites; broad as expected for boron in trigonal-planar coordination. A sharp signal close to 1 ppm, with an area of roughly 10%, seems to indicate a boron-containing impurity is present in samples that were prepared in open air. While the composition of this impurity can not be directly determined, preparing the materials under dry flowing N2 appears to suppress this signal, which suggests this is most likely the result of a deleterious reaction of LiOH or H3BO3 with moisture in the atmosphere. Most importantly, once formed we find no evidence for proton exchange with the atmosphere in these materials.
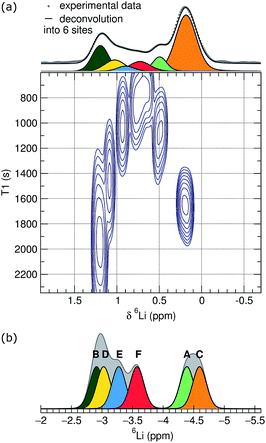
Due to broadening effects of homonuclear dipolar coupling and the second-order quadrupolar interaction in 7Li NMR, the 7Li NMR spectrum contains only a single unresolved peak, which corresponds to a number of unique Li sites and coordination environments.48 Higher resolution spectra are possible for 6Li, due to the narrower line widths of the center band resonances that result from weaker quadrupolar and homonuclear dipolar coupling interactions of 6Li compared to 7Li. To improve the resolution further, we conducted a series of 6Li inversion-recovery experiments, which allow the resolution of signals as a function of the spin–lattice relaxation time, T1. The 6Li T1 data, shown as a pseudo-2D NMR contour plot in the bottom part of Fig. 4(a), reveal at least six different components, corresponding to distinct Li sites or groups of sites with similar spin–lattice relaxation behavior at room temperature. The T1 times for those components range from 850 to 2200 s, with the slowest spin-relaxation processes observed for the Li nuclei associated with the chemical shifts at the edges of the overlapping 6Li spectral feature at 0.2 and 1.3 ppm, respectively. The 1D trace projected on the top panel was derived by adding up the spectra of the three inversion-recovery experiments with the longest relaxation delay times and can be considered an adequate representation of a single pulse experiment with the required long relaxation delay.
Based on the T1 resolved results, this trace was deconvoluted with a good fit into six spectral components. A static picture of the crystal structure would suggest that lithium occupies each of the six distinct crystallographic sites, Li{A–F}, in equal proportion. The integrated areas for the six components of the 6Li spectrum, however, are not all equal, but instead show relative populations from 1 to 0.09. Fitting with more equal-ratio spectral components would require deconvolution into at least nine functions, with multiple sites being concentrated around the extremes of the chemical shift range. We interpret this population inhomogeneity as indicating lithium-exchange between different sites on an NMR timescale, and can speculate that the signals at the edges of broad feature in the 1D trace correspond to collections of highly similar lithium environments that are preferentially occupied by lithium.
To help assign these NMR data, we used density functional theory (DFT) to calculate Li chemical shifts for each of the six crystallographic sites in the perfect Li6Y(BO3)3 structure, which were then used to construct a simple simulated 6Li spectrum by convoluting with a Gaussian line shape (Fig. 4(b)). It is important to keep in mind that T1 relaxation is a complex phenomenon that can not yet be accurately simulated, and a quantitative comparison of the DFT simulations and the experimental T1 NMR results is not possible. The shape and width of the simulated spectrum, however, do agree well with the experimental results. Although the calculated chemical shifts are systematically moved upfield by approximately 5 ppm, the calculated chemical shift differences are in good qualitative agreement with the observed distribution of maxima in the pseudo-2D spectrum.
Comparing the experimental and simulated 6Li NMR data, the fastest T1 times can be assigned to the LiE and LiF sites—the two sites located in the chains found in the same plane as the YO8 and BO3 groups—and the longer T1 times assigned to sites LiA–D—located in the Li-rich layers of the crystal structure.
4.3 Computational Li-diffusion profiles
The presence of multiple non-equivalent Li sites in Li6Y(BO3)3 makes a mechanistic description of lithium-ion transport a particular challenge. To better understand the role of lithium disorder and diffusion by competing pathways, we performed DFT calculations on lithium interstitials, vacancies, and Frenkel pairs, and calculated potential energy barriers for lithium vacancy and interstitial point defect diffusion.4.4 Lithium defect energies
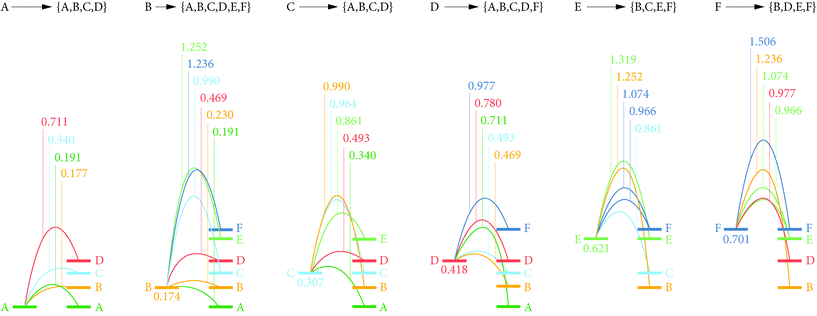
We first calculated relative energies for lithium vacancies at each of the six non-equivalent lithium sites. The calculated vacancy formation energies are listed in ESI Table S2.† The preferred vacancy position is site LiA, with a vacancy formation energy of 4.09 eV (relative to metallic Li). Relative to the LiA site, vacancies at the other three sites in the Li-rich ac planes (LiB–D) are higher in energy by between 0.18 eV and 0.42 eV. In contrast, vacancy energies at LiE and LiF (those lithium sites in the 1D c chains) are higher than LiA by 0.62 eV and 0.70 eV respectively. Li vacancies, therefore, preferentially occupy the dense Li-rich LiA–D planes, which can be explained by the expected large reduction in Li–Li repulsion. The relatively low lithium ion density between the YO8 chains means interstitial lithium can be accommodated in between the LiE and LiF sites. The formation energy for interstitials at this site, relative to metallic Li, is 1.44 eV. The Frenkel pair formation energy was calculated as the difference in energy between a perfect stoichiometric system, and a Frenkel-pair-defective system with a vacancy at LiA (the lowest energy vacancy site) and an interstitial at a non-adjacent interstitial site. This gave a formation energy of 0.81 eV (Fig. 5).4.5 Lithium diffusion barriers
To identify preferred diffusion pathways for lithium vacancies we considered potential paths between all lithium-site pairs with separations ≤4 Å (15 paths in total), and calculated barriers using the CNEB approach. These calculated diffusion barriers are shown schematically in Fig. 6.The lowest energy diffusion pathway for Li vacancy hopping is via LiA → LiB → LiB → LiA, which has a maximum barrier height of 0.23 eV. Vacancy diffusion via LiA → LiC → LiA → LiA has a slightly higher maximum barrier height of 0.34 eV. Lithium-vacancy transport along the b direction requires involvement of the LiE and LiF sites. These sites have the highest vacancy energies, and are also associated with large vacancy diffusion barriers. The lowest-energy vacancy-hopping process along b proceeds via LiC → LiE → LiF → LiD → LiC, and has a maximum barrier of 0.97 eV. The high vacancy diffusion barriers for transport along b means lithium-vacancy transport is effectively restricted to a 2D process within the Li-rich ac planes.
For lithium interstitial transport, the c-aligned chains of YO8 polyhedra block direct diffusion along a. We therefore only consider transport along b and c; in each case calculating CNEB barriers for interstitialcy mechanisms along these directions. The first considered interstitialcy mechanism involved only the LiE/LiF sites and corresponds to one-dimensional transport along the c-oriented channels. Instead of jumping directly to a neighbouring interstitial site, interstitial Li displaces a neighbouring lithium ion at either a LiE or LiF site, and this second moves to occupy the adjacent interstitial site. In the second considered interstitialcy mechanism, the interstitial lithium moves along b into the Li-rich ac plane, displacing the closest LiB ion. This second ion moves to the adjacent LiB site, displacing a third ion that moves along b to a new interstitial site. The CNEB calculated barriers for these two mechanisms are 0.20 eV for c-channel diffusion involving exchange with the LiF site (0.26 eV via the LiE site), and 0.80 eV for diffusion along b. This indicates interstitials can undergo rapid one-dimensional transport along the LiE/LiF channels aligned along c, whereas interstitial transport through the Li-rich LiA–D planes (which is necessary for transport along b or indirect transport along a) is much less effective. We attribute this highly anisotropic behaviour to a large energy penalty associated with disrupting the dense lithium packing in the LiA–D plane.
The calculated point-defect diffusion barriers reveal low energy pathways of 0.23 eV and 0.20 eV respectively for both lithium vacancies and interstitials. This suggests Li6Y(BO3)3 may exhibit “bipolar” ionic conductivity, where the dominant lithium-transport process depends on the precise defect stoichiometry of the samples. Interestingly, interstitial and vacancy diffusion are both predicted to be highly anisotropic, and also to preferentially occur in different regions of the crystal lattice. Vacancy diffusion is favored along a and c directions within the LiA–D layers, but again disfavored along b, because of the high vacancy energies for the LiE/LiF sites. Interstitial diffusion, in contrast, is favored along the LiE/LiF chains oriented along the c-axis, but disfavored along b, which involves disruption of the LiA–D layers (and effectively blocked along a by the YO8 chains).
5 Discussion
Our DFT calculations reveal extremely low barriers for lithium interstitial and vacancy diffusion (0.20 eV and 0.23 eV respectively). In highly stoichiometric samples, however, intrinsic concentrations of lithium interstitial or vacancy defects are small, and lithium conduction at even moderate temperatures requires thermal formation of Frenkel pairs. In this case measured conduction activation energies will depend on both the Frenkel pair formation energy and the hopping energy of the most mobile defect, via | (1) |
Above 325 °C the observed activation energy increases to 0.93 eV. This can be explained either by competing diffusion mechanisms, or competing defect formation processes, which start to contribute to net ionic conduction at these elevated temperatures. In the latter case, the increase in activation energy is consistent with Frenkel pair formation with vacancies at sites LiE/LiF, which would increase the total number of interstitials available to conduct along the c channels, and corresponds to a predicted activation energy of 0.92 eV.
The relatively high activation energy of 0.61 eV in the low-temperature regime means that not enough carriers are mobile enough to measure the ionic conductivity of pristine Li6Y(BO3)3 at room temperature. It should be emphasised, however, that this is the case for the formally stoichiometric material, and our calculated defect energies and diffusion barriers support the model that in this pristine material lithium-ion conduction is dependent on intrinsic Frenkel pair formation. The relatively low calculated barriers of 0.20 eV for lithium interstitial transport along c, and 0.23 eV for lithium vacancy transport in the ac plane suggest that non-stoichiometric forms should exhibit significantly higher extrinsic ionic conductivity. Indeed, controlling lithium stoichiometry through aliovalent substitutions is a straightforward route to enhanced ionic conductivities in other solid lithium-electrolytes.8 Notably, the calculated barriers for both vacancy and interstitial transport in Li6Y(BO3)3 are lower than for the “best in class” Li-garnet of 0.35 eV.7 The existence of low energy defect diffusion pathways for both interstitials and vacancies suggests both sub- and supervalent doping strategies might produce high room-temperature ionic conductivities. Coupled with the spatially distinct regions for interstitial versus vacancy diffusion (via 1D c channels for interstitials, and 2D ac layers for vacancies) Li6Y(BO3)3 presents a particularly versatile host framework for exploring lithium-ion conductivity. Combined with exceptional electrochemical stability with respect to moisture and under high voltages, Li6Y(BO3)3 is a highly promising new framework for the future development of new solid electrolytes that exhibit fast ionic conductivity that could be tuned at the synthetic level.
6 Conclusions
In summary, we have characterized the temperature-dependent Li-ion conductivity of Li6Y(BO3)3 using an array of experimental and computational tools. While the ionic conductivity does not reach 2.2 × 10⁻³ S cm−1 until temperatures as high as 400 °C, the thermal and electrochemical stability of the pristine phase offers the promise of an exceptionally robust solid electrolyte if the ionic conductivity at room temperature can be enhanced. Defect formation energies and lithium-ion diffusion barriers calculated using density functional theory calculations support the model that in the pristine stoichiometric material lithium conductivity is limited by Frenkel pair formation, but that greatly improved ionic conductivities associated with activation energies as low as 0.20 eV could achieved through appropriate aliovalent chemical substitution to achieve Li-ion non-stoichiometry. Thus, proper modifications to the pristine Li6Y(BO3)3 should serve as a promising new platform for the development of high performance solid electrolytes.Acknowledgements
B. C. M., B. A. L. B., W. G. Z., and S. Z. gratefully acknowledge financial support through start-up funding provided by the Dana and David Dornsife College of Letters and Sciences at the University of Southern California. A. J. L. gratefully acknowledges support of Swiss National Science Foundation fellowship number PBSKP2-145825. W. G. Z. also acknowledges the support by a fellowship within the Postdoc-Program of the German Academic Exchange Service (DAAD). B. J. M. acknowledges support from the Royal Society (UF130329). D. O. S. acknowledges support from EPSRC (EP/N001982/1). The computational work presented here made use of the ARCHER supercomputer through our membership of the UK's HPC Materials Chemistry Consortium, which is funded by EPSRC grant EP/L000202. The authors also acknowledge use of the MRL facilities at UCSB, part of the MRSEC Program of the NSF under Award No. DMR 1121053; a member of the NSF-funded Materials Research Facilities Network.References
- J.-M. Tarascon and M. Armand, Nature, 2001, 414, 359–367 CrossRef CAS PubMed.
- K. Xu, Chem. Rev., 2014, 114, 11503–11618 CrossRef CAS PubMed.
- J. B. Goodenough and K.-S. Park, J. Am. Chem. Soc., 2013, 135, 1167–1176 CrossRef CAS PubMed.
- Y. Shao, F. Ding, J. Xiao, J. Zhang, W. Xu, S. Park, J.-G. Zhang, Y. Wang and J. Liu, Adv. Funct. Mater., 2013, 23, 987–1004 CrossRef CAS.
- N. Kamaya, K. Homma, Y. Yamakawa, M. Hirayama, R. Kanno, M. Yonemura, T. Kamiyama, Y. Kato, S. Hama, K. Kawamoto and A. Mitsui, Nat. Mater., 2011, 10, 682–686 CrossRef CAS PubMed.
- L. Truong, S. Narayanana and V. Thangadurai, ECS Trans., 2013, 45, 21–29 CrossRef.
- V. Thangadurai and W. Weppner, Ionics, 2006, 12, 81–92 CrossRef CAS.
- S. Stramare, V. Thangadurai and W. Weppner, Chem. Mater., 2003, 15, 3974–3990 CrossRef CAS.
- P. Birke, S. Scharner, R. A. Huggins and W. Weppner, J. Electrochem. Soc., 1997, 144, L167–L169 CrossRef CAS.
- Y. Inaguma, C. Liquan, M. Itoh, T. Nakamura, T. Uchida, H. Ikuta and M. Wakihara, Solid State Commun., 1993, 86, 689–693 CrossRef CAS.
- E. E. Jay, M. J. D. Rushton, A. Chroneos, R. W. Grimes and J. A. Kilner, Phys. Chem. Chem. Phys., 2015, 17, 178–183 RSC.
- H. Aono, E. Sugimoto, Y. Sadaoka, N. Imanaka and G. Adachi, J. Electrochem. Soc., 1989, 136, 590–591 CrossRef CAS.
- H. Aono, E. Sugimoto, Y. Sadaoka, N. Imanaka and G. Adachi, J. Electrochem. Soc., 1990, 137, 1023–1027 CrossRef CAS.
- B. Wang, M. Greenblatt, S. Wang and S. J. Hwu, Chem. Mater., 1993, 5, 23–26 CrossRef CAS.
- Z. Liu, S. Venkatachalam and L. van Wüllen, Solid State Ionics, 2015, 276, 47–55 CrossRef CAS.
- R. Murugan, V. Thangadurai and W. Weppner, Angew. Chem., Int. Ed., 2007, 46, 7778–7781 CrossRef CAS PubMed.
- E. J. Cussen, T. W. S. Yip, G. O'Neill and M. P. O'Callaghan, J. Solid State Chem., 2011, 184, 470–475 CrossRef CAS.
- E. J. Cussen, J. Mater. Chem., 2010, 20, 5167–5173 RSC.
- Y. Li, J.-T. Han, C.-A. Wang, H. Xie and J. B. Goodenough, J. Mater. Chem., 2012, 22, 15357–15361 RSC.
- J. Han, J. Zhu, Y. Li, X. Yu, S. Wang, G. Wu, H. Xie, S. C. Vogel, F. Izumi, K. Momma, Y. Kawamura, Y. Huang, J. B. Goodenough and Y. Zhao, Chem. Commun., 2012, 48, 9840–9842 RSC.
- W. G. Zeier, S. Zhou, B. Lopez-Bermudez, K. Page and B. C. Melot, ACS Appl. Mater. Interfaces, 2014, 6, 10900–10907 CAS.
- A. R. Devi and C. K. Jayasankar, Mater. Chem. Phys., 1995, 42, 106–119 CrossRef.
- V. Jubera, J. P. Chaminade, A. Garcia, F. Guillen and C. Fouassier, J. Lumin., 2003, 101, 1–10 CrossRef CAS.
- E. F. Dolzhenkova, V. N. Baumer and A. V. Tolmachev, Crystallogr. Rep., 2005, 50, 1060–1064 CrossRef.
- R. P. Yavetski, E. F. Dolzhenkova, M. F. Dubovik, T. I. Korshikova and A. V. Tolmachev, Crystallogr. Rep., 2005, 50, S88–S91 CrossRef.
- J. Sablayrolles, V. Jubera, J.-P. Chaminade, I. Manek-Hönninger, S. Murugan, T. Cardinal, R. Olazcuaga, A. Garcia and F. Salin, Opt. Mater., 2005, 27, 1681–1685 CrossRef CAS.
- J. Sablayrolles, V. Jubera, F. Guillen, R. Decourt, M. Couzi, J. Chaminade and A. Garcia, Opt. Commun., 2007, 280, 103–109 CrossRef CAS.
- J. Sablayrolles, V. Jubera, M. Delaigue, I. Manek-Hönninger, J.-P. Chaminade, J. Hejtmanek, R. Decourt and A. Garcia, Mater. Chem. Phys., 2009, 115, 512–515 CrossRef CAS.
- I. N. Ogorodnikov, I. N. Sedunova, A. V. Tolmachev and R. P. Yavetskiy, Opt. Spectrosc., 2012, 113, 66–72 CrossRef.
- A. Péter, K. Polgár and M. Tóth, J. Cryst. Growth, 2012, 346, 69–74 CrossRef.
- T. Koroleva, M. Kidibaev, A. Nehari, C. Pedrini, K. Lebbou, A. Belsky, A. Tcherepanov, A. Ishchenko, V. Ivanov, I. Sedunova, O. Teslenko, L. Viktorov, B. Shulgin, L. Zheng, J. Xu, V. Kononets and O. Sidletskiy, Opt. Mater., 2013, 35, 868–874 CrossRef CAS.
- J. B. Czirr, G. M. MacGillivray, R. R. MacGillivray and P. J. Seddon, Nucl. Instrum. Methods Phys. Res., Sect. A, 1999, 424, 15 CrossRef CAS.
- B. Lire, C. Re, Y. Heng, R. Jia, Z. Fu, G. Ren, F. Yang, S. Pan, S. Li, X. Chen, S. Qian and G. Huang, IEEE Nucl. Sci. Symp. Conf. Rec., 2011, 4627–4631 Search PubMed.
- T. Minami, J. Non-Cryst. Solids, 1985, 73, 273–284 CrossRef CAS.
- M. I. Pantyukhina, G. V. Zelyutin, N. N. Batalov and V. P. Obrosov, Russ. J. Electrochem., 2000, 36, 792–795 CrossRef CAS.
- S. Ohta, S. Komagata, J. Seki, T. Saeki, S. Morishita and T. Asaoka, J. Power Sources, 2013, 238, 53–56 CrossRef CAS.
- L. Jinlian, W. U. Xianming, C. Shang, C. Jianben and H. Zeqiang, Bull. Mater. Sci., 2013, 36, 687–691 CrossRef.
- H. M. Rietveld, J. Appl. Crystallogr., 1969, 2, 65–71 CrossRef CAS.
- J. Rodríguez-Carvajal, Phys. B, 1993, 192, 55–69 CrossRef.
- R. Tycko, E. Schneider and A. Pines, J. Chem. Phys., 1984, 81, 680–688 CrossRef CAS.
- G. Kresse and J. Hafner, Phys. Rev. B, 1994, 49, 14251–14271 CrossRef CAS.
- G. Kresse and J. Furthmüller, Phys. Rev. B, 1996, 54, 11169–11186 CrossRef CAS.
- G. Kresse and D. Joubert, Phys. Rev. B, 1999, 59, 1758–1775 CrossRef CAS.
- J. Perdew, A. Ruzsinszky, G. Csonka, O. Vydrov, G. Scuseria, L. Constantin, X. Zhou and K. Burke, Phys. Rev. Lett., 2008, 100, 136406 CrossRef PubMed.
- G. Henkelman, B. P. Uberuaga and H. Jónsson, J. Chem. Phys., 2000, 113, 9901–9904 CrossRef CAS.
- V. Thangadurai, H. Kaack and W. J. F. Weppner, J. Am. Ceram. Soc., 2003, 86, 437–440 CrossRef CAS.
- R. J. Cava and E. A. Rietman, Phys. Rev. B, 1984, 30, 6896–6902 CrossRef CAS.
- Z. Xu and J. F. Stebbins, Solid State Nucl. Magn. Reson., 1995, 5, 103–112 CrossRef CAS PubMed.
Footnote |
| † Electronic supplementary information (ESI) available: The supporting information contains the thermal analysis data, scanning electron micrographs, and tables of the ionic conductivity and calculated vacancy formation energies of Li6Y(BO3)3. See DOI: 10.1039/c5ta09436d |
| This journal is © The Royal Society of Chemistry 2016 |

