 Open Access Article
Creative Commons Attribution 3.0 Unported Licence
Slow water transport in MgSO4 aerosol droplets at gel-forming relative humidities†
Chen
Cai
a,
Seehua
Tan
a,
Hongnan
Chen
a,
Jiabi
Ma
a,
Yang
Wang
a,
Jonathan P.
Reid
*b and
Yunhong
Zhang
*a
aThe Institute of Chemical Physics, School of Chemistry, Beijing Institute of Technology, Beijing 100081, People's Republic of China. E-mail: yhz@bit.edu.cn
bSchool of Chemistry, University of Bristol, Bristol BS8 1TS, UK. E-mail: j.p.reid@bristol.ac.uk
First published on 30th September 2015
Abstract
The effect of gel formation on the mass transfer of water during evaporation or condensation from MgSO4 droplets is studied using aerosol optical tweezers coupled with Raman spectroscopy. In particular, the kinetics of water transport during hydration and dehydration are followed for variable step changes in relative humidity and compared with previous measurements using different methodologies. Slow diffusion of water in the particle bulk is shown to limit water evaporation and condensation from the aerosol. Desorption of water continues over a long time at the very low RH region and this is validated with complementary studies made by FTIR-ATR and measurements of water adsorption isotherms. The observations can be rationalized when considering the possible phase transformation of the gel structure at very low RHs. Finally, the influence of the duration of the drying time (RH ≤ 10%) on the kinetics of condensation during hydration is investigated. Apparent diffusion coefficients of water molecules in the gel are obtained, showing little dependence on the water activity and droplet composition, and are consistent with the slow removal of water during drying from pores formed at the gel transition RH.
I. Introduction
Atmospheric aerosols originate from natural sources and anthropogenic activities and range in size over more than four magnitudes, extending from fine-mode nucleated clusters to cloud droplets and coarse-mode dust particles, tens of microns in size.1 Not only do atmospheric aerosols have an impact on human health,2 but also they affect the global climate directly and indirectly. For the direct effect, aerosols scatter and absorb solar and terrestrial radiation.3–5 The indirect effect of aerosol particles originates from their role as cloud condensation nuclei (CCN) and ice nuclei (IN),6 influenced by the hygroscopic characteristics of the atmospheric aerosols. The water uptake capacity of particles governs their equilibrium size and, thus, determines their light scattering ability and the cloud-droplet nucleation efficiency.Briefly, there are several factors that influence the equilibrium partitioning and kinetics of transport of water into and from aerosol droplets, including the variation of gas phase composition (specifically relative humidity, RH) and the water activity at the surface of the droplet, the diffusion constant of water within the particle bulk and the transport kinetics through the surface region.7 The solute effect governs the equilibrium composition by determining the concentrations of solutes within a particle and the response to changes in RH.8 Nevertheless, exceptional cases have been observed with the formation of semi-solid amorphous phases such as gels and glasses at low relative humidity in which the equilibrium state is not attained and the composition is kinetically determined.9 For these amorphous phases, the slow diffusion of water within the particle bulk can govern the rate and can lead to the formation of internal concentration gradients. Therefore, investigating the conditions under which amorphous states form is essential to more accurately interpret and predict aerosol properties and processes.
A comprehensive outline of the properties of amorphous aerosol particles and their comparison with crystalline particles has been presented by Mikhailov et al.10 Virtanen et al.11 provided the first experimental evidence that biogenic secondary organic aerosol (SOA) particles can exist in a glassy state under ambient conditions. Zobrist et al.12 concluded that organic and multi-component aerosols can readily form glasses at low, but atmospherically relevant temperatures (≤230 K). Various inorganic aerosol components13–15 have also been found to form amorphous phases. Iodic acid solution droplets,13 held by an electro-dynamic trap at ∼10% RH, were shown to exist as an ultra-viscous liquid and even in a glassy state.
The measurements of water evaporation and condensation from single glassy sucrose droplets were carried out using an electro-dynamic balance (EDB)16 and later compared with measurements performed with aerosol optical tweezers.17 The results of both studies confirmed that slow mass transfer of water between the gas and condensed phase significantly impairs the access to the thermodynamically determined equilibrium state and glassy (kinetically determined) states are formed.18 Bones et al.19 demonstrated that the mass transfer limitation is significant for ultra-viscous aerosol as well as for glassy aerosol and that disequilibrium can persist for many hours in a mixed component aerosol containing sucrose, sodium chloride and water. Although sucrose aerosol has provided a useful benchmark system for investigating the relationship between the particle phase, viscosity and water diffusion, Price et al. have recently measured the diffusion constant of water in atmospherically relevant secondary organic materials (SOM) derived from α-pinene ozonolysis.20 Price et al.20 concluded that water transport remains fast for this system for particle sizes in the accumulation mode typical for the atmosphere (D > 10−15 m2 s−1) even at low temperature (∼240 K) and low RH (∼20%): equilibration times were predicted to increase to longer than 100 s only at temperatures lower than 220 K. By contrast, the mechanical properties of the SOM suggest that it has the material properties of a solid, further reinforcing the challenges in predicting water transport kinetics in amorphous aerosols when the Stokes–Einstein relation between the diffusion constant and viscosity cannot be assumed.21
In this publication, we present water transport measurements in an aerosol in a gel-state, defined as a two-phase mixture of a liquid dispersed in a semi-solid amorphous matrix formed from a colloidal or polymer network. It has been suggested that the dehydration of some organic aerosol can lead to the formation of highly porous gel-like structures.10 Conversely, hydration leads to gradual swelling as well as discrete changes in the water content characteristic of well-defined thermodynamic transitions. Structural defects (veins and pores) can hasten the water uptake, reducing the timescale for transitions to the fully solubilized state at deliquescence.22,23 By contrast, it has also been suggested that the formation of gel-like structures may inhibit molecular diffusion near the surface of a particle and impose a kinetic limitation on water adsorption and absorption,10 although this suggestion is largely based on measurements of diffusional kinetics in bulk samples.24–27 Aqueous oxalic acid and levo-glucosan aerosol have been shown to exhibit trends in their hydration/dehydration behaviour that suggest they may exist as gels at low RH.10 For most gel-forming organic aerosols studied to date (including carboxylic acids, carbohydrates and protein macromolecules), the onset of gel-like swelling during an hydration cycle occurs at RHs in the range 30–40% but complete deliquescence may occur over a much broader range, even up to 60% to 90% RH, depending on the solubility.10 Direct measurements of the properties of aerosols in a gel state are sparse and more work is essential.
By using an electro-dynamic balance, Chan et al.15 observed severe mass transport resistance for water evaporation from MgSO4, Mg(COOCH3)2, ZrO(OH)Cl and Zr(COOCH3)4 solution droplets and it was suggested that these components can form gels at high concentrations. Among them, MgSO4 aerosol has received attention due to its prevalence in sea salt aerosol.28–32 Recent chemical and spectroscopic data have provided evidence for the occurrence of various hydrated Mg-sulfate minerals on the surface of Mars.33,34 Following the suggestion that levitated MgSO4 droplets form a gel at low RH,14 a more systematic investigation of the deliquescence and efflorescence phase behavior was carried out using an EDB coupled with Raman spectroscopy.30 Through the evaluation of the peak wavelength and the full width at half height (FWHH) of the ν1-SO42− Raman band with varying water-to-solute (WSR) ratio and change in RH, the presence of a polymeric bidentate chain structure in a highly supersaturated MgSO4 droplet (WSR < 6) was proposed to contribute to gel formation with the possibility of limiting water transport. A detailed structural clarification of MgSO4 ion-pairing was provided by dielectric relaxation spectroscopy (DRS) performed by the group of Buchner.35 These measurements indicated that different species (i.e., free hydrated ions, double solvent-separated ion pairs, DSIPs, solvent-shared ion pairs, SIPs, and contact ion pairs, CIPs) varied in their relative proportions with change in water activity and solute concentration. Wang et al.31 examined solution droplets deposited on a hydrophilic quartz substrate. Spatially resolved measurements of composition of spheroidal MgSO4 droplets were realized with confocal Raman spectroscopy. The strategy allowed the acquisition of more detailed information on the formation and loss of ion pairs accompanying evaporation and condensation of water, respectively. The study revealed a hysteresis in the decomposition of chain-structured contact ion-pairs (CIPs) in the humidifying process of the MgSO4 droplet when RH is <40%, leading to inhibition in water transport.
Spatially resolved measurements of the kinetics of water transport into and out of MgSO4 droplets were conducted by Li et al.33 by monitoring the isotope exchange of D2O initially contained in the MgSO4 droplet with the ambient H2O water vapor. Different temporal dependencies of the composition at the droplet center and at the surface were compared with confocal Raman measurements, revealing the presence of significant compositional gradients within a particle. Recently, Davies et al.36 examined the evaporation and condensation kinetics of water from MgSO4 droplets levitated in an EDB following rapid changes in RH. Continual loss of water persisted over a timescale on the order of hours following gel formation.
In this publication, we extend the exploration of the bulk diffusional limited water transport in aerosol, studying the kinetics of water transport in MgSO4 aerosol droplets using optical tweezers coupled with Raman spectroscopy. Optical tweezers offer an alternative to EDBs for trapping particles, with droplet radii typically in the range of 2 to 10 μm. In a recent paper, it was shown that the size and the refractive index of a particle (accuracy better than ±0.11% or ±0.0012) can be obtained simultaneously by using the unique information provided by the whispering gallery modes (WGMs) of Raman scattering spectra.36 Thus, the spectroscopic measurements allow the evaporation and condensation of water at the droplet surface to be monitored.37 Here, we focus on the bulk-limited water transport after the onset of gel formation. The RH surrounding an MgSO4 droplet was altered in a step-wise manner and the timescale for the evaporation and condensation of water was measured. An evaporation experiment using FT-IR spectroscopy within a similar RH range was carried out in parallel, complementing the optical tweezing-Raman spectroscopy study. With gel structures likely to be highly porous upon drying,38 surface analysis of MgSO4 was conducted using a physisorption analyzer over a wide RH range.
II. Experimental description
The aerosol optical tweezers technique has been discussed in previous publications.37,39–41 Fig. S1 (ESI†) shows a schematic diagram of the single gradient force optical trap used in this study. The optical trap was formed by focusing the beam (514.5 nm, 100 mW) from an argon-ion laser (Melles-Griot 43 series) through an Olympus UIS2 PlanCN 100× oil immersion objective (1.25 N.A.). A custom-fabricated sample cell with a volume of ∼7 cm3 was used for the confinement of aerosol droplets. The apertures on the bottom and top face of the sample cell allow the coverslip to be mounted and provide access for bright-field illumination. Four ports, situated around the side wall of the cell, allow the introduction of the aerosol flow, a humidified stream of nitrogen gas and serve as outlets for the gas and excess aerosol flow.The tightly focused beam exerts a gradient force on aerosol particles that drift into the focal volume, drawing the particle into the region of highest intensity, i.e., the center of a beam. Droplets of 0.5 M MgSO4 solution (prepared by dissolving analytical grade salt in triply distilled water) generated by the medical nebulizer (Yuyue 402AI model) were introduced into the sample cell and a single droplet from the cloud was captured. The further growth of the trapped particle was achieved through coalescence with other free-moving aerosol droplets in the cell. The backscattered light collected by the microscope objective was filtered to remove the Rayleigh scattering at around 514.5 nm using a notch filter. Raman light was then focused using a 200 mm plano-convex lens onto the entrance slit of a spectrograph (Acton SpectraPro 2300i) equipped with an 1800 groves per mm grating and spatially resolved on the charge coupled device (Princeton Instruments, NTE/CCD detector) with a pixel array of 1024 × 256, recording the spectra with 1 s time resolution.
A blue LED centered at 455 nm was adopted as the illumination source for imaging the trapped droplets, and the light reflected from the beam splitter was projected onto a camera (Watec, 1/3 in., model 231S2) after removing scattered laser light with a short pass filter. This allowed the collection of images from the underside of the droplet, referred to as in-plane imaging. The environmental RH experienced by the trapped aerosol droplet was controlled by adjusting the flow ratio of dry and wet nitrogen, humidified through a bubbler filled with pure water. The flow rates were controlled by independent mass flow controllers (Alicat Scientific), although the combined gas flow introduced into the cell was kept constant at 0.15 L min−1. The RH and the temperature of the combined gas flow were measured by positioning probes (Center 313) before the trapping cell and in the outflow from the cell. The uncertainty of RH determination was ±2%.
The size and the refractive index of the droplet can be inferred with high accuracy from the evolving fingerprint of amplified stimulated Raman scattering signals at wavelengths commensurate with WGMs occurring in the range of the Stokes shift corresponding to O–H excitation (∼3000 to 3600 cm−1, 610–640 nm).36 In this publication, two types of evaporation and condensation measurements were made. In the first set, various steps in RH change were imposed on a confined droplet, both examining the evaporation and condensation processes. The RH range spanned from ∼55% down to ∼4%, covering the critical range of gel formation. The second set of experiments focused on repeated cycles of dehumidification–humidification below and above the RH of gel formation. The drying (waiting) time for the droplet below the RH for gel formation was varied to examine the dependence of the condensation rate on the extent of drying of the gel.
The FTIR-ATR instrument used for studying MgSO4 droplets deposited on an ATR crystal is shown in Fig. S2 (ESI†). The system is composed of a Nicolet Magna-IR model 560 FTIR spectrometer equipped with a liquid-nitrogen cooled mercury–cadmium–telluride type A (MCT-A) detector. The key unit is a chamber composed of a baseline horizontal ATR cell (Spectra-Tech Inc., USA) with a ZnSe crystal internal reflection element (IRE) used as a substrate. The incident beam is at an angle of 45° with respect to the top probe surface of ZnSe crystal IRE, making about 12 internal reflections. Firstly, aerosol particles were generated from a 0.5 M MgSO4 solution by using a nebulizer and were drawn into the chamber and deposited on the ATR crystal substrate. The total volume of particles deposited was monitored through the intensity of the absorption peak (such as ν3-SO42−) in the spectra. This is to ensure the low surface coverage of the ATR crystal, discriminating against the agglomeration of aerosol particles.
The RH in the chamber was adjusted by controlling the ratio of dry and wet vapor saturated nitrogen gas streams with mass flow controllers (Alicat Scientific). The wet gas stream was humidified by passing the dry N2 gas from a zeolite bubbler, generating many small bubbles and facilitating RH elevation, through a bottle filled with pure water. The RH and the temperature were recorded using a RH probe (Center 313, ±2.5% uncertainty) placed in the outflow from the chamber. The efflorescence of MgSO4 particles was monitored by a step-wise decrease of relative humidity, and spectra in the range of 650–4000 cm−1 were recorded upon equilibrium at every RH step. Generally, scans in one collection spanning ∼20 s were used to produce the final spectrum with a resolution of 4 cm−1.38
When water vapor is used as an adsorbate in a physisorption analyzer, adsorption and desorption measurements of water can provide quantitative measurements of the hygroscopic properties of the deposited aerosol particles.42 In this publication, the isothermal adsorption of water by an anhydrous solid MgSO4 sample was obtained using a BELSORP-max physisorption analyzer (BEL JAPAN, INC.)43,44 equipped with a thermostatic water bath (Beijing Bilang). Further details of the BELSORP-max physisorption analyzer and the methods used are discussed in the ESI.†
III. Results and discussion
Measurements of the evaporation and condensation of water from MgSO4 particles were primarily performed using aerosol optical tweezers. These measurements were supported by complementary data from the FTIR-ATR spectrometer and the physical adsorption analyzer.A. Water transport kinetics as measured by aerosol optical tweezers and FTIR-ATR
By tracking the shifting wavelengths of WGMs appearing in the Raman spectra of tweezed droplets and comparing them with those calculated from Mie scattering theory, the size and the refractive index of a homogeneous droplet can be determined with high accuracy.36 This method is used to determine the size and the refractive index of the trapped MgSO4 droplet when above the RH point below which the gel state is formed and when it can be assumed to be homogeneous in composition. This provides the reference point for the size and composition for all subsequent measurements. Then, the relative size change throughout the subsequent changes in RH can be estimated from the following equation, | (1) |
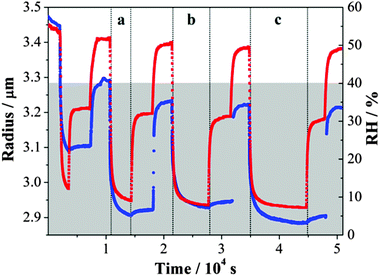
An example of the inferred radius over time is shown in Fig. 1. From a starting RH ≥ 50%, the droplet size decreased quickly with a reduction in RH down to ∼40% and then increased as the RH increased back to ∼52%. During this process, the response of size to the RH changes was fast. Only when the RH was decreased below the water activity at which gel formation occurs, equivalent to an RH of 40%,31 a significant slowing in the size change was observed, extending beyond the timescale of the actual change in RH. For any increase in RH up to a value below 40%, the evaporation of water from the droplet was not yet complete from the previous drying step. These observations are consistent with previous studies.31,36 The shaded area in Fig. 1 denotes the time during which the droplet was at a RH below the RH value required for gel formation; water transport is observed to be consistently impeded when conditions are within this regime. In this RH range, the droplet size responds only slowly to changes in RH and never appears to attain an equilibrium state.
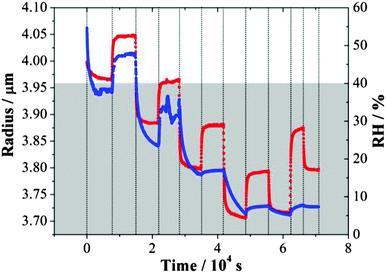 | ||
| Fig. 1 Evolving size (blue) of an MgSO4 droplet following the steps of RH (red). The grey area refers to the RH regime in which the droplet exists in a gel state. | ||
Although similar magnitudes of RH change were applied in evaporation and condensation when below the gel point RH, the apparent size changes inferred from the wavelength shifts of WGMs recorded during condensation steps were consistently less than those recorded during evaporation. This is consistent with the hysteresis in size observed on evaporation/condensation cycling in previous measurements with amorphous aerosol when water transport is kinetically hindered.16 On evaporation, the droplet does not achieve a water activity set by the lowest RH and so only a small increase in size is required to increase the water activity in the droplet to match the gas phase RH. It is interesting to see that considerable water is retained within the particle even at 29% RH, with a slow but substantial decrease in size on drying to 4% after 40![[thin space (1/6-em)]](https://www.rsc.org/images/entities/char_2009.gif) 000 s.
000 s.
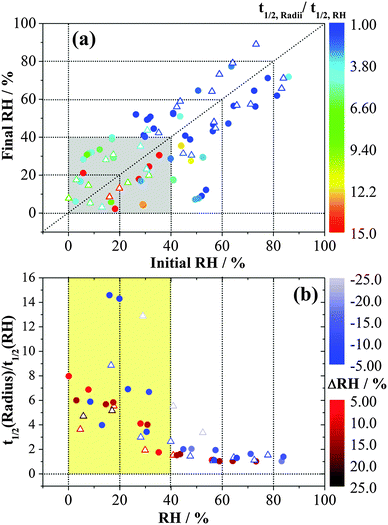
In order to explore the changes in water flux with RH, the ratios of half-time19 for changes in the droplet size to the half-time for the change in RH as measured by the probe are reported in Fig. 2. The trend is qualitatively consistent with the significant increase in equilibration times associated with selected RH changes in the EDB study of Davies et al.36 for larger MgSO4 droplets. In the high RH/dilute solute limit, the ratio approaches a value of 1, indicative of free transport of water into and out of the droplet. The ratio increases significantly when the droplet enters a gel state (the shaded area), exhibiting a slower response in size when compared to the response of the RH probe. A larger step in RH usually requires longer to reach the midpoint of the size change. For measurements of condensation and evaporation rates between pairs of common RH values in the gel state, for example, the transitions between RH pairs of ∼6% and ∼28% or between ∼5% and ∼17%, the half-time ratio was found to be smaller for condensation than for evaporation. This comparison also holds true for the half-time ratios obtained from FTIR-ATR (data in blue in Fig. 2). These two techniques show very similar time constants. A similar observation has been observed when comparing the evaporation and condensation kinetics of water in ultra-viscous and glassy aerosols: loss of water from a viscous particle is slower than the dissolution of a viscous core into a condensing lower viscosity shell.19
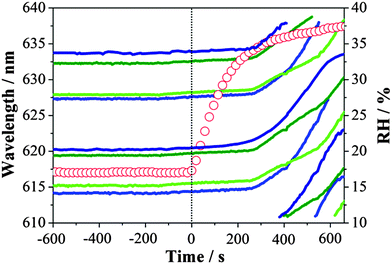
A typical example of the movement of WGMs is presented in Fig. 3 following the increase in RH from 17% to ∼40%, which is accompanied by rapid dissociation of the gel and the formation of a homogeneous solution droplet. Continuous deposition of water and dissociation of the gel structure only start to occur significantly once the RH had achieved a value of ∼36% where abrupt shifts of WGMs are observed. Asynchronous shifts in WGMs of different mode orders during the condensation process provide direct evidence for the presence of a concentration gradient during condensation with the water front gradually penetrating further into the particle as dissolution of the gel occurs. A similar observation was described by Bones et al.19 in the condensation of water on ultra-viscous sucrose particles. The sequential asynchronous translation of modes of increasing mode order is consistent with the advancing penetration of water through the mode volumes occupied by modes of increasing order and penetration depth.
In a previous publication, we used a differential step isothermal method31 to describe the kinetics of water transport between the gas phase and the bulk of a particle existing in a gel state, describing effectively the exchange of D2O by H2O in the MgSO4 droplet.32 A simplified expression for the initial region of the uptake curve may be obtained as,
 | (2) |
![[q with combining macron]](https://www.rsc.org/images/entities/i_char_0071_0304.gif) is the average water content in the droplet which depends on time, Dap is the apparent water diffusivity, and S/V is the ratio of external surface area to particle volume which is S/V = 3/Rp for a spherical particle of radius Rp. By assuming the density change of droplet is small from just below to above the gel state, eqn (2) can be written as
is the average water content in the droplet which depends on time, Dap is the apparent water diffusivity, and S/V is the ratio of external surface area to particle volume which is S/V = 3/Rp for a spherical particle of radius Rp. By assuming the density change of droplet is small from just below to above the gel state, eqn (2) can be written as | (3) |
![[r with combining macron]](https://www.rsc.org/images/entities/i_char_0072_0304.gif) , r0, and r∞ refer to the time-dependent radius, the initial radius prior to the RH step and the final radius of the RH change at equilibrium, respectively.
, r0, and r∞ refer to the time-dependent radius, the initial radius prior to the RH step and the final radius of the RH change at equilibrium, respectively.
An analysis of the fractional approach to the sorption equilibrium using eqn (3) is similar to the approach we have recently adopted to interpret the kinetics of water transport in glassy aerosol, using a response function to characterize the approach to a final state that can be fit to the stretched exponential function of the Kohlrausch–Williams–Watts equation.45 The dependence of the ratio of radii on t0.5/r0 can be used to estimate the apparent diffusion constant, Dap, for a specific RH change, as reported in Table 1. Unlike the mass transport retardation exhibited in ultra-viscous glasses, the supra-molecular network structure of gel-like MgSO4 tends to form many pores and channels which cause an apparent compositional independence of diffusivity and a time-dependence that is not consistent with the stretched exponential function of the Kohlrausch–Williams–Watts equation. Notably, a diffusion constant determined from a condensation event is considerably larger than the other values, a consequence of the rapid dissolution of the gel once the RH is increased above the gel point. Further challenges in comparing kinetics during condensation will be described in Section IIIC and a full discussion is delayed until then.
| Process | Initial RH | Final RH | Initial radii, R0/μm | Slope, ka/10−8 | D ap/10−16 m2 s−1 |
|---|---|---|---|---|---|
a
 . .
|
|||||
| Evaporation | 39.9 | 28.7 | 3.85 | 4.37 ± 0.39 | 1.67 ± 0.15 |
| 28.2 | 17.0 | 3.73 | 4.53 ± 0.38 | 1.80 ± 0.15 | |
| 16.6 | 5.8 | 3.73 | 4.71 ± 0.41 | 1.93 ± 0.17 | |
| Condensation | 29.9 | 40.2 | 3.84 | 8.57 ± 0.67 | 6.42 ± 0.50 |
| 17.7 | 29.1 | 3.73 | 4.29 ± 0.35 | 1.61 ± 0.13 | |
| 4.6 | 16.7 | 3.71 | 3.33 ± 0.29 | 0.97 ± 0.08 | |
The water diffusion constants of MgSO4 droplets of 3–4 μm radius reported in Table 1 are in the range of 10−16 to 10−15 m2 s−1. Li et al.33 estimated the diffusion constants to be from 10−15 to 10−14 m2 s−1 for water diffusing in the MgSO4 droplet with a radius of 10–30 μm, an order of magnitude larger. Given the differences in the measurement approach (particle size, levitated droplets compared with droplets on a substrate, inferred size change compared with isotope exchange), we consider this level of agreement to be acceptable. In the earlier work of Li et al.,33 compositional measurements were made by confocal Raman spectroscopy at different depths with the assumption that the relative magnitudes of Raman signatures from H2O and D2O provided a direct measure of the transport of water and the approach to equilibrium averaged over the entire droplet volume. The fractional approach to equilibrium for the whole particle required a correct identification of the end point of the water sorption to determine mt/m∞, with the Raman band intensities at a single point within the droplet providing a much more indefinite measure than the relative radius equilibration probed here. In addition, it may be that the drying of particles of considerably different sizes in the two types of experiment prepares gel-state magnesium sulphate droplets of different porosities. Despite these differences, the considerable slowing of kinetics of water transport in droplets adopting a gel state is clear and qualitatively consistent between the two studies.
B. Identification of different gel states on drying
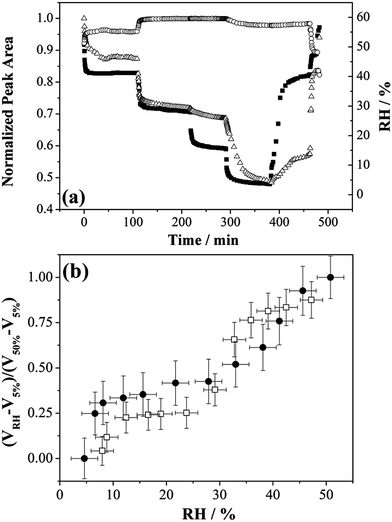
So far, we have considered that a single type of gel state is formed on drying below 40% RH. Here we explore the possible formation of different gel states through the dehumidifying and humidifying processes of MgSO4 droplets from investigations using FTIR-ATR and adsorption isotherm measurements. In FTIR-ATR measurements, step-wise RH changes were performed and the mass transfer at very low RHs was examined. Fig. 4(a) reports the normalized peak areas of the water OH-stretching envelope and the ν3 band of SO42− stretching of MgSO4 droplets responding to RH changes. Changes in the ν3-SO42− peak area with respect to the variation in RH can be attributed to the morphological changes of a spherical droplet deposited on a ZnSe substrate, affecting the penetration depth of the incoming beam and the sample volume and the concentration of the salt. It can be clearly seen from the changes in the OH-stretching peak area, the water loss was greatly impeded as the RH was reduced from 28% to 15%. Nevertheless, the peak area of water OH-stretching was found to drastically decrease during the subsequent reduction of RH from 15% to 3.5%. Similarly, the re-growth of droplet sizes was far slower than the increase in the rate of surrounding RH during the humidifying process. The retardation ended when the RH value reached 40% in which the break-down of gel induced a significant uptake of water.These findings are in agreement with the observations obtained from optical tweezers, with, for example, the magnitudes of size changes not showing a monotonic variation with the values between which the RH changes. The normalized volume of condensed phase water upon evaporation is investigated by comparing the fractional droplet volume change obtained from optical tweezers with the fractional OH peak area obtained from FTIR-ATR, shown in Fig. 4(b). The respective value at RH ∼50% for each measuring technique is adopted as the maximum point. The qualitative changes in the size/water content are similar for both techniques.
The sorption behaviour of water in anhydrous MgSO4 within the RH region ranging from ultra-low, i.e., RH > 1%, to RH ≤ 30% is of interest and the adsorption isotherm has been measured using the physical adsorption analyser. Fig. 5 shows the water adsorption isotherm of water for the MgSO4 sample at 298 K. Briefly, MgSO4 exhibits a multi-layer adsorption type curve at low RH. Normally, a three-parameter BET equation as described by Joyner et al.46 can be used for water adsorption isotherm fitting instead of the conventional BET treatment. However, this treatment is not possible for the water adsorption by MgSO4 due to the abrupt transition at ∼32% RH and ∼80% RH, the latter being the deliquescence RH of the aerosol. If the region below a RH of 35% is examined carefully, different degrees of water adsorption can be found as shown in the inset of Fig. 5 with a qualitative trend and steps in water sorption that are consistent with both the optical tweezers and FTIR-ATR measurements. The WSR increases from 0.5 to 2.4 accompanying the RH increase from ∼9.2% to ∼30%. We suggest the transition of MgSO4·nH2O particles from anhydrous particles at low RH to a mono-hydrate (n = 1) at 10% RH and to n ≤ 2.5 at 30% RH. This is followed by an abrupt increase of water uptake as the RH increases from 32 ± 2.5% to 35 ± 2.5%, which can be attributed to the transition of MgSO4·2.5H2O particles to MgSO4·5H2O. The relatively stable plateau observed with an increase in RH from ∼45% to ∼80% corresponds to the occurrence of stable hexahydrates of magnesium sulphate. Finally, the hexahydrates experience deliquescence at 80% RH. These measurements confirm that although a gel is formed and water dehydration and hydration occur continuously with the reduction and increase in RH, transitions between different thermodynamically stable gel states occur.
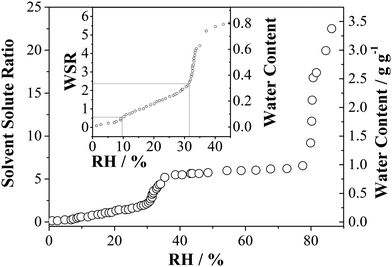 | ||
| Fig. 5 Water adsorption isotherm of MgSO4 particles at 298 K. The sample mass was 824 μg. The inset shows the enlarged view of water content at the low RH region. | ||
In a previous publication,31 the structure of the MgSO4 gel was proposed to be polymeric chains based on bidentate contact ion pairs, wherein hexahedral Mg2+ coordinates with two H2O molecules and four O atoms of two [SO4]2− group.32 Indeed, the water content plays an important role in regulating the structures of hydrates. The number of H2O molecules alters the topological arrangements of polyhedra, leading to the formation of different crystal structures for different hydrated Mg-sulphates. The X-ray diffraction patterns of MgSO4 with different hydration levels have been reported previously.47,48 As the number of water molecules that coordinate with octahedral Mg2+ increase, fewer O from SO42− can form linkages with Mg2+. The increase in the molar fraction of water molecules also reduces the bridging of polyhedra. As a result, the structures of MgSO4·nH2O vary from a three-dimensional infinite framework (n = 1–2), through finite clusters (n = 4) and infinite chains (n = 5), to isolated octahedral Mg2+ and tetrahedral SO42− when in solution. The structure of MgSO4·nH2O with n = 2.5 was also verified46 as consisting of two-dimensional layers. The double-sheet slabs composed of octahedral Mg2+ and tetrahedral SO42− are held together by hydrogen bonds and the atoms within the slabs are bonded by strong chemical interactions with the absence of H2O molecules. The structure implies that two-dimensional layers are water insensitive.
Combining the observations from hygroscopic study and reports from the crystallographic refinement, it is logical to suggest that more complicated ion-pairing structures of MgSO4 droplets could exist at very low relative humidity instead of polymeric chains. Since the X-ray observations confirmed that phase transitions are important for MgSO4 of hydration levels n = 1 to 6,48 the gel structure composed of ion-pairing in an MgSO4 droplet upon the evaporation process would undergo a phase transition from a cluster, through 2D layers which are less sensitive to relative humidity, to a 3D framework which possesses channels and pores. This explains why water transport was still observed for MgSO4 droplets in response to the humidity changes at very low RH region.
In summary, by using three techniques, that is, aerosol optical tweezers and FTIR-ATR spectroscopy as well as water adsorption isotherm, we can draw the conclusion that, gel formation in MgSO4 aerosol droplets limits the kinetics of water evaporation and condensation. Marginally different concentrations of water at the same RH are obtained by the three techniques, while results of FTIR and tweezers system are broadly consistent regarding the amount of water lost and the rate at which it is lost.
C. Influence of the duration of drying
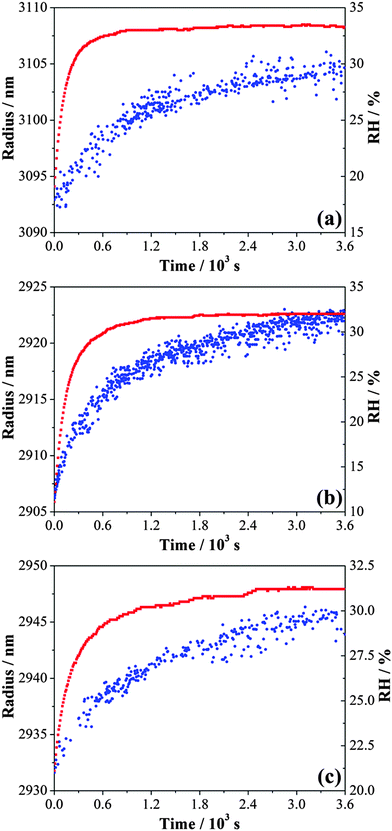
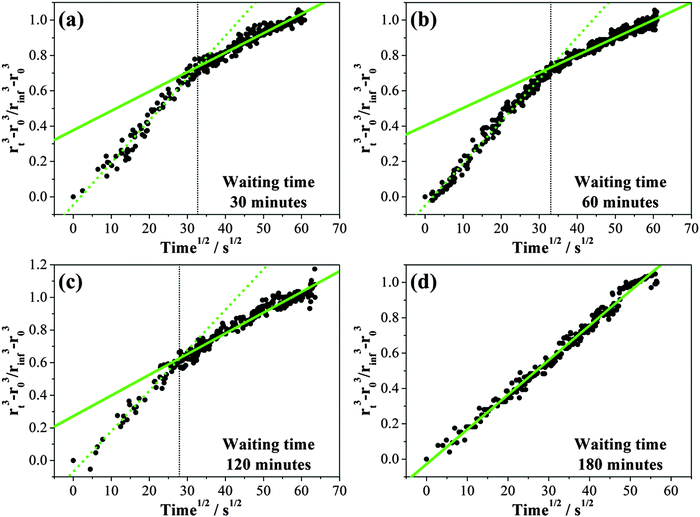
In a final experiment using optical tweezers, the size of an MgSO4 droplet was allowed to decrease following a rapid RH reduction from ≤52% to ≤9%. Then, two consecutive humidifying steps were carried out from the lowest RH to a RH of 30–33% and from 30–33% RH to a RH of ∼50%. These condensation and evaporation cycles were repeated. The time over which the droplet was held at the lowest RH of each cycle was varied from 0.5 to 3 hours and is referred to as the waiting time,49 or equivalently the drying time, as shown in Fig. 6. The size decrease of the droplet within period (a) in Fig. 6 was smaller than the later cycles due to a shorter drying time and an incomplete loss of water from the droplet during the much shorter wait time. The size evolution was inferred from tracking the very slow movement of first-order WGMs with increasing waiting time followed by humidification within the gel state (up to ∼30% RH). The increase to an RH above the gel point was necessary in every cycle to return the droplet to a true equilibrium state of homogeneous composition and dissolution of the gel before the next drying cycle and a wait time measurement was performed.Time dependent growth in the droplet size following the increase in RH following different waiting/drying times is compared in Fig. 7. About 16–19 nm of radius change with a maximum uncertainty of ±2 nm can be detected for an increase in RH from 8% to 33%. Using the differential step isothermal method introduced above, normalized volume changes are illustrated in Fig. 8 with variation in the square root of time. Notably, the time-dependence of the fractional volume change shows a systematic change in shape as the waiting (drying) time prior to condensation is increased from 30 min to 180 minutes with the condensation process split into two distinct steps. Diffusion constants estimated from the linear fits to the two gradients for each wait time are reported in Table 2. While the diffusion constants estimated from the data for time periods greater than 900 s are consistent, a marginally larger diffusion constant can be determined from the data recorded during the early stages in condensation, decreasing towards the value of the long-time data. When the wait time is 180 minutes, only a single diffusion constant can be determined (Fig. 8(d)). Although we have suggested in Section IIIA that the diffusion constant of water appears to be independent of RH once the gel is formed, particularly when compared to the variations over many orders of magnitude that occur in glassy and ultraviscous aerosol,16 these data suggest that there is a marginal dependence on the amount of water remaining in the gel and the degree to which the gel is swollen as a result.
| Waiting time/min | Equilibrium radii, R0/μm | RH/% | Slope, k/10−8 | D ap/10−16 m2 s−1 |
|---|---|---|---|---|
| 30 | 3.09 | 14.2 | 7.54 ± 0.49 | 3.36 ± 0.22 |
| 3.46 ± 0.22 | 1.46 ± 0.10 | |||
| 60 | 2.91 | 12.2 | 7.38 ± 0.48 | 3.08 ± 0.20 |
| 3.08 ± 0.20 | 1.29 ± 0.08 | |||
| 120 | 2.93 | 8.2 | 7.27 ± 0.43 | 2.78 ± 0.17 |
| 3.71 ± 0.22 | 1.42 ± 0.09 | |||
| 180 | 2.95 | 10.7 | 4.04 ± 0.23 | 1.42 ± 0.08 |
IV. Conclusion
In this study we have examined the evaporation and condensation kinetics of water from a single MgSO4 droplet using gradient force optical tweezers-Raman spectroscopy. The observations were supported by studies by FTIR-ATR and measurements of the water adsorption isotherm obtained from a physisorption analyser. We have focused on the limited water transport during dehydration and hydration of droplets that can be used to identify the formation of a gel.We report very slow mass transport in MgSO4 droplets once the RH is decreased from RH ∼40%. The dynamics of the overall evaporation and condensation steps of droplets with respect to various RH changes are presented as a half-time ratio and the results are qualitatively in line with previous studies using different observation techniques. The break-down/dissolution of the gel is reported to occur when the RH is increased above ∼36%. Water diffusion constants below the RH of gel formation are reported to be of the order 10−16 m2 s−1, indicating severe water transport retardation, but significantly less than that observed in glassy aerosol. Notably, the estimated diffusion constants appear to be independent of RH (equivalent to the water activity in the droplet), a behaviour that should be contrasted with the strong dependence on composition/water activity observed in ultra-viscous and glassy sucrose particles.50 This is consistent with the facile transport of water occurring along common pores in the structure independent of droplet composition.
Continuous water loss been observed on reduction in RH from ∼29% to ∼4% infers that certain phase transformation occurred in the former RH range. We have validated our observations by optical tweezers with complementary FTIR-ATR and water adsorption isotherm measurements. A similar trend of water content change is reported for a RH region lower than RH ∼ 40%. Referring to the reported phase transitions of magnesium hydrates with different water contents examined by X-ray diffraction,47,48 we suggest that the gel structure of MgSO4 droplets at very low RH consists of a three dimensional framework that is comprised of contact ion-pairs instead of simple polymeric chains.
Finally, we report the influence of the waiting (drying) time at low RH (≤10%) on the kinetics of the subsequent humidifying process, staying below the RH at which dissolution of the gel would occur. With short drying times, the condensation kinetics can be described by bulk limited uptake that requires two distinct diffusion constants that differ by a factor of ∼2. As more water is removed from the droplet during drying (i.e. at longer waiting times), the condensation kinetics are increasingly consistent with a single diffusion constant. This change must reflect the inhomogenieties in composition that result during partial drying.
Acknowledgements
CC and SHT contributed equally to this work and should be considered co-first authors. YHZ acknowledges support from the NSFC (41175119, 21373026 and 21473009) and 111 project (B07012) and 2011YQ04013615. SHT acknowledges the China Scholarship Council for granting a PhD scholarship. CC acknowledges support from the China Scholarship Council for an international joint project. JPR acknowledges the NERC through the award NE/M004600/1.References
- J. Curtius, C. R. Phys., 2006, 7, 1027–1045 CrossRef CAS PubMed.
- A. Nel, Science, 2005, 309, 1326 CAS.
- P. Stier, J. H. Seinfeld, S. Kinne and O. Boucher, Atmos. Chem. Phys., 2007, 7, 5237–5261 CAS.
- S. Satheesh and K. Krishnamoorthy, Atmos. Environ., 2005, 39, 2089–2110 CrossRef CAS PubMed.
- J. Haywood and O. Boucher, Rev. Geophys., 2000, 38, 513–543 CrossRef CAS.
- U. Lohmann and J. Feichter, Atmos. Chem. Phys., 2005, 5, 715–737 CrossRef CAS.
- C. E. Kolb, R. A. Cox, J. P. D. Abbatt, M. Ammann, E. J. Davis, D. J. Donaldson, B. C. Garrett, C. George, P. T. Griffiths, D. R. Hanson, M. Kulmala, G. McFiggans, U. Pöschl, I. Riipinen, M. J. Rossi, Y. Rudich, P. E. Wagner, P. M. Winkler, D. R. Worsnop and C. D. O'Dowd, Atmos. Chem. Phys., 2010, 10, 10561–10605 CrossRef CAS.
- J. H. Seinfeld and S. N. Pandis, Atmospheric chemistry and physics: from air pollution to climate change, John Wiley & Sons, 2006 Search PubMed.
- U. K. Krieger, C. Marcolli and J. P. Reid, Chem. Soc. Rev., 2012, 41, 6631–6662 RSC.
- E. Mikhailov, S. Vlasenko, S. T. Martin, T. Koop and U. Poeschl, Atmos. Chem. Phys., 2009, 9, 9491–9522 CrossRef CAS.
- A. Virtanen, J. Joutsensaari, T. Koop, J. Kannosto, P. Yli-Pirilä, J. Leskinen, J. M. Mäkelä, J. K. Holopainen, U. Pöschl, M. Kulmala, D. R. Worsnop and A. Laaksonen, Nature, 2010, 467, 824–827 CrossRef CAS PubMed.
- B. Zobrist, C. Marcolli, D. A. Pedernera and T. Koop, Atmos. Chem. Phys., 2008, 8, 5221–5244 CrossRef CAS.
- B. J. Murray, A. E. Haddrell, S. Peppe, J. F. Davies, J. P. Reid, D. O'Sullivan, H. C. Price, R. Kumar, R. W. Saunders, J. M. C. Plane, N. S. Umo and T. W. Wilson, Atmos. Chem. Phys., 2012, 12, 8575–8587 CAS.
- M. Mitterböck, G. Fleissner, A. Hallbrucker and E. Mayer, J. Phys. Chem. B, 1999, 103, 8016–8025 CrossRef.
- C. K. Chan, R. C. Flagan and J. H. Seinfeld, J. Am. Ceram. Soc., 1998, 81, 646–648 CrossRef CAS PubMed.
- B. Zobrist, V. Soonsin, B. P. Luo, U. K. Krieger, C. Marcolli, T. Peter and T. Koop, Phys. Chem. Chem. Phys., 2011, 13, 3514–3526 RSC.
- H. J. Tong, J. P. Reid, D. L. Bones, B. P. Luo and U. K. Krieger, Atmos. Chem. Phys., 2011, 11, 4739–4754 CrossRef CAS.
- V. Lubchenko and P. G. Wolynes, Annu. Rev. Phys. Chem., 2007, 235–266 CrossRef CAS PubMed.
- D. L. Bones, J. P. Reid, D. M. Lienhard and U. K. Krieger, Proc. Natl. Acad. Sci. U. S. A., 2012, 109, 11613–11618 CrossRef CAS PubMed.
- H. C. Price, J. Mattsson, Y. Zhang, A. K. Bertram, J. F. Davies, J. W. Grayson, S. T. Martin, D. O'Sullivan, J. P. Reid, A. M. J. Rickards and B. J. Murray, Chem. Sci., 2015, 6, 4876–4883 RSC.
- R. M. Power, S. H. Simpson, J. P. Reid and A. J. Hudson, Chem. Sci., 2013, 4, 2597 RSC.
- S. Sjogren, M. Gysel, E. Weingartner, U. Baltensperger, M. J. Cubison, H. Coe, A. A. Zardini, C. Marcolli, U. K. Krieger and T. Peter, J. Aerosol Sci., 2007, 38, 157–171 CrossRef CAS PubMed.
- A. A. Zardini, S. Sjogren, C. Marcolli, U. K. Krieger, M. Gysel, E. Weingartner, U. Baltensperger and T. Peter, Atmos. Chem. Phys., 2008, 8, 5589–5601 CrossRef CAS.
- I. A. Farhat, E. Loisel, P. Saez, W. Derbyshire and J. Blanshard, Int. J. Food Sci. Technol., 1997, 32, 377–387 CAS.
- D. J. Abdallah and R. G. Weiss, J. Braz. Chem. Soc., 2000, 11, 209–218 CrossRef CAS.
- L. A. Estroff and A. D. Hamilton, Chem. Rev., 2004, 104, 1201–1218 CrossRef CAS PubMed.
- G. He, R. B. H. Tan, P. J. A. Kenis and C. F. Zukoski, J. Phys. Chem. B, 2007, 111, 14121–14129 CrossRef CAS PubMed.
- R. J. Charlson, D. S. Covert, T. V. Larson and A. P. Waggoner, Atmos. Environ., 1978, 12, 39–53 CrossRef CAS.
- I. N. Tang, A. C. Tridico and K. H. Fung, J. Geophys. Res.: Atmos., 1997, 102, 23269–23275 CrossRef CAS.
- Y. Zhang and C. K. Chan, J. Phys. Chem. A, 2000, 104, 9191–9196 CrossRef CAS.
- F. Wang, Y. Zhang, S. Li, L. Wang and L. Zhao, Anal. Chem., 2005, 77, 7148–7155 CrossRef CAS PubMed.
- L. Wang, F. Ding, Y. Zhang, L. Zhao and Y. Hu, Spectrochim. Acta, Part A, 2008, 71, 682–687 CrossRef PubMed.
- K. Li, F. Wang, G. Zeng, J. P. Reid and Y. Zhang, J. Phys. Chem. B, 2011, 115, 14397–14403 CrossRef CAS PubMed.
- J. P. Bibring, Y. Langevin, A. Gendrin, B. Gondet, F. Poulet, M. Berthe, A. Soufflot, R. Arvidson, N. Mangold, J. Mustard and P. Drossart, Science, 2005, 307, 1576–1581 CrossRef CAS PubMed.
- R. Buchner, T. Chen and G. Hefter, J. Phys. Chem. B, 2004, 108, 2365–2375 CrossRef CAS.
- J. F. Davies, A. E. Haddrell, R. E. H. Miles, C. R. Bull and J. P. Reid, J. Phys. Chem. A, 2012, 116, 10987–10998 CrossRef CAS PubMed.
- R. E. Miles, J. S. Walker, D. R. Burnham and J. P. Reid, Phys. Chem. Chem. Phys., 2012, 14, 3037–3047 RSC.
- L. Mitchem and J. P. Reid, Chem. Soc. Rev., 2008, 37, 756 RSC.
- G. W. Scherer, J. Non-Cryst. Solids, 1992, 147, 363–374 CrossRef.
- J. B. Wills, K. J. Knox and J. P. Reid, Chem. Phys. Lett., 2009, 481, 153–165 CrossRef CAS PubMed.
- R. E. H. Miles, A. E. Carruthers and J. P. Reid, Laser Photonics Rev., 2011, 5, 534–552 CrossRef CAS PubMed.
- R. D. Dear, D. R. Burnham, M. D. Summers, D. McGloin and G. A. Ritchie, Phys. Chem. Chem. Phys., 2012, 14, 15826–15831 RSC.
- Q. Ma, Y. Liu and H. He, J. Phys. Chem. A, 2010, 114, 4232–4237 CrossRef CAS PubMed.
- BEL Japan, Inc. BELSORP-max user's manual.
- A. M. Rickards, Y. C. Song, R. E. Miles, T. C. Preston and J. P. Reid, Phys. Chem. Chem. Phys., 2015, 17, 10059–10073 RSC.
- L. G. Joyner, E. B. Weinburger and C. W. Montgomery, J. Am. Chem. Soc., 1945, 67, 2182–2188 CrossRef CAS.
- H. Ma, D. L. Bish, H. W. Wang and S. J. Chipera, Am. Mineral., 2009, 94, 622–625 CrossRef CAS.
- H. Ma, D. L. Bish, H. Wang and S. J. Chipera, Am. Mineral., 2009, 94, 1071–1074 CrossRef CAS.
- J. W. Lu, A. M. Rickards, J. S. Walker, K. J. Knox, R. E. Miles, J. P. Reid and R. Signorell, Phys. Chem. Chem. Phys., 2014, 16, 9819–9830 RSC.
- D. M. Lienhard, A. J. Huisman, D. L. Bones, Y. F. Te, B. P. Luo, U. K. Krieger and J. P. Reid, Phys. Chem. Chem. Phys., 2014, 16, 16677–16683 RSC.
Footnote |
| † Electronic supplementary information (ESI) available. See DOI: 10.1039/c5cp05181a |
| This journal is © the Owner Societies 2015 |

