
 Open Access Article
 This Open Access Article is licensed under a
 Creative Commons Attribution 3.0 Unported Licence
Hydrogen bonding and molecular orientation at the liquid–vapour interface of water
Flaviu S.
Cipcigan
*a,
Vlad P.
Sokhan
b,
Andrew P.
Jones
ab,
Jason
Crain
ab and
Glenn J.
Martyna
ac
aSchool of Physics and Astronomy, University of Edinburgh, Mayfield Road, Edinburgh EH9 3JZ, UK. E-mail: flaviu.cipcigan@ed.ac.uk
bNational Physical Laboratory, Hampton Road, Teddington, Middlesex TW11 0LW, UK
cIBM T. J. Watson Research Center, Yorktown Heights, New York 10598, USA
First published on 17th February 2015
Abstract
We determine the molecular structure and orientation at the liquid–vapour interface of water using an electronically coarse grained model constructed to include all long-range electronic responses within Gaussian statistics. The model, fit to the properties of the isolated monomer and dimer, is sufficiently responsive to generate the temperature dependence of the surface tension from ambient conditions to the critical point. Acceptor hydrogen bonds are shown to be preferentially truncated at the free surface under ambient conditions and a related asymmetry in hydrogen bonding preference is identified in bulk water. We speculate that this bonding asymmetry in bulk water is the microscopic origin of the observed surface structure.
1 Introduction
The liquid–vapour interface in water is among the most common and important of all heterogeneous environments. In addition to being of fundamental interest, there is speculation that it may also serve as a minimal model system for other complex surfaces such as those occurring in hydrophobic hydration of biological systems.1,2 Surface-selective measurements,3–9 free from the effects of contaminant adsorbates and surfactants, are particularly challenging and there remain controversies regarding the structure of the free surface and the molecular nature of signature features arising from the abrupt truncation of the bulk's extended hydrogen-bond network.10 In particular, consensus has not been reached regarding the orientational bias of surface water molecules, with competing models exhibiting various dangling hydrogen-bond arrangements.11–13Simulations have been used to understand the surface structure in more detail.14 However, the inhomogeneous nature of the interface and the key role of many-body interactions that break the symmetry at interfaces (such as polarization and dispersion), present challenges to conventional empirical models.15 Consequently, classical point charge models tuned via a mean-field approach to reproduce bulk properties, show poor transferability to environments with different symmetry such as surfaces. For example, only the extensively parametrised TIP4P/2005† reproduces the surface tension of the liquid–vapour interface to within 2% of experiment (cf. Kuo et al.14,16 Vega and de Miguel16 and the references therein).
On the other hand, ab initio simulations are limited by timescale and system size scaling (and hence the level of theory that is tractable). Two ab initio studies of the free interface have been performed, at the level of gradient corrected functionals (BLYP12 and BLYP-D13), producing contradictory conclusions regarding the surface structure. BLYP is known to overstructure17 bulk water with BLYP-D decreasing but not eliminating this tendency.18
Recently, an electronically coarse grained model for water (QDO-water) has been reported, which includes all long-range electronic responses (many body polarization and dispersion within Gaussian statistics).19 Within the QDO framework, only monomer properties are used as empirical parameters, supplemented by a simple form for short range repulsion between dimers, allowing the physics of aggregates to emerge naturally from the low density limit. Thus, the resulting physical properties of the liquid emerge as predictions based on only molecular data as a fitting target. We have already shown that QDO-water quantitatively generates both the liquid and gas phase properties along their coexistence curve and the lattice parameters of an ice polymorph (ice II).20 This paper directs its focus to the simplest inhomogeneous system: the liquid–vapour interface.
The first section outlines the construction of QDO-water (described in detail in Jones et al.19,21) and details the methods used. The next section presents the resulting surface tension, molecular dipole moment, hydrogen bonding criteria used22 and the resulting interior and surface populations. The final section discusses the surface orientation and its link to hydrogen bonding.
2 Simulation details and validation
2.1 The QDO water model
The QDO water model is built upon the molecular frame of the TIP4P model, shown in Fig. 1. The fixed, gas phase, charge distribution of the water molecule is reproduced by 3 charges, δ+ = 0.605![[thin space (1/6-em)]](https://www.rsc.org/images/entities/char_2009.gif) e on each hydrogen atom and 2δ− on a site labelled M down the H–O–H bisector. The charges and M site position are selected to reproduce water's gas phase dipole moment and provide a best fit to the quadrupole moment.
e on each hydrogen atom and 2δ− on a site labelled M down the H–O–H bisector. The charges and M site position are selected to reproduce water's gas phase dipole moment and provide a best fit to the quadrupole moment.
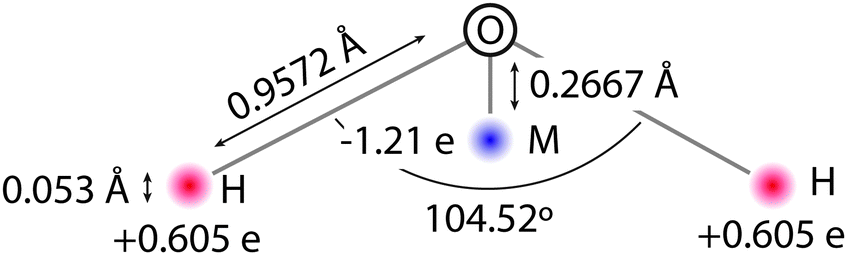 | ||
| Fig. 1 The frame of QDO water. | ||
In order to account for electronic responses of a water molecule in a coarse grained manner, a Quantum Drude Oscillator (QDO) is placed on the M site. Specifically, the M site gains a positively charged centre of oscillation, balanced by a negatively charged light particle (drudon), harmonically bound to this centre. The 3 parameters of the QDO, mass, charge and frequency (m = 0.3656 me, q = 1.1973e, ω = 0.6287 ωH)‡ are selected to generate the correct dipole polarisation, quadrupole polarisation and C6 dispersion coefficient.23 All charges are Gaussian, resulting in a natural damping of the Coulomb interaction, with a width of 0.1 Å, except for the centre charge of the QDO, which has a width of 1.2 Å. The repulsion between two molecules separated by a distance ROO is given by an oxygen–oxygen double exponential pairwise repulsive potential of the form k1e−λ1ROO + k2e−λ2ROO (k1 = 613.3 Ha, k2 = 10.5693 Ha, λ1 = 2.32441/a0 and λ2 = 1.51451/a0, where a0 is the Bohr radius).
The molecule is treated as a classical rigid body while the QDO is treated fully quantum mechanically via a non-perturbative path integral approach described in detail in Jones et al.21,23 The coarse grained electronic structure is treated using 96 path integral beads. A Gaussian charge of width 0.1 Å describes the light negatively charged drudon in the classical limit. The nuclear and electronic degrees of freedom are thermostated separately via a 2-step Nosé–Hoover chain thermostat24 and the dynamics integrated with a time step of 0.075 fs.
2.2 Simulation details
The molecular behaviour of the liquid–vapour interface was investigated via simulations of 576 QDO-water molecules in the lamella geometry at 300 K in the isochoric–isothermal ensemble using a fully periodic unit cell of dimensions 23.36 × 23.36 × 93 Å3. The unit cell was seeded with a liquid centre of experimental density (997 kg m−3) and left to equilibrate, forming two liquid–vapour interfaces. The resulting 255 ps trajectories were then analysed to calculate the mean field density as a function of z position, measured relative to the centre of mass of the lamella (Fig. 2).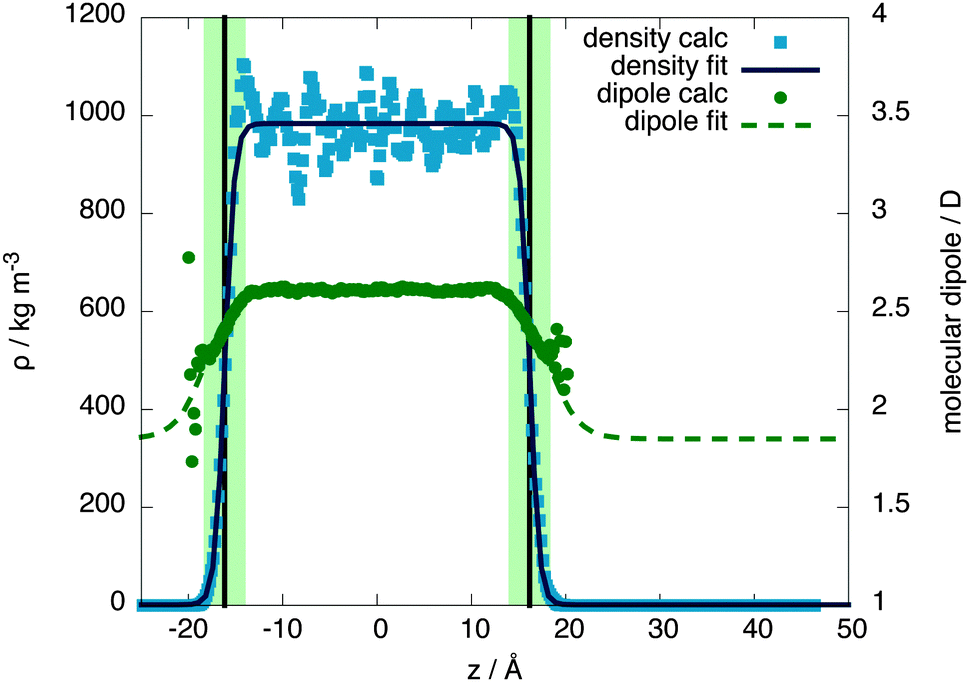 | ||
| Fig. 2 The density and molecular dipole moment as a function of position in the unit cell. The dots are calculated values and the lines are fits to a hyperbolic tangent function. The surface region is denoted by the light coloured band, centred around the black vertical line marking the Gibbs dividing surface. | ||
Fitting the resulting density profile to a hyperbolic tangent function
 | (1) |
The Gibbs dividing plane lies at zg = 16.2 Å, giving an interfacial decay length of δ = 1.01 Å. Following the usual convention, the mean field interfacial region lies between 90% and 10% liquid density and the interior region lies above 90% liquid density. With these definitions, the interfacial width is 2.22 Å, or about one molecule thick. The interior region is approximately 2(zg − δ) = 30.2 Å thick.
To check whether the interior region is indeed a bulk liquid, Fig. 3 shows a comparison of the oxygen–oxygen radial distribution functions (RDFs) between the interior region, equivalent bulk liquid simulations at coexistence pressure and experiment.26 The interior region is slightly overstructured with respect to both the constant temperature simulations and experimental data, consistent with a lower density. Similar simulations using 4000 molecules give an interior region with a local structure and density (ρL = (987 ± 2) kg m−3) closer to that of a bulk liquid (Fig. 4), showing that a stable bulk liquid is only formed at around a distance of 25 Å from the surface.
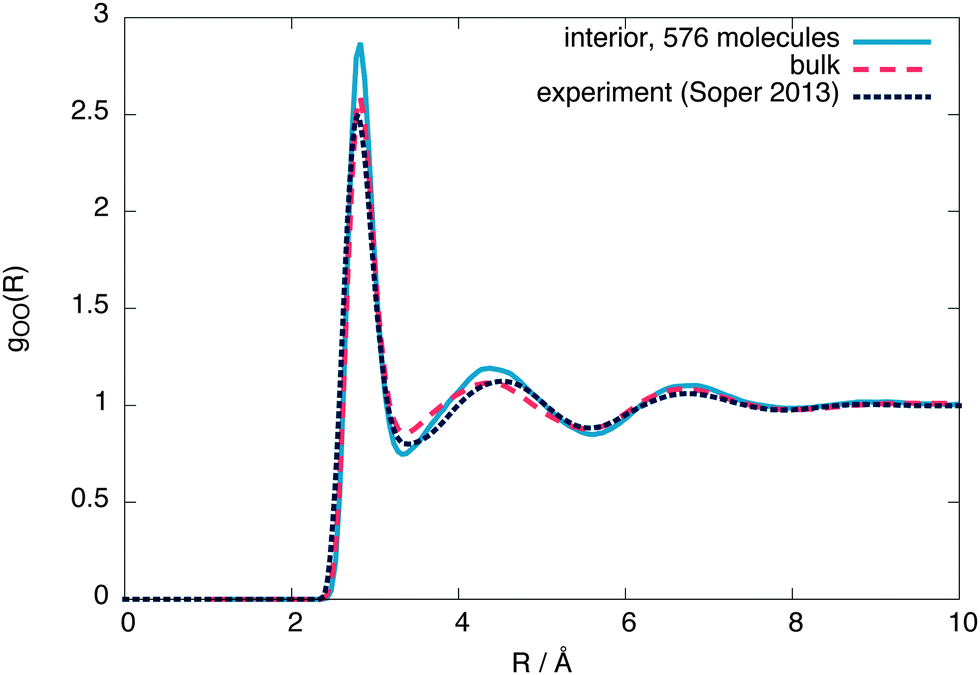 | ||
| Fig. 3 The interior, bulk and experimental26 oxygen–oxygen radial distribution functions for 576 molecules. | ||
 | ||
| Fig. 4 The interior, bulk and experimental26 oxygen–oxygen radial distribution functions for 4000 molecules. | ||
3 Results and discussion
3.1 Interfacial molecular dipole moment
Since QDO-water is an electronically responsive model, the molecular dipole moment will vary throughout the cell, depending on the local molecular configuration. Fig. 2 shows the magnitude of the molecular dipole moment superimposed over the density. Fitting its value to a similar functional form to the density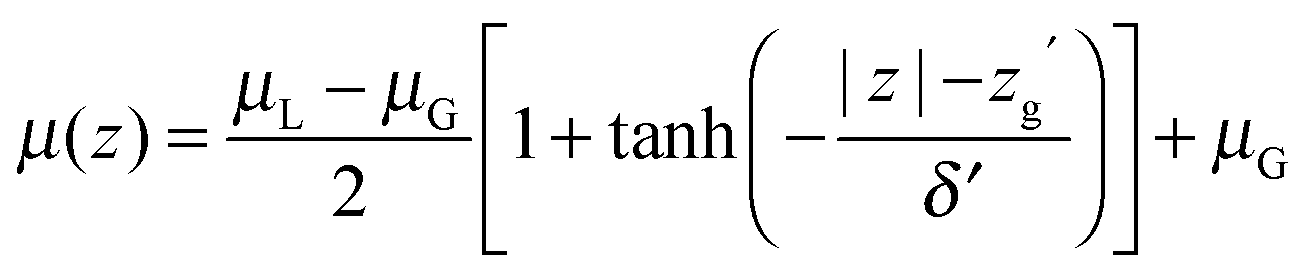 | (2) |
The z coordinate where the dipole moment has decayed to half the difference between liquid and vapour lies at zg′ = 18.3 Å, a coordinate where the density has decayed to 1.6% the bulk liquid's density. The dipole's decay length is also larger than that of the density's, with δ′ = 3.06 Å. Furthermore, over the surface region the dipole moment's magnitude varies between 2.34 and 2.52 D, with an average value of 2.44 D (94% of the interior value of 2.6 D). Therefore, as a consequence of this slow decay of the dipole moment into the vapour, the surface molecules are electrostatically similar to those in the bulk, in line with the surface's large cohesive energy.
3.2 Surface tension and critical temperature
The surface tension is calculated at 300 K using γ = Lz(pn − pt)/2, where Lz is the z extent of the unit cell and pn, pt are the normal and tangential components of the pressure tensor, respectively, obtaining a value of 70.3 mN m−1 (within 1% of the experimental value of 71.7 mN m−1).25 From equivalent simulations at temperatures ranging from 300 to 620 K, the temperature dependence of the surface tension is calculated, showing good agreement with experiment, as presented in Fig. 5. Linearly extrapolating the surface tension to 0 mN m−1 gives an estimate of the critical temperature of 656(6) K, 1.5 standard errors away from the experimental value of 647.096(10) K30 and 1 standard error away from the independent estimate of Sokhan et al.20 based on the coexistence density of QDO-water of 649(2) K.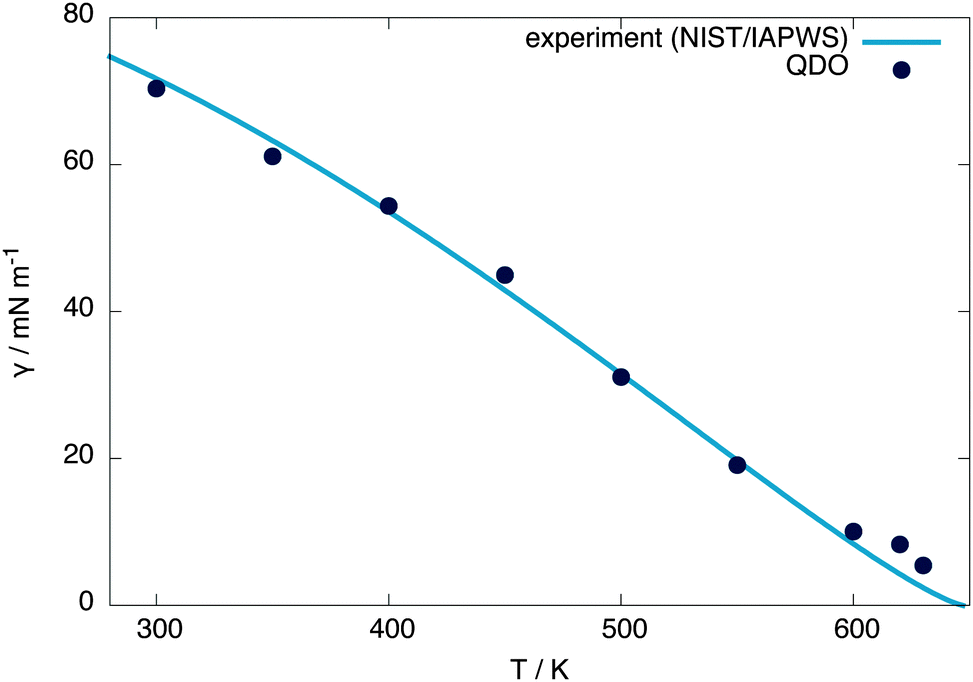 | ||
| Fig. 5 Surface tension of QDO water as a function of temperature compared with NIST/IAPWS experimental data.25 Linearly extrapolating the surface tension to 0 mN m−1 gives a critical temperature of 656(6) K. This critical temperature does not change by more than one error bar if the points above 600 K are removed from the extrapolation. | ||
3.3 Surface structure
To reveal the surface structure, the interior and surface oxygen–oxygen radial distribution functions (RDFs) are compared in Fig. 6. From this comparison, we conclude that the free surface is expanded relative to the interior liquid.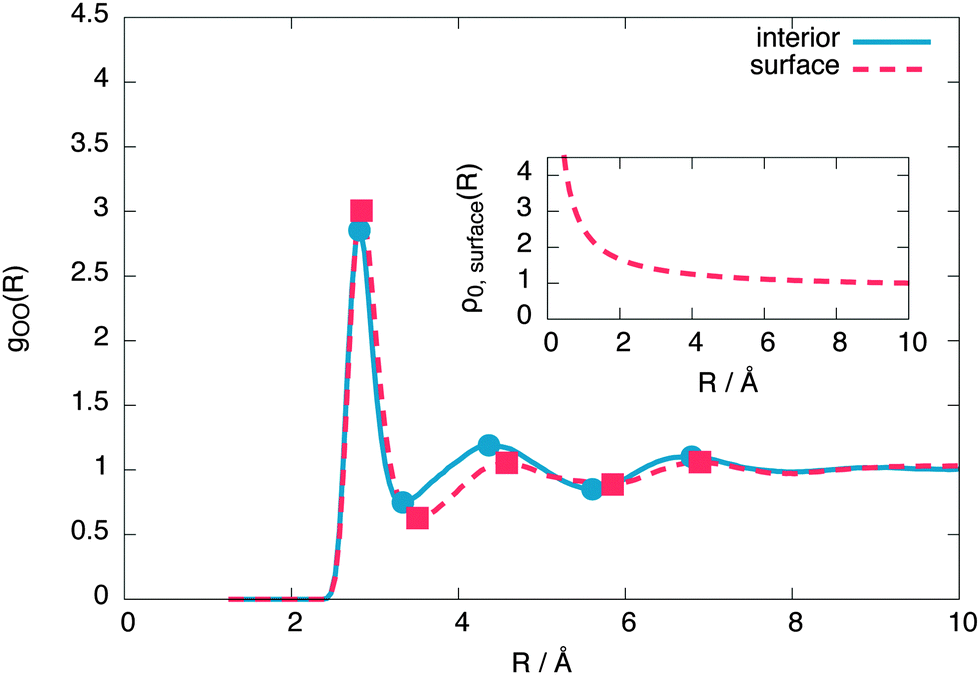 | ||
| Fig. 6 The surface and interior oxygen–oxygen radial distribution functions of the 576 molecule layer, showing a surface expansion of the nearest neighbour oxygen–oxygen distance at the surface. The inset shows the radius-dependent normalisation applied to the surface radial distribution function, as described by eqn (4). | ||
To make the expansion quantitative, we numerically calculated the second derivative of both RDFs using a smooth noise robust differentiator31 and calculated its R intercepts to give the extrema. These extrema show the first shell expanding by 0.9% at the surface while the second shell expanding by 4.9%. The average distance between instantaneous nearest neighbours also increases at the surface by around 1.3%. This is in qualitative agreement with recent XAS experiments, which predict a surface expansion of 6%32 and ab initio simulations, predicting a more modest surface expansion of 1%,13 but in contrast with point charge models, which predict a surface contraction.14
The radius dependent normalisation of the surface radial distribution function is an artefact of the calculation method. To understand this artefact, consider an infinitely sharp interface between an uniform fluid of density ρ0 and a gas of density ∼ 0 (Fig. 8).
If d ≫ r, all of a spherical shell of radius r and width dr contains fluid. However, when d ∼ r, the amount of fluid enclosed in the sphere will depend on r. To calculate this dependence, let z be normal to the interface. The total fluid volume enclosed is then:
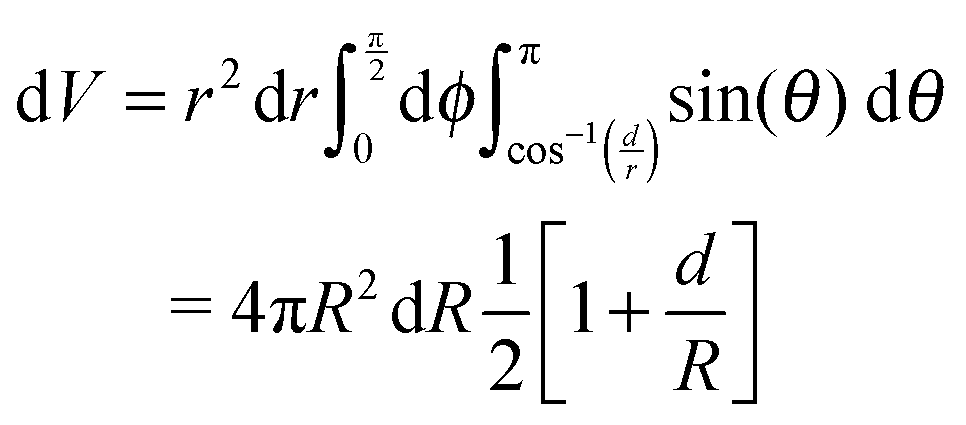 | (3) |
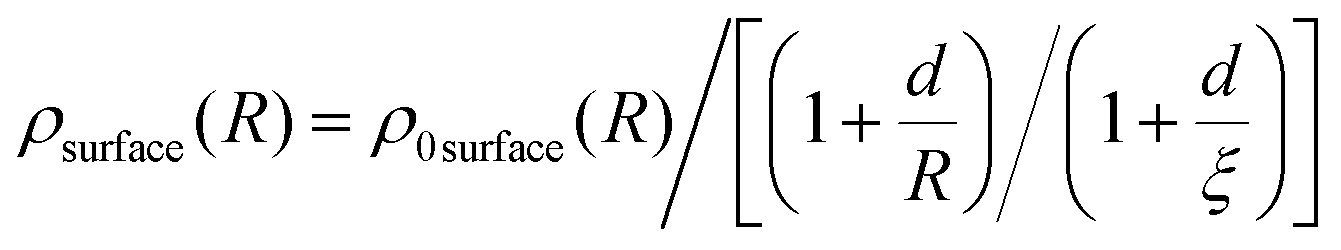 | (4) |
surface(R) is the average surface density. The free parameters were chosen as d = 2 Å (roughly the size of the surface) and ξ = 10 Å (the largest R considered). We note that the surface expansion is unaffected by small variations in d and ξ.
3.4 Hydrogen bonding
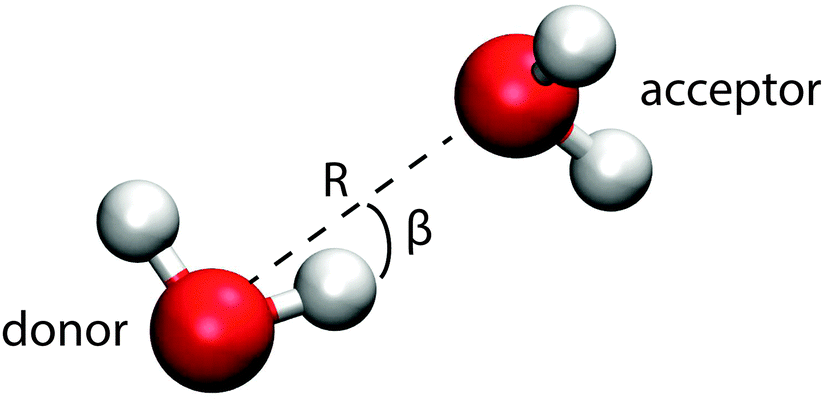
This section introduces the prescription of Kumar et al.22 used to investigate the hydrogen bonding motifs. A distance R is taken to be the O–O separation between two molecules and an angle β is taken to be the H–O–H angle between them (see Fig. 9). The resulting potential of mean force, W(R,β) = −kTln(g(R,β)), is shown in Fig. 7 for the interior and surface regions.
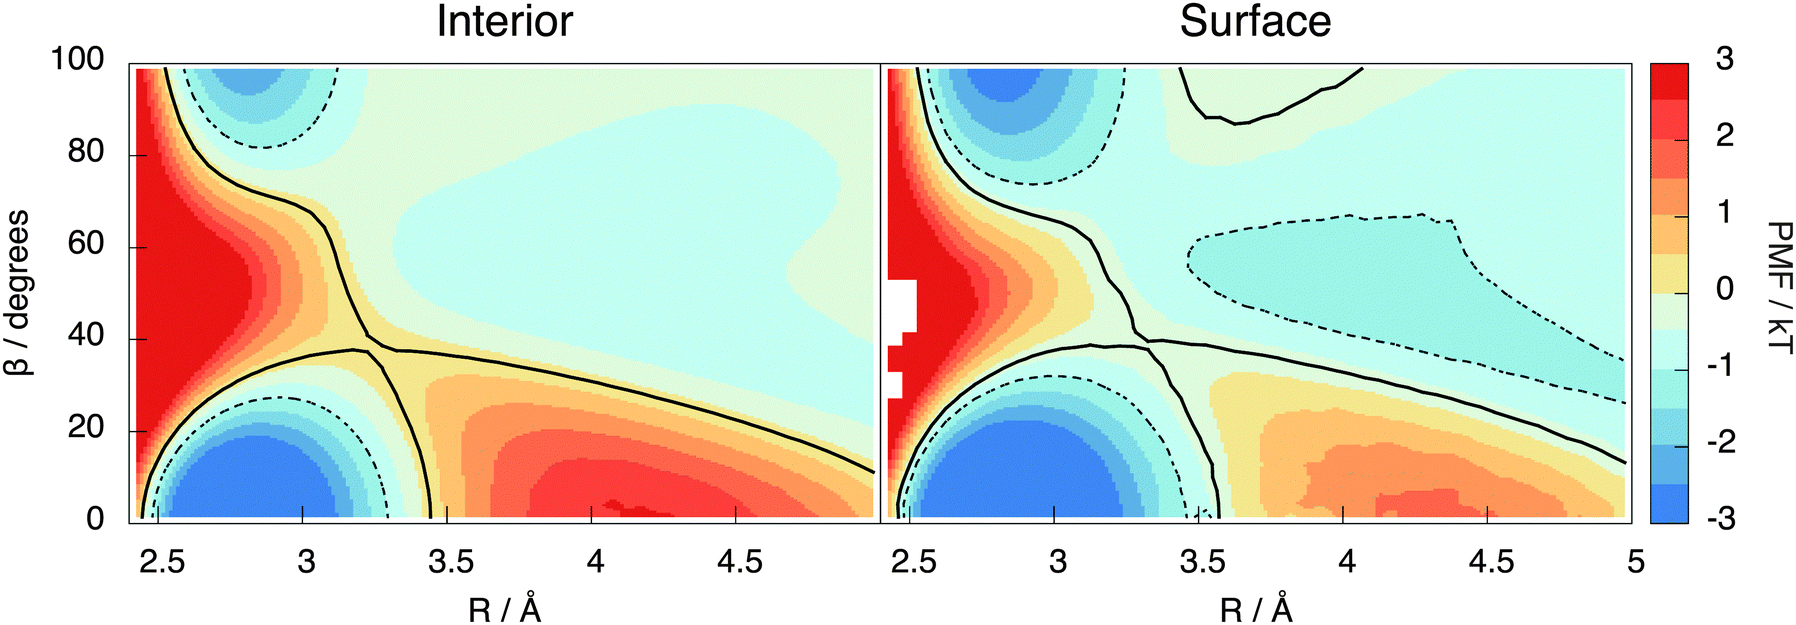 | ||
| Fig. 7 The potential of mean force in the interior (left) and surface (right) regions of the lamella. The black lines are the contour passing through the saddle point, with a hydrogen bond being identified as all R, β configurations within the bottom contour. The dotted line is a more restrictive contour at −1 kT used to confirm the 5 H-bonded configurations were not an analysis artefact. | ||
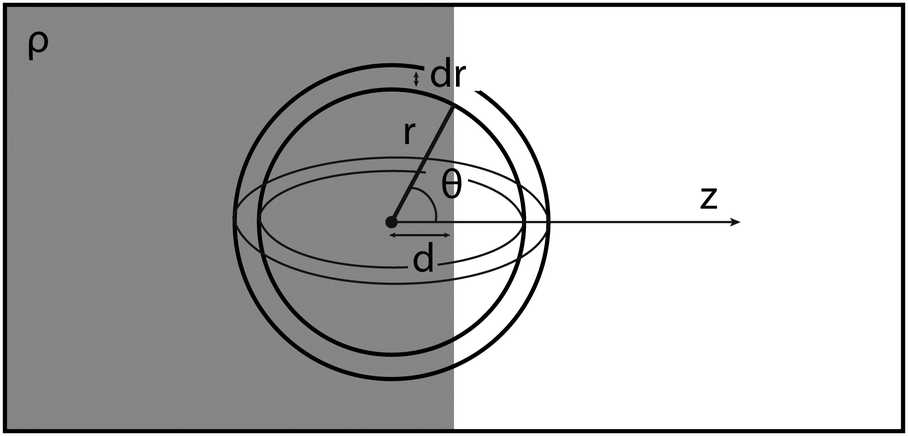 | ||
| Fig. 8 An infinitely sharp interface and a spherical shell of radius r and width dr, centred at distance d away from the interface. | ||
 | ||
| Fig. 9 The coordinates of the potential of mean force. | ||
Two molecules are hydrogen bonded (abbreviated as H-bonded from now on) when their (R,β) coordinates lie inside the contour passing through the saddle point at around 3.5 Å and 40° (black line in Fig. 7). The molecule containing the participating hydrogen is the donor, with the other being the acceptor of this H-bond. The molecules are then categorised based on the number of donors and acceptors, writing a D for each donor and an A for each acceptor. Thus, for example, DDAA represents the traditional 4 coordinated tetrahedral cage of water with 2 donor bonds and 2 acceptor bonds.
Using the criterion given in the previous paragraph, the average number of H-bonds per molecule is 3.77 in the interior region and 3.25 in the surface region, for a 576 water molecule layer. These decrease to 3.71 and 3.16 respectively for a 4000 molecule layer. The values agree the ab initio calculations of Kühne et al.13 in the interior region (where they report 3.7 H-bonds per molecule) yet are greater than their surface value (2.9). Using the same criteria and 576 TIP4P/2005 molecules, we obtain 3.69 H-bonds per molecule in the interior region and 3.11 H-bonds per molecule at the surface. These results show that, as long as we use a consistent H-boding criterion, there is little variation in the number of hydrogen bonds per molecule between empirical models. However, all these results are slightly larger than the experimental estimates of 3.4 (interior, based on the enthalpy of sublimation of ice)33 and 3.0 (based on SFG measurements)3 respectively. Fig. 10 summarises the average number of H-bonds predicted by the different models.
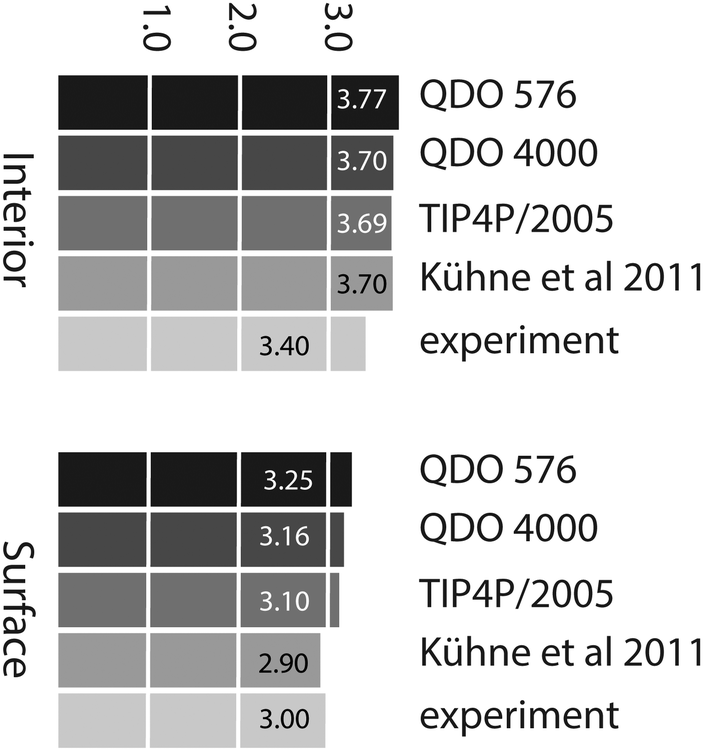 | ||
| Fig. 10 Average number of hydrogen bonds per molecule in the interior region predicted by QDO-water (576 and 4000 molecules), TIP4P/2005 (576 molecules), ab initio13 and experiment.3,33 | ||
In the interior region, the total number of acceptor and donor bonds balance to within 0.3%, as expected – each bond is an acceptor to one molecule and a donor to another. However, at the surface, there is a 6% increase of donor bonds over acceptor bonds. This increase shows a preference of acceptor bonds to be broken when forming the interface, leaving extra donor bonds to be formed with molecules from the interior region, to satisfy water's propensity for four-fold coordination.
3.5 Hydrogen bond populations
To look in depth at the hydrogen bonding imbalance between acceptors and donors, the frequency of each H-bonded configuration in the interior and surface regions of the lamella is computed, as shown in Fig. 11. To verify these frequencies, the configurations with 0, 1 and 2 donor bonds are combined to calculate the percentage of acceptor only (nD), single donor (sD) and double donor (dD) bonds, which have been previously reported in the literature. The interior region contains 1% nD, 13% sD and 86% dD bonds, in agreement with the ab initio simulations of Kühne et al.13 and with TIP4P/2005. Similarly, the surface region contains 2% nD, 29% sD and 68% dD. Thus, QDO-water has a 10% larger population of dD bonds than TIP4P/2005 (3% nD, 39% sD and 57% dD), balanced by a 10% lower population of sD bonds. The surface of QDO-water also shows more structure than the results obtained by Kühne et al.13 (however, we chose a larger interfacial region than Kühne et al.13 following the usual literature convention).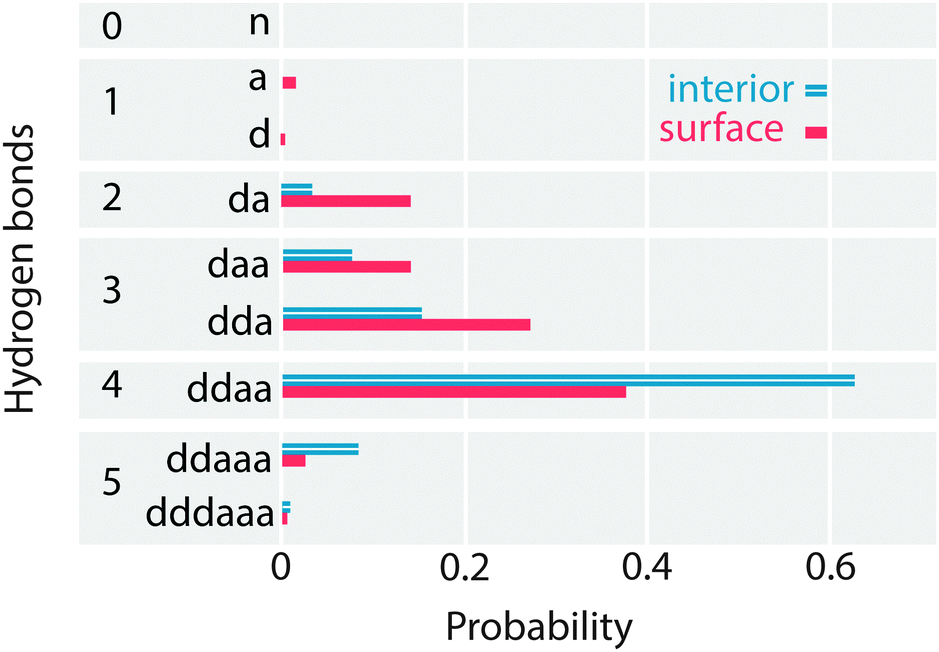 | ||
| Fig. 11 The probability of each H-bond configuration in the surface and interior regions of the lamella. | ||
At the surface, the overall preference for forming donor bonds over acceptor bonds is revealed to be a preference for forming DDA over DAA H-bonded configurations. However, it is notable that this preference remains in the interior region, where DDA still dominates over DAA.
To balance donor and acceptor bonds, the interior region is found to contain a small but statistically significant (8%) population of 5 H-bonded configurations (DDAAA), an example of such being shown in Fig. 12. To our knowledge, these motifs have not been reported before. To test whether they are not an artefact of our method, the PMF contour is reduced to −1kT (the dotted region in Fig. 7). While this reduction decreases the number of 5 H-bonded configurations, they are still present. Our analysis of TIP4P/2005 also shows this motif.
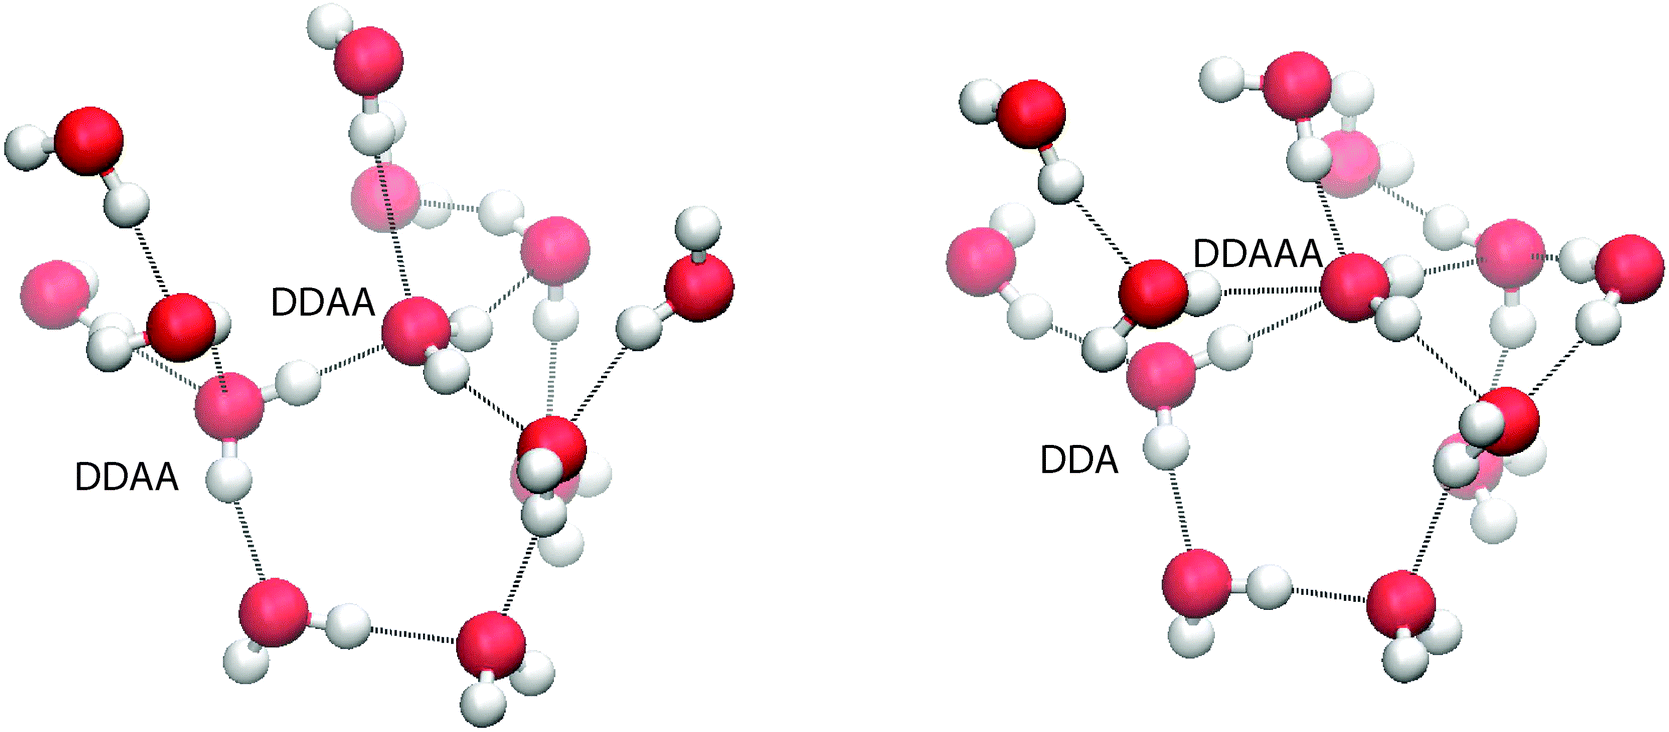 | ||
| Fig. 12 (left) A snapshot of two DDAA molecules evolving into a 5 hydrogen bonded configuration. (right) A snapshot of a 5 hydrogen bonded configuration. | ||
A possible mechanism for the creation of 5 H-bonded species is as follows. Imagine two neighbouring 4-coordinated DDAA molecules (see Fig. 12) sharing an H-bond. In the liquid, fluctuations perturb the structure and those perturbations tend to decrease the volume (since 2 × DDAA is a low density structure). One such fluctuation involves a molecule losing an acceptor bond (becoming DDA), with that bond being immediately transferred to the second molecule, which becomes DDAA.
3.6 Surface orientation
Since, at the surface, the broken hydrogen bonds are more likely to point towards the vapour phase, the preference of breaking acceptors over donors will result in a preferential surface orientation. This orientation is quantified using a joint distribution function of two angles, illustrated in Fig. 13. To define these angles, let c be the C2v symmetry axis of the water molecule (bisecting the H–O–H angle) and b be the HH axis, which is undirected (so ±b represents the same vector). Also, let n be the surface normal.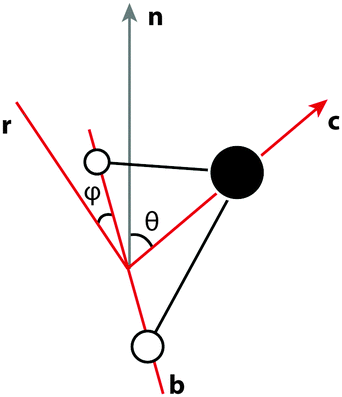 | ||
| Fig. 13 Illustration of the angles used to define the surface orientation. | ||
Define θ (ranging from 0 to 180°) as the angle between c and the surface normal:
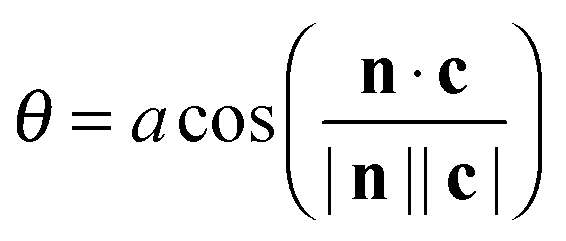 | (5) |
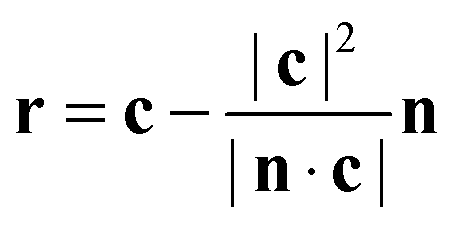 | (6) |
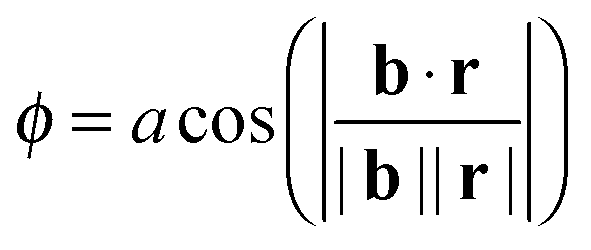 | (7) |
Having these two angles, define the orientational distribution function (ODF) as the number n(θ,ϕ) of molecules with angles between [θ,θ + dθ] and [ϕ,ϕ + dϕ] normalised by the corresponding area of a unit sphere with θ taken as the polar angle and ϕ as the azimuthal angle
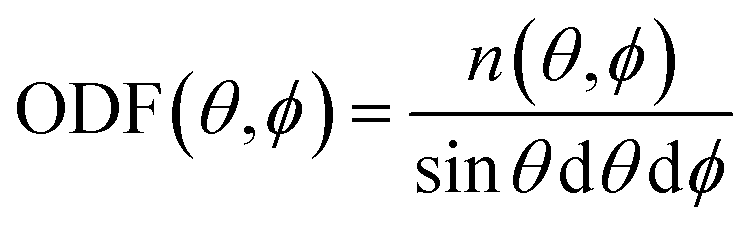 | (8) |
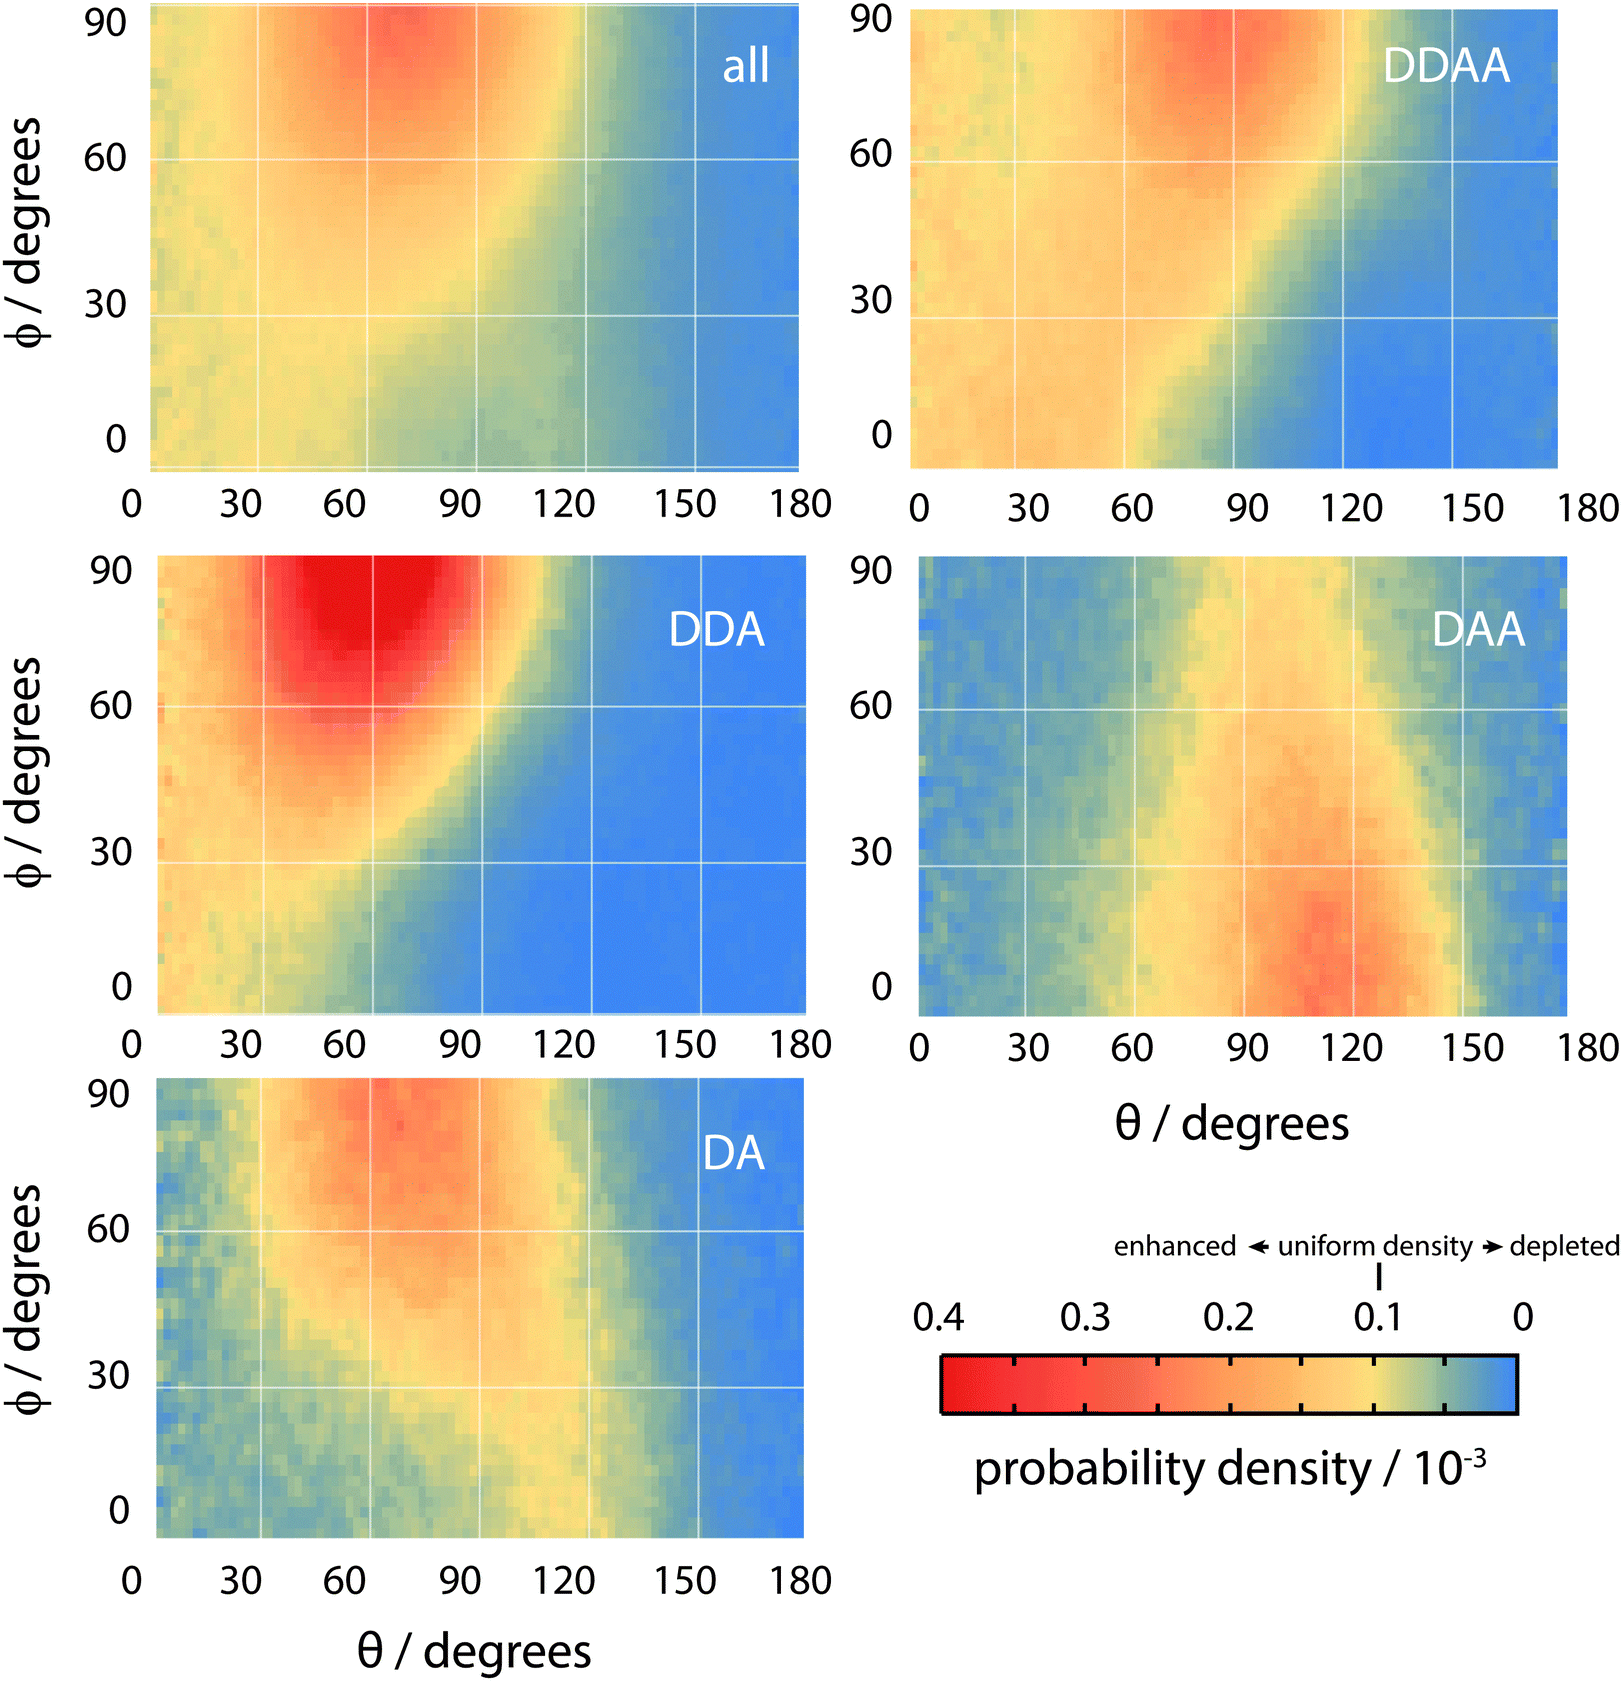 | ||
| Fig. 14 The orientational distribution function of all surface molecules (top left) and of molecules with various hydrogen bonding configurations (labelled by DDAA, DDA, DAA and DA). Yellow represents uniform probability, orange and red represent enhancement and blue depletion. | ||
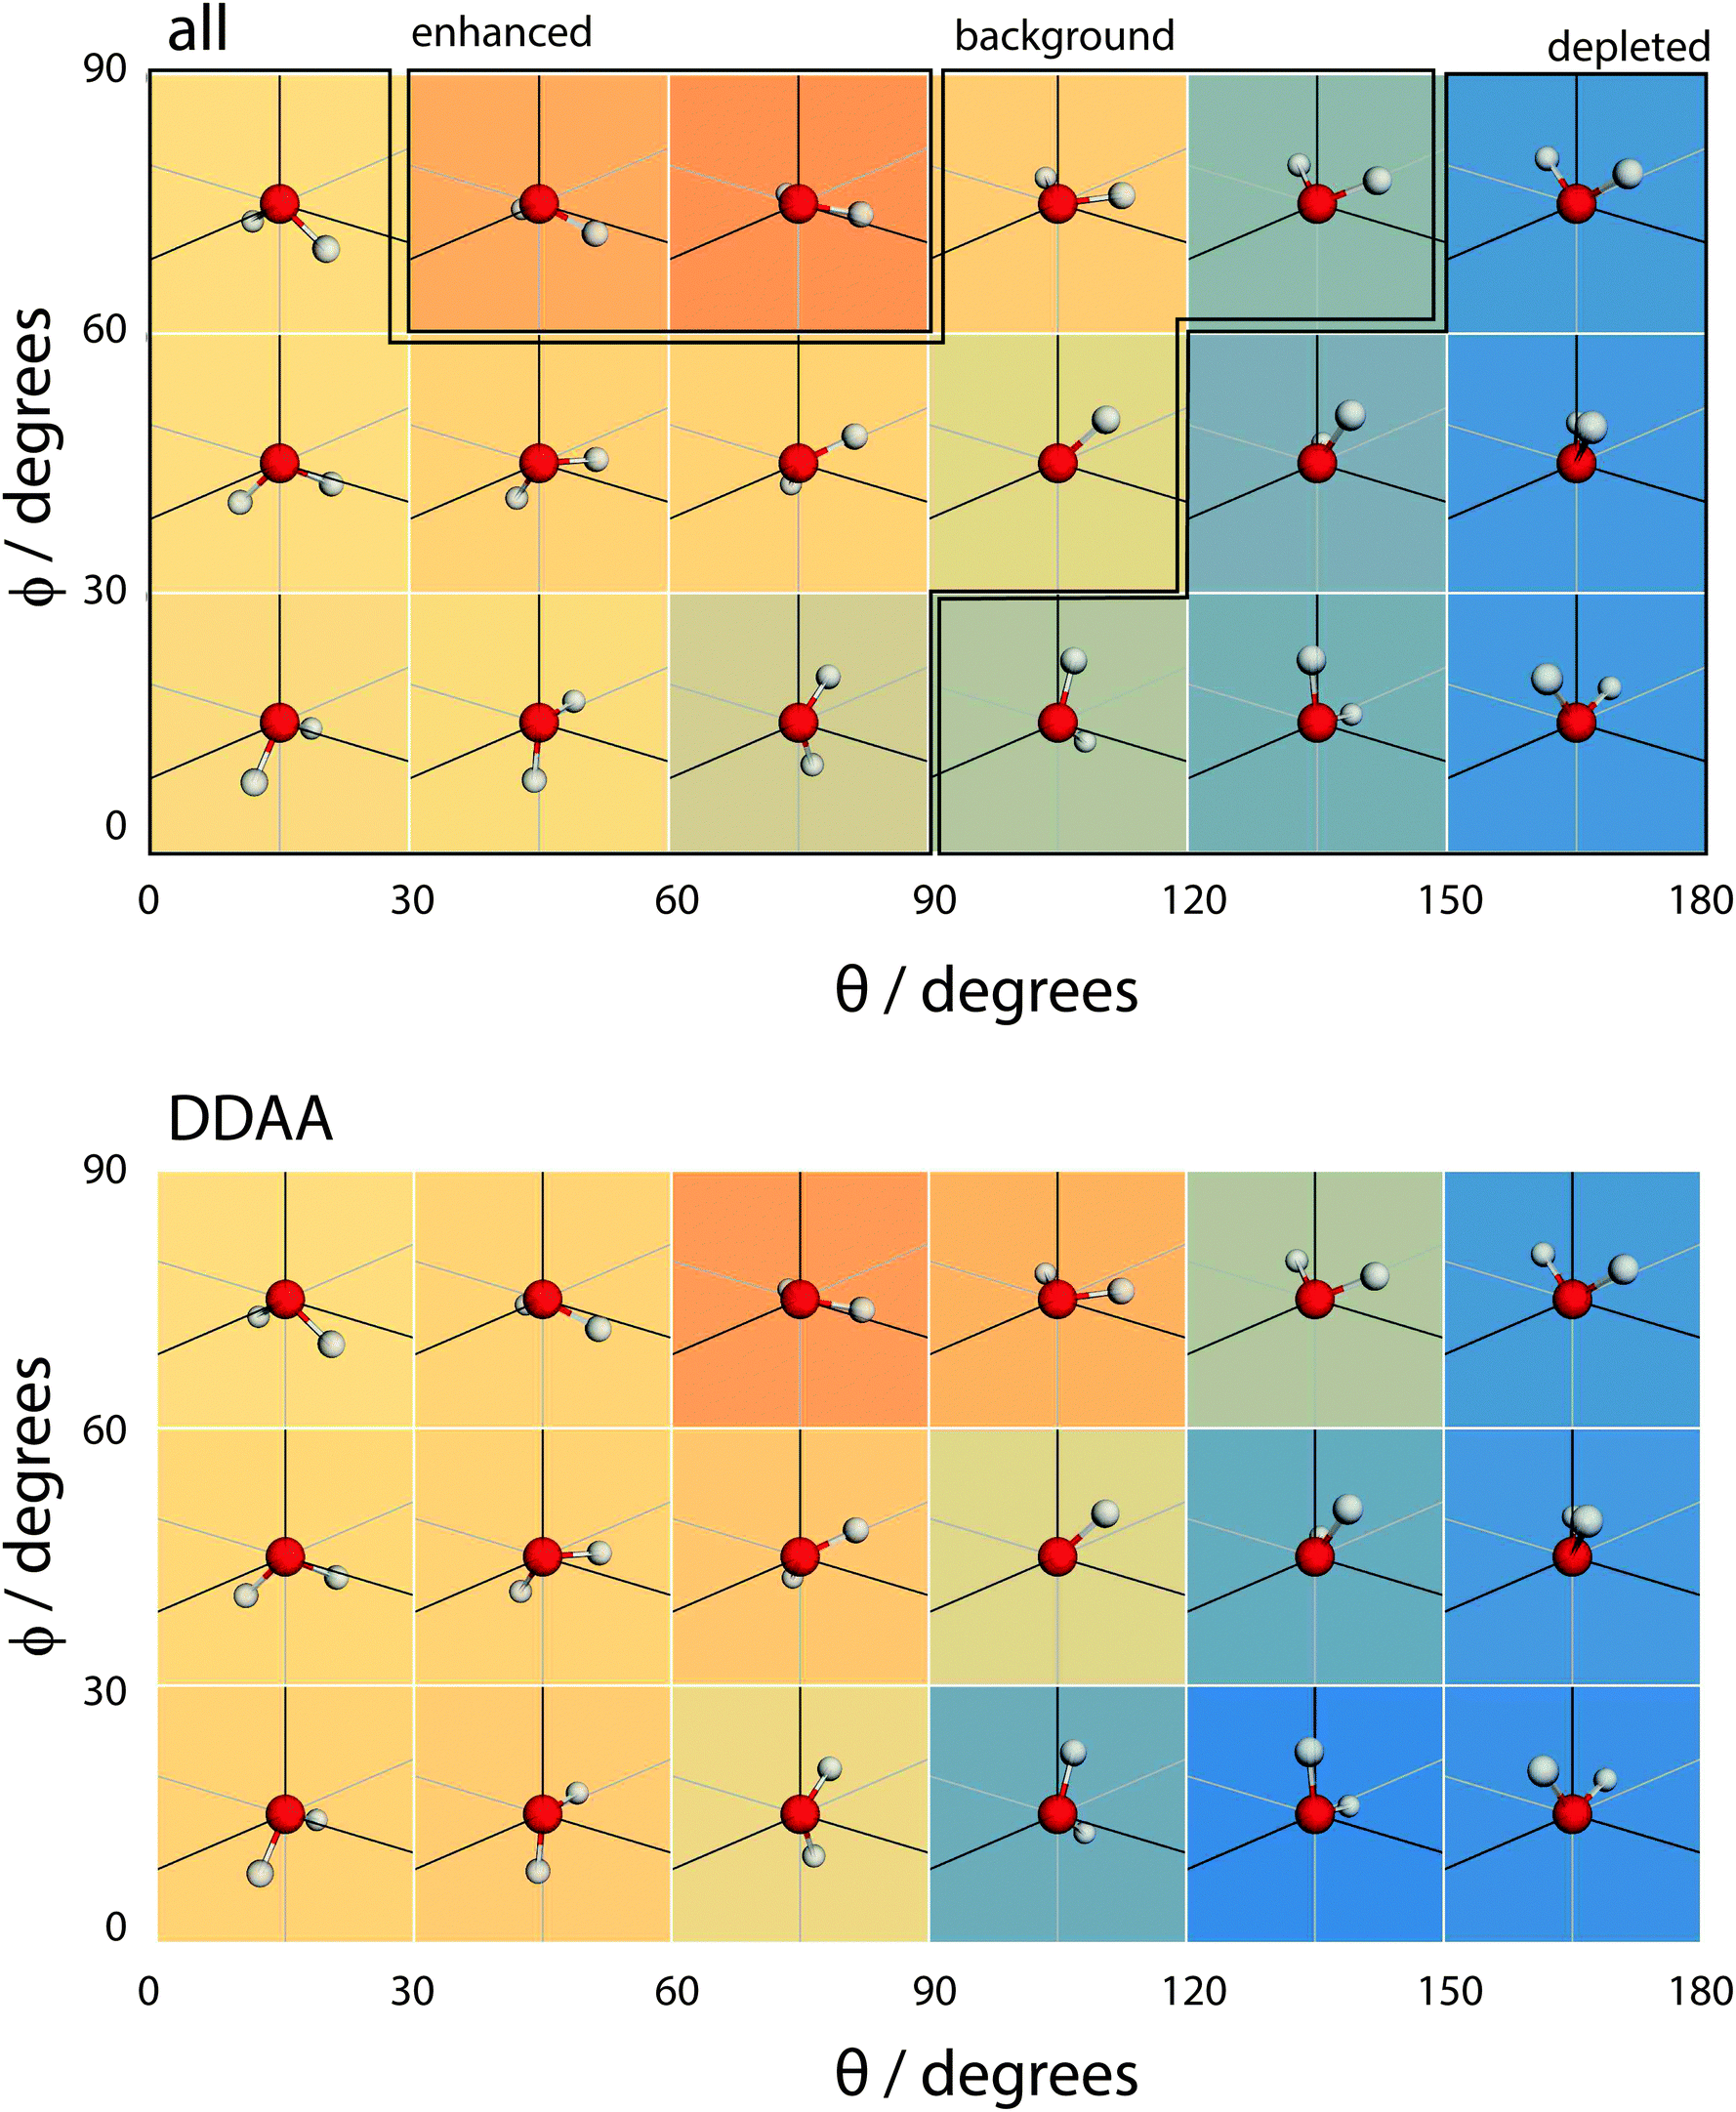 | ||
| Fig. 15 A coarse version of the orientational distribution function (for all molecules and DDAA configurations) superimposed over illustrations of the orientation of water molecules at the given (θ,ϕ) pairs. | ||
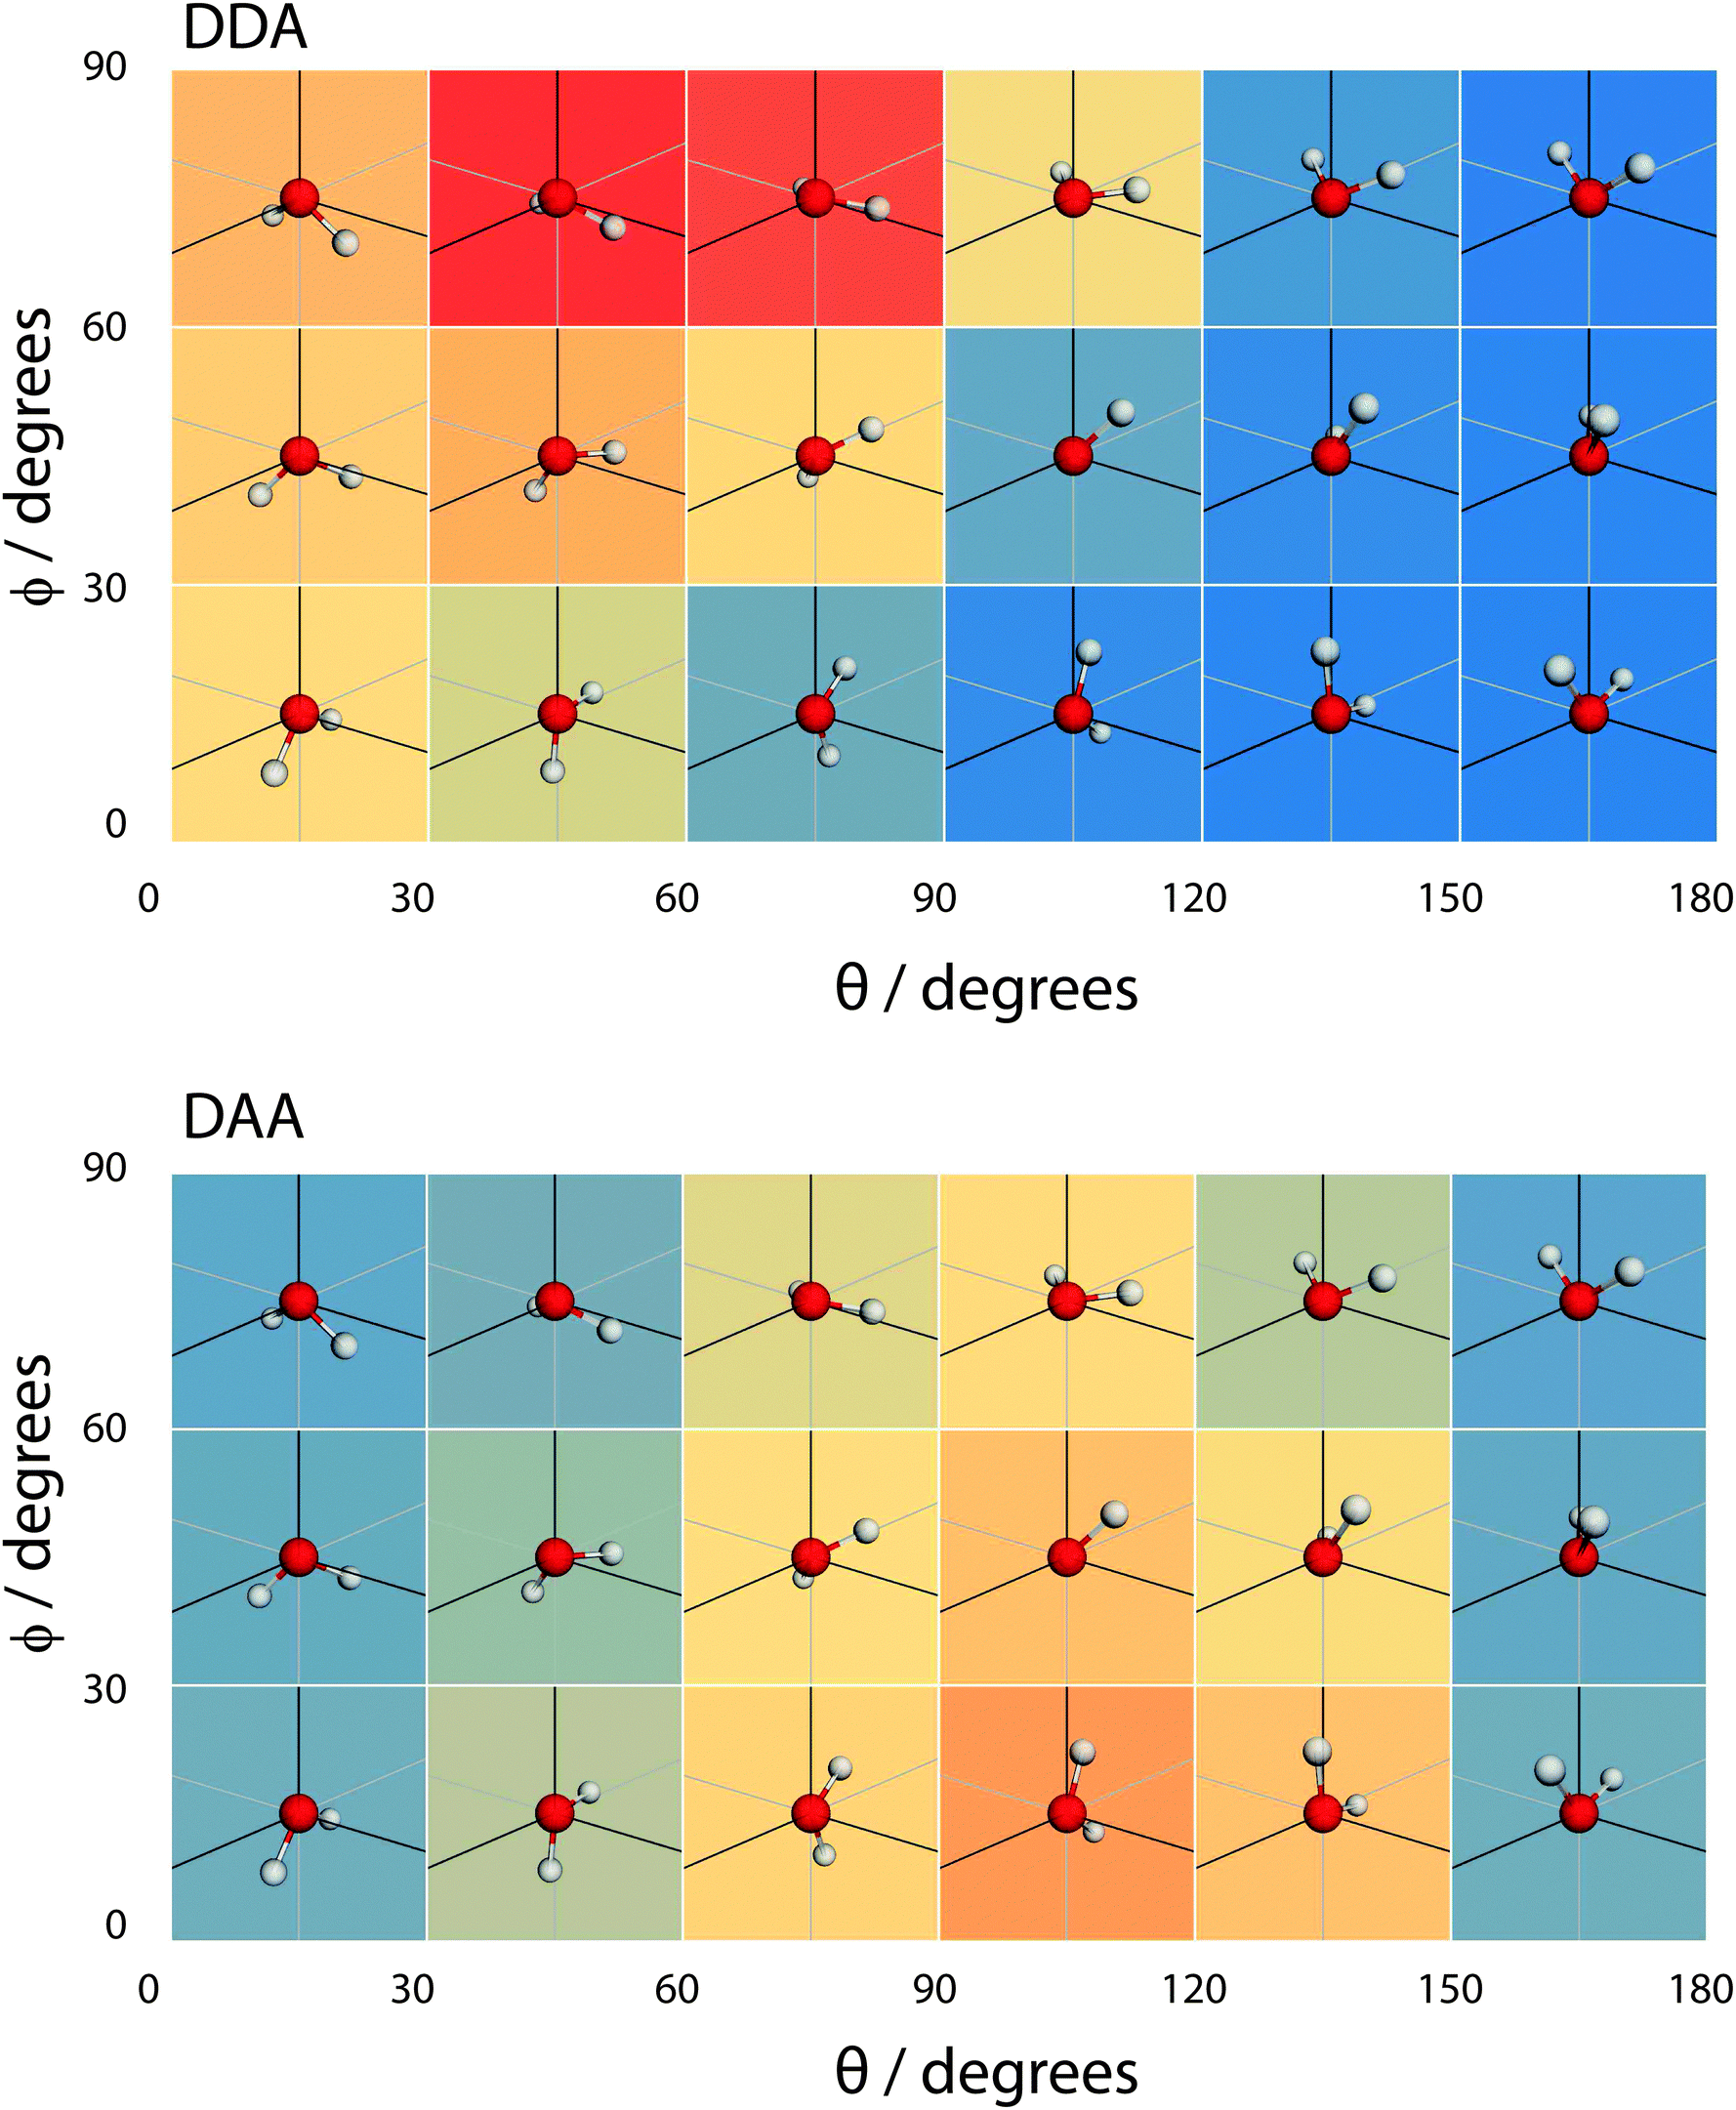 | ||
| Fig. 16 A coarse version of the orientational distribution function (for DDA and DAA configurations) superimposed over illustrations of the orientation of water molecules at the given (θ,ϕ) pairs. | ||
Overall, the surface shows a depletion of θ larger than around 120°, meaning that the molecules arrange in such a way that at least one hydrogen atom points towards the liquid phase. However, the picture is rather more complex when ϕ is taken into account. The broadest distribution of θ occurs at ϕ = 90°, with the distribution becoming narrower as ϕ decreases. To understand the surface orientation in more detail, Fig. 15 and 16 break it down by the type of hydrogen bonds a molecule forms with its neighbours.
When a molecule comes to the surface, it is mostly 4 coordinated (DDAA) and would like to remain so. The surface can still accommodate 4 H-bonded molecules by having the molecular plane parallel to the surface (θ ∼ 90° and ϕ ∼ 90°). The molecule forms two donor bonds and one acceptor bond in the plane of the surface, while the other acceptor bond is made towards the liquid. Fig. 14 shows this trend by means of an enhancement of the ODF of DDAA close to (θ,ϕ) = (90°,90°). Fig. 14 also shows the θ extent of DDAA's depletion region increasing to lower angles as ϕ decreases – the closer the molecular plane becomes to being perpendicular to the surface, the more large values of θ are suppressed, aligning the donor bonds towards the liquid phase.
When the molecule breaks a bond to become 3 H-bonded, the alignment is strongly influenced by whether that bond is an acceptor or a donor. If the molecule breaks an acceptor bond, it becomes a DDA, with (θ,ϕ) peaking at around (60°,90°) – i.e. with the molecule arranged such that the hydrogen atoms point towards the liquid and the oxygen towards the vapour.
In the case of a DAA, the situation is reversed – one hydrogen and the oxygen are pointing towards the liquid, one hydrogen towards the vacuum. It is here we see the close link between hydrogen bonding and surface orientation – if DDA didn't dominate over DAA, the overall surface ODF would have had a second peak in the region around (θ,ϕ) = (120°,0°).
Finally, since the preference of DDA over DAA is observed in both regions, we postulate that it is the cause for the surface orientation of water. In other words, hydrogen bonds are intrinsically asymmetric. This underlying asymmetry causes the appearance of DDAAA species in the interior region and preferentially orients the molecules at the liquid–vapour interface.
4 Conclusions
This paper presents a first application of the Quantum Drude Oscillator model of water to the liquid–vapour interface. The model contains the full set of polarization and dispersion responses (including higher order and many-body terms) reproducing exactly the leading order terms by construction for the isolated molecule. Supplemented only by a simple form for short range repulsion, no empirical condensed phase data is used to define model parameters. As a result, the model is unbiased toward any thermodynamic state point or environment and should be well suited to heterogeneous environments.We show that the model generates a physical surface and is capable of capturing sufficient physics to predict with remarkable accuracy (within 1% of experimental values) the temperature evolution of the surface tension along coexistence from ambient temperature to the critical point. Coupled with earlier work on bulk water, this result demonstrates an exceptional degree of transferability in the QDO model and offers a promising new platform from which to explore the molecular structure of the free surface.
Unique among empirical models, the QDO framework retains a highly non-trivial electronic structure. From this, we find that the surface molecules at 300 K exhibit a mean molecular dipole moment ranging from 2.52 D (at 90% density) to 2.34 D (at 10% density), with the interior value being 2.6 D. The hydrogen bond network is found to be truncated at the liquid–vapour interface preferentially on the hydrogen acceptor side. This truncation leads to a depletion of all molecular orientations with both hydrogen atoms dangling towards the gas phase, resulting in a surface where 98% of the molecules have at least one bound hydrogen (and thus a negligible population of acceptor only species). These observations agree with the conclusions of Kühne et al.13 and with our simulations of TIP4P/2005 but are at odds with those of Kuo et al.14 concerning the presence of acceptor-only species. This analysis shows that the surface of neat water has a negligible fraction of acceptor only molecules. We are currently investigating how the post mean field surface analysis of Willard and Chandler34 affects the results.
We have also identified two other hydrogen bonding motifs: a preference for DDA over DAA hydrogen bonding configurations and the appearance of 5 hydrogen bonded species. Since this preference is present in both the interior and surface regions and for TIP4P/2005, we postulate that the intrinsic hydrogen bonding asymmetry between acceptor and donor bonds is the molecular scale mechanism leading to the observed surface orientation at the free interface.
The observation of an underlying asymmetry in hydrogen bonding adds to the growing body of evidence that liquid water's structure is more asymmetric than a simple perturbed tetrahedral network35,36 and that hydrogen bond acceptors and donors have different instantaneous contact strengths.37,38
Acknowledgements
Thanks to Prof. Graeme Ackland for useful discussions and valuable suggestions. This work was supported by the NPL Strategic Research programme. FSC acknowledges the Scottish Condensed Matter Doctoral Training Centre and the NPL for funding under an EPSRC CASE scholarship. We acknowledge use of Hartree Centre resources in this work. APJ acknowledges the European Metrology Research Programme (EMRP) support.References
- F. Stillinger, J. Solution Chem., 1973, 2, 141–158 CrossRef CAS.
- A. P. Willard and D. Chandler, J. Chem. Phys., 2014, 141, 18C519 CrossRef PubMed.
- Q. Du, R. Superfine, E. Freysz and Y. Shen, Phys. Rev. Lett., 1993, 70, 2313–2316 CrossRef CAS.
- E. A. Raymond, T. L. Tarbuck, M. G. Brown and G. L. Richmond, J. Phys. Chem. B, 2003, 107, 546–556 CrossRef CAS.
- B. M. Auer and J. L. Skinner, J. Chem. Phys., 2008, 129, 214705 CrossRef CAS PubMed.
- P. A. Pieniazek, C. J. Tainter and J. L. Skinner, J. Am. Chem. Soc., 2011, 133, 10360–10363 CrossRef CAS PubMed.
- S. Nihonyanagi, J. A. Mondal, S. Yamaguchi and T. Tahara, Annu. Rev. Phys. Chem., 2013, 64, 579–603 CrossRef CAS PubMed.
- C.-S. Hsieh, M. Okuno, J. Hunger, E. H. G. Backus, Y. Nagata and M. Bonn, Angew. Chem., Int. Ed., 2014, 53, 8146–8149 CrossRef CAS PubMed.
- C.-S. Hsieh, R. K. Campen, M. Okuno, E. H. G. Backus, Y. Nagata and M. Bonn, Proc. Natl. Acad. Sci. U. S. A., 2013, 110, 18780–18785 CrossRef CAS PubMed.
- D. Marx, Science, 2004, 303, 634–636 CrossRef CAS PubMed.
- M. A. Wilson, A. Pohorille and L. R. Pratt, J. Phys. Chem., 1987, 91, 4873–4878 CrossRef CAS.
- I.-F. W. Kuo, Science, 2004, 303, 658–660 CrossRef CAS PubMed.
- T. D. Kühne, T. A. Pascal, E. Kaxiras and Y. Jung, J. Phys. Chem. Lett., 2011, 2, 105–113 CrossRef.
- I.-F. W. Kuo, C. J. Mundy, B. L. Eggimann, M. J. McGrath, J. I. Siepmann, B. Chen, J. Vieceli and D. J. Tobias, J. Phys. Chem. B, 2006, 110, 3738–3746 CrossRef CAS PubMed.
- C. D. Wick, I.-F. W. Kuo, C. J. Mundy and L. X. Dang, J. Chem. Theory Comput., 2007, 3, 2002–2010 CrossRef CAS.
- C. Vega and E. de Miguel, J. Chem. Phys., 2007, 126, 154707 CrossRef CAS PubMed.
- Y. A. Mantz, B. Chen and G. J. Martyna, Chem. Phys. Lett., 2005, 405, 294–299 CrossRef CAS PubMed.
- I.-C. Lin, A. P. Seitsonen, I. Tavernelli and U. Rothlisberger, J. Chem. Theory Comput., 2012, 8, 3902–3910 CrossRef CAS.
- A. Jones, F. Cipcigan, V. P. Sokhan, J. Crain and G. J. Martyna, Phys. Rev. Lett., 2013, 110, 227801 CrossRef CAS.
- V. Sokhan, A. Jones, F. Cipcigan, J. Crain and G. Martyna, Signature properties of water: Their molecular electronic origins, in preparation Search PubMed.
- A. Jones, J. Crain, F. Cipcigan, V. Sokhan, M. Modani and G. Martyna, Mol. Phys., 2013, 111, 3465–3477 CrossRef CAS.
- R. Kumar, J. R. Schmidt and J. L. Skinner, J. Chem. Phys., 2007, 126, 204107 CrossRef CAS PubMed.
- A. Jones, PhD thesis, The University of Edinburgh, 2010.
- G. J. Martyna, M. L. Klein and M. Tuckerman, J. Chem. Phys., 1992, 97, 2635 CrossRef PubMed.
- E. Lemmon, M. McLinden and D. Friend, Thermophysical Properties of Fluid Systems, NIST Standard Reference Database Number 69, National Institute of Standards and Technology, 2005 Search PubMed.
- A. K. Soper, ISRN Phys. Chem., 2013, 1–67 CrossRef CAS.
- C. A. Coulson and D. Eisenberg, Proc. R. Soc. A, 1966, 291, 445–453 CrossRef CAS.
- Y. S. Badyal, M.-L. Saboungi, D. L. Price, S. D. Shastri, D. R. Haeffner and A. K. Soper, J. Chem. Phys., 2000, 112, 9206 CrossRef CAS PubMed.
- P. Silvestrelli and M. Parrinello, Phys. Rev. Lett., 1999, 82, 3308–3311 CrossRef CAS.
- W. Wagner, J. Phys. Chem. Ref. Data, 1999, 31, 387 CrossRef PubMed.
- P. Holoborodko, Smooth Noise Robust Differentiators,bit.ly/noise-differentiators, 2008.
- K. R. Wilson, R. D. Schaller, D. T. Co, R. J. Saykally, B. S. Rude, T. Catalano and J. D. Bozek, J. Chem. Phys., 2002, 117, 7738 CrossRef CAS PubMed.
- L. Pauling, The Nature of the Chemical Bond and the Structure of Molecules and Crystals: An Introduction to Modern Structural Chemistry, Cornell University Press, 1960 Search PubMed.
- A. P. Willard and D. Chandler, J. Phys. Chem. B, 2010, 114, 1954–1958 CrossRef CAS PubMed.
- P. Wernet, Science, 2004, 304, 995–999 CrossRef CAS PubMed.
- T. Head-Gordon and M. E. Johnson, Proc. Natl. Acad. Sci. U. S. A., 2006, 103, 7973–7977 CrossRef CAS PubMed.
- T. D. Kühne and R. Z. Khaliullin, Nat. Commun., 2013, 4, 1450 CrossRef PubMed.
- T. D. Kühne and R. Z. Khaliullin, J. Am. Chem. Soc., 2014, 136, 3395–3399 CrossRef PubMed.
Footnotes |
| † TIP4P/2005 is parametrised to the ambient liquid density, temperature of maximum density, enthalpy of vaporisation, density of ice II at 123 K and 0 MPa, density of ice V at 223 K and 530 MPa and the range of temperatures at which ice III is stable at 300 MPa.16 |
| ‡ e is the electronic unit of charge, me is the electronic mass and ωH is the Hartree frequency. |
| This journal is © the Owner Societies 2015 |