 Open Access Article
Creative Commons Attribution 3.0 Unported Licence
Electrochemical in situ investigations of SEI and dendrite formation on the lithium metal anode
Georg
Bieker
,
Martin
Winter
and
Peter
Bieker
*
MEET Battery Research Center, Institute of Physical Chemistry, University of Münster, Corrensstrasse 28/30, 48149 Münster, Germany. E-mail: peter.bieker@uni-muenster.de
First published on 19th February 2015
Abstract
This comparative work studies the self-enforcing heterogeneity of lithium deposition and dissolution as the cause for dendrite formation on the lithium metal anode in various liquid organic solvent based electrolytes. In addition, the ongoing lithium corrosion, its rate and thus the passivating quality of the SEI are investigated in self-discharge measurements. The behavior of the lithium anode is characterized in two carbonate-based standard electrolytes, 1 M LiPF6 in EC/DEC (3![[thin space (1/6-em)]](https://www.rsc.org/images/entities/char_2009.gif) :
:![[thin space (1/6-em)]](https://www.rsc.org/images/entities/char_2009.gif) 7) and 1 M LiPF6 in EC/DMC (1
7) and 1 M LiPF6 in EC/DMC (1![[thin space (1/6-em)]](https://www.rsc.org/images/entities/char_2009.gif) :
:![[thin space (1/6-em)]](https://www.rsc.org/images/entities/char_2009.gif) 1), and in two alternative electrolytes 1 M LiPF6 in TEGDME and 1 M LiTFSI in DMSO, which have been proposed in the literature as promising electrolytes for lithium metal batteries, more specifically for lithium/air batteries. As a result, electrolyte decomposition, SEI and dendrite formation at the lithium electrode as well as their mutual influences are understood in the development of overpotentials, surface resistances and lithium electrode surface morphologies in subsequent lithium deposition and dissolution processes. A general model of different stages of these processes could be elaborated.
1), and in two alternative electrolytes 1 M LiPF6 in TEGDME and 1 M LiTFSI in DMSO, which have been proposed in the literature as promising electrolytes for lithium metal batteries, more specifically for lithium/air batteries. As a result, electrolyte decomposition, SEI and dendrite formation at the lithium electrode as well as their mutual influences are understood in the development of overpotentials, surface resistances and lithium electrode surface morphologies in subsequent lithium deposition and dissolution processes. A general model of different stages of these processes could be elaborated.
Introduction
The lithium metal anode provides a very high capacity and the lowest potential of all metallic anode materials.1–3 Therefore, it is not only used in commercial primary lithium metal batteries, but is also proposed as an anode material in rechargeable lithium/air4,5 and lithium/sulfur batteries, which are considered as super-high specific energy accumulators of tomorrow. These high energy batteries are urgently demanded to meet a longer driving range in electric vehicles (electro-mobility).6However, the rechargeable lithium metal anode suffers from poor rechargeability and low safety.2,3,7 Due to the low potential the electrolytes used are thermodynamically not stable against lithium. Their reductive decomposition and the parallel corrosion of the Li electrode lead to the formation of the solid electrolyte interphase (SEI).8,9 This passivating film is supposed to slow down or in the ideal case even prevent electrolyte decomposition.1,2,10–14 In addition, heterogeneous lithium deposition and dissolution during charge and discharge of the lithium metal anode eventually leads to high surface area lithium, commonly called lithium dendrites in most of the organic solvent-based electrolytes.2,3,7,15–18 This may cause a loss of active material due to enhanced lithium corrosion at the high surface area Li, as well as due to the disconnection of dendrites from electronic contact. In addition, short-circuit of the cell may happen when the dendrites grow across the electrolyte to the cathode. In any case, the continuous creation of new lithium surfaces by dendrite formation leads to continuous electrolyte decomposition during cycling.
For a better understanding of these phenomena and their mutual influences it appears favourable to take a closer look at the kinetics of lithium dissolution (= discharge, stripping) and deposition (= charge, plating) of/at the lithium metal anode. As these are represented by overpotentials, we developed a method to observe dendrite formation in situ in constant current cycling experiments. To exclude effects from a non-lithium metal cathode material, these experiments were carried out in symmetrical Li/Li cells. Electrochemical impedance spectroscopy (EIS) and scanning electron microscopy (SEM) were used to support the interpretation of the overpotentials by measuring the development of the electrode surface resistance (EIS) and its morphology (SEM) during subsequent lithium deposition and dissolution processes.
The second part of this study concentrates on the investigation of SEI formation and the passivating properties of the SEI by deposition and dissolution of lithium on/of a Cu foil as a counter electrode (CE). The difference between the charge invested for the deposition process and the charge gained for lithium dissolution is a rough but fast indicator for the amount of the deposited lithium that has been corroded or has lost electronic contact. Additional information about the protective properties of the SEI was gathered by detecting the rate of the ongoing lithium corrosion in self-discharge measurements. In these experiments, the difference in Coulombic efficiency during lithium deposition and dissolution on Cu depends on a rest time interval between the deposition and dissolution processes.
The above experiments were carried out as comparative investigations in various liquid electrolytes. Therefore, the performance of the lithium metal anode in 1 M lithium hexafluorophosphate (LiPF6) in ethylene carbonate (EC)/diethyl carbonate (DEC) (3![[thin space (1/6-em)]](https://www.rsc.org/images/entities/char_2009.gif) :
:![[thin space (1/6-em)]](https://www.rsc.org/images/entities/char_2009.gif) 7),5,16,19–25 1 M LiPF6 in ethylene carbonate (EC)/dimethyl carbonate (DMC) (1
7),5,16,19–25 1 M LiPF6 in ethylene carbonate (EC)/dimethyl carbonate (DMC) (1![[thin space (1/6-em)]](https://www.rsc.org/images/entities/char_2009.gif) :
:![[thin space (1/6-em)]](https://www.rsc.org/images/entities/char_2009.gif) 1),5,18,20,22–25 1 M LiPF6 in tetraethylene glycol dimethyl ether (TEGDME)4,26–33 and 1 M lithium bis(trifluoromethanesulfonyl)imide (LiTFSI) in dimethyl sulfoxide (DMSO)4,29,34 was investigated. As EC/DEC- and EC/DMC-based electrolytes are the broadly investigated state-of-the-art electrolytes in lithium-ion batteries,35,36 they were chosen as a standard system. The TEGDME- and DMSO-based electrolytes were chosen because they have been reported as promising electrolytes for lithium/air batteries. The investigations of the lithium anode surface in TEGDME-based electrolytes might be of additional special importance as many polymer-based electrolytes use polyethers, such as polyethylene oxide (PEO) and poly[bis((methoxyethoxy)ethoxy)phosphazene] (MEEP) with similar functional groups.37
1),5,18,20,22–25 1 M LiPF6 in tetraethylene glycol dimethyl ether (TEGDME)4,26–33 and 1 M lithium bis(trifluoromethanesulfonyl)imide (LiTFSI) in dimethyl sulfoxide (DMSO)4,29,34 was investigated. As EC/DEC- and EC/DMC-based electrolytes are the broadly investigated state-of-the-art electrolytes in lithium-ion batteries,35,36 they were chosen as a standard system. The TEGDME- and DMSO-based electrolytes were chosen because they have been reported as promising electrolytes for lithium/air batteries. The investigations of the lithium anode surface in TEGDME-based electrolytes might be of additional special importance as many polymer-based electrolytes use polyethers, such as polyethylene oxide (PEO) and poly[bis((methoxyethoxy)ethoxy)phosphazene] (MEEP) with similar functional groups.37
Results and discussion
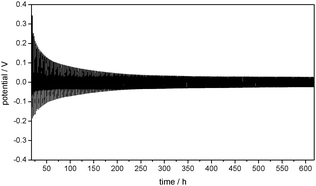
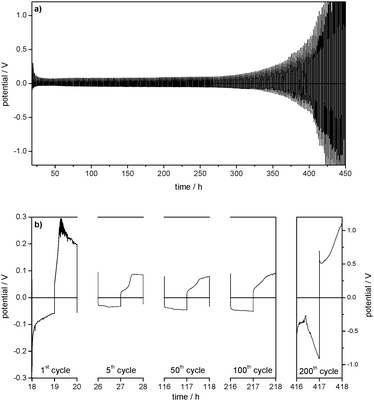
The potential of the lithium metal working electrode (WE) during constant current lithium deposition and dissolution in a Li/Li cell containing 1 M LiPF6 in EC/DEC (3![[thin space (1/6-em)]](https://www.rsc.org/images/entities/char_2009.gif) :
:![[thin space (1/6-em)]](https://www.rsc.org/images/entities/char_2009.gif) 7) electrolyte is presented in Fig. 1. The positive potentials of the Li WE against the Li/Li+ reference electrode (RE) represent the overpotentials appearing during lithium dissolution, whereas the negative potentials represent the overpotentials during lithium deposition on the WE. This experiment shows that the overpotentials of both the lithium deposition and dissolution processes strongly decrease under repeated cycling.
7) electrolyte is presented in Fig. 1. The positive potentials of the Li WE against the Li/Li+ reference electrode (RE) represent the overpotentials appearing during lithium dissolution, whereas the negative potentials represent the overpotentials during lithium deposition on the WE. This experiment shows that the overpotentials of both the lithium deposition and dissolution processes strongly decrease under repeated cycling.
Overpotentials are generated by kinetic hindrances in the system. In lithium plating and stripping processes, these may include the lithium ion transport in the electrolyte and in the electrode/electrolyte interphase, such as the SEI, and always the kinetic hindrance of the lithium ion reduction and oxidation processes at the electrode itself, influencing the charge transfer resistance. The contributions of these processes to the overall cell resistance can be identified by electrochemical impedance spectroscopy (EIS).
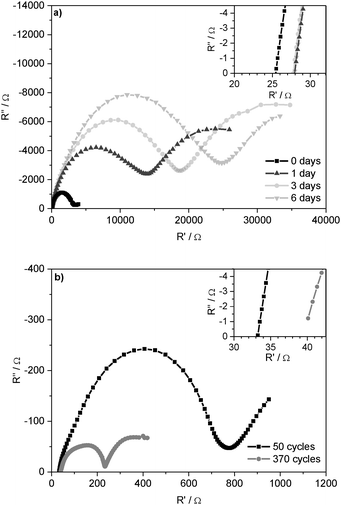
Fig. 2a presents the Nyquist plot of impedance spectra of symmetrical Li/Li cells after 0, 1, 3, and 6 days under open circuit potential (OCP) conditions. The spectra start with the Ohmic resistance and then show a semicircle at lower frequencies. Whereas the Ohmic part of the cell resistance is determined by the ionic conductivity of the electrolyte (Relectrolyte), the following semicircle consequently corresponds to the processes at/on the two electrodes: capacitive properties of the grain boundary resistances in the SEI and the charge-transfer resistances at the Li electrodes.9,38 As these resistances occur on/at the surface of the Li electrodes (including the SEI), they are summarized (see Experimental part) and interpreted as ‘Li electrode surface resistance’ (Rsurface). The determined resistance values are given in Table 1. Based on the native surface film on the untreated Li foil, this increase indicates further formation of the SEI with its bulk and grain boundary resistances. Under OCP conditions, these resistances converge to the maximal values after several days. Hence, the SEI thickness and composition are deduced to remain constant.
![[thin space (1/6-em)]](https://www.rsc.org/images/entities/char_2009.gif) :
:![[thin space (1/6-em)]](https://www.rsc.org/images/entities/char_2009.gif) 7) as the electrolyte before and after 6 days under OCP conditions and after 50 and 370 lithium plating/stripping cycles at j = 0.1 mA cm−2
7) as the electrolyte before and after 6 days under OCP conditions and after 50 and 370 lithium plating/stripping cycles at j = 0.1 mA cm−2
| Cycling conditions | R electrolyte/Ω | R surface/Ω |
|---|---|---|
| Uncycled, 0 d | 26 | 3255 |
| Uncycled, 6 d | 28 | 25![[thin space (1/6-em)]](https://www.rsc.org/images/entities/char_2009.gif) 089 089 |
| 50 cycles, 5 d | 33 | 760 |
| 370 cycles, 32 d | 39 | 237 |
These experiments also revealed that the Ohmic resistance of the electrolyte Relectrolyte is far lower than the resistances at the electrode surface Rsurface. The same could be observed for the other electrolytes. Therefore, it can be assumed that the overpotential of lithium deposition and dissolution processes is determined by the nature of the SEI and the processes at the lithium/electrolyte interface.
Fig. 2b shows the Nyquist plot of the impedance spectra after 50 and 370 subsequent lithium deposition and dissolution processes, i.e. after 50 and 370 ‘cycles’. The comparison of the resistances in the cells under OCP conditions with the resistances of the cycled cells is given in Table 1.
It can be seen that the surface resistance Rsurface of the cells after 50 lithium plating/stripping cycles is one order of magnitude lower than the surface resistance of the cell measured directly after assembly (0 days) and two orders of magnitude lower than that measured after 6 days under OCP conditions. This effect correlates with the strong decrease of the overpotentials in the plating/stripping experiments (compare Fig. 1) and can be explained by a large increase in the surface area of the lithium anode during cycling. The different shapes of the impedance spectra are coherent with the changing lithium electrode surface morphology and the chemically different SEI after 50 and 370 cycles.
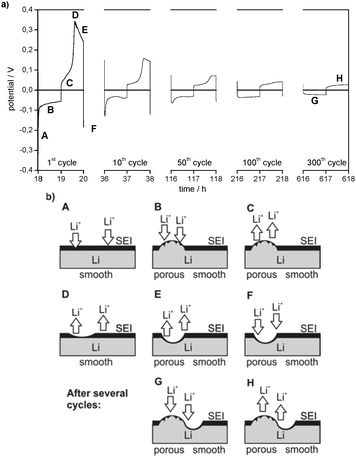
Besides the general decrease of the overpotentials the shape of the overpotential profiles also changes during cycling (Fig. 3a). Long-term cycling experiments show that the overpotential profiles become constant after a certain number of cycles. As the overpotential profiles change continuously from the first cycle to the cycle where the profile shape gets constant these two potential profiles will be discussed in detail.
The first lithium deposition process starts with an immediate drop in the potential (to −0.3 V at j = 0.1 mA cm−2, Fig. 3a) (region A). This large drop, which is the maximum overpotential in the whole experiment, can be explained by a highly specific kinetic hindrance for lithium deposition underneath the initial electrode surface film. It is induced by a smooth Li metal surface with a resistive interphase that consists of a native surface film of the untreated lithium metal electrode (the ‘Li substrate’) and the SEI formed spontaneously after immersion of lithium in the electrolyte. The related surface resistance Rsurface is observed in the EIS measurements.
Only after very little current flow, the overpotential is cut down immediately to around −0.1 V vs. Li/Li+ (at j = 0.1 mA cm−2), continues to decrease rapidly at first and then decreases slower and slower. This decrease of the overpotential during lithium deposition (region B) can be explained by deposition of new lithium on previously deposited lithium. The chemical composition of the SEI as well as a nonuniform morphology of the lithium electrode (e.g. sharp edges, cracks, and holes in nanometer to micrometer scale)18 lead to a nonuniform current distribution when an electric field is applied and thus locally preferred lithium deposition (and dissolution). As the surface film has limited flexibility, it can only accommodate a certain volume change due to lithium deposition (or dissolution) and breaks. After cracking the initial surface layer (native surface film plus largely formed SEI) the protruding tips of ‘fresh’ deposited lithium offer a stronger electrical field, a higher specific surface area and thus a higher interface area with the electrolyte and lower bulk and grain boundary resistances due to the broken native surface film and an incompletely formed and thus also chemically different surface film. Consequently, further lithium deposition concentrates on previously deposited lithium. The self-amplifying effect of heterogeneous lithium deposition is observed.
In the later cycles the negative overpotentials in region A are reduced to one order of magnitude lower values. This indicates a general decrease of the overall resistance vs. lithium deposition. The corresponding decrease of the surface resistances Rsurface is detected in EIS measurements (see Fig. 2 and Tables 1 and 2). It can be concluded that, whereas in the first cycles almost the whole Li electrode surface is smooth and covered by the initial surface film and a further formed SEI, the roughened parts of the electrode surface are observed where heterogeneous lithium deposition/dissolution took place before their growth. As a result, the overall surface resistance Rsurface and thus the initial overpotential of lithium deposition decrease. When the potential profile shape becomes constant, e.g. in cycle 300, the negative potential starts with a small drop and then increases slowly. Similar to region B this behaviour is assumed to refer to lithium deposition on parts of the Li electrode surface where not only subsequent heterogeneous lithium deposition but also dissolution has roughened the surface and changed the surface film (region G).
![[thin space (1/6-em)]](https://www.rsc.org/images/entities/char_2009.gif) :
:![[thin space (1/6-em)]](https://www.rsc.org/images/entities/char_2009.gif) 7) (EC/DEC), 1 M LiPF6 in EC/DMC (1
7) (EC/DEC), 1 M LiPF6 in EC/DMC (1![[thin space (1/6-em)]](https://www.rsc.org/images/entities/char_2009.gif) :
:![[thin space (1/6-em)]](https://www.rsc.org/images/entities/char_2009.gif) 1) (EC/DMC), 1 M LiPF6 in TEGDME (TEGDME), and 1 M LiTFSI in DMSO (DMSO) as electrolytes before and after x days under OCP conditions and after 50 and y lithium plating/stripping cycles at j = 0.1 mA cm−2 (x = 6 for EC/DEC, 4 for EC/DMC, 2 for TEGDME, 7 for DMSO; y = 370 for EC/DEC and EC/DMC, 230 for TEGDME, 210 for DMSO)
1) (EC/DMC), 1 M LiPF6 in TEGDME (TEGDME), and 1 M LiTFSI in DMSO (DMSO) as electrolytes before and after x days under OCP conditions and after 50 and y lithium plating/stripping cycles at j = 0.1 mA cm−2 (x = 6 for EC/DEC, 4 for EC/DMC, 2 for TEGDME, 7 for DMSO; y = 370 for EC/DEC and EC/DMC, 230 for TEGDME, 210 for DMSO)
| EC/DEC | EC/DMC | TEGDME | DMSO | |
|---|---|---|---|---|
| R electrolyte (OCP, 0 days)/Ω | 26 | 25 | 93 | 436 |
| R electrolyte (OCP, x days)/Ω | 28 | 18 | 101 | 344 |
| R electrolyte (50 cycles)/Ω | 33 | 31 | 195 | 235 |
| R electrolyte (y cycles)/Ω | 39 | 34 | 744 | 151 |
| R surface (OCP, 0 days)/Ω | 3255 | 3472 | 2217 | 1619 |
| R surface (OCP, x days)/Ω | 25![[thin space (1/6-em)]](https://www.rsc.org/images/entities/char_2009.gif) 089 089 |
10![[thin space (1/6-em)]](https://www.rsc.org/images/entities/char_2009.gif) 203 203 |
9173 | 4402 |
| R surface (50 cycles)/Ω | 760 | 765 | 450 | 2682 |
| R surface (y cycles)/Ω | 237 | 207 | 59![[thin space (1/6-em)]](https://www.rsc.org/images/entities/char_2009.gif) 698 698 |
3415 |
The overpotential region of the first lithium dissolution processes in Fig. 3a is divided into three parts. In the first part, it increases slightly (C) and in the second part it increases steeply until it reaches a maximum (D), whereas the third part shows a decrease of the overpotential (E). However, when the experiment starts with a lithium dissolution process as in the plating/stripping experiments with Li/Cu cells (compare Fig. 3 with the 1st cycle of Fig. 4), only the electrode behaviour indicated by the regions D and E is observed. The experiments with changing charge capacities of the Li WE (compare with Fig. 11a and b) indicate that the capacity of the preceding lithium deposition process correlates with the duration of the first region (C) of the following lithium dissolution process.
It can be concluded that region C of the dissolution overpotential profile is determined by the dissolution of ‘fresh’ deposited or roughened lithium, i.e. by Li with a high surface area and a not well-developed thin SEI. This at least partial re-dissolution of dendritic lithium was observed in previous publications18 and was regarded as a cause for the loss of contact of dendrites from the substrate and thus the formation of electrically isolated lithium.10,39,40
As the ‘fresh’ deposited or roughened lithium is still limited in amount in the first cycles, the rapid increase of the overpotential indicates the end of the corresponding dissolution process. Consequently, the high overpotentials (region D) are merely allocated to the dissolution of ‘old’ lithium underneath the initial surface film and the dissolution of the Li substrate which was previously covered by ‘fresh’ deposited lithium. During the first cycles the overpotentials of lithium dissolution in region D are high because the process primarily takes place on the pristine, thus smooth and low surface area Li substrate. The decrease of the overpotential in region D after several cycles confirms that the corresponding lithium dissolution increasingly takes place from an already roughened lithium surface.
Analogous to dendrite formation during lithium deposition lithium dissolution also changes the electrode surface morphology.18 The nonuniform current distribution leads to the formation of holes, which can even cause the breaking of the SEI. The corresponding increase in the electrode surface area and a simultaneous decrease of the surface layer resistance lead to a locally preferred, thus inhomogeneous lithium dissolution. As for Li deposition in region A, the decrease of the overpotential in region E indicates this process during Li dissolution. The already rough parts of the Li electrode surface are roughened further.
As the local roughness also makes these spots preferable for lithium deposition, it can be deduced that these areas grow during repeated lithium deposition and dissolution cycles. As a result, lithium dissolution increasingly takes place on the porous areas and thus the overpotentials in region D are declining continuously. Finally, when the overpotential profiles during lithium dissolution become constant, e.g. in cycle 300, region D completely disappears from the profile. As for region C, it can be concluded that from this time onward lithium dissolution predominantly takes place on the porous areas of the lithium electrode (region G).
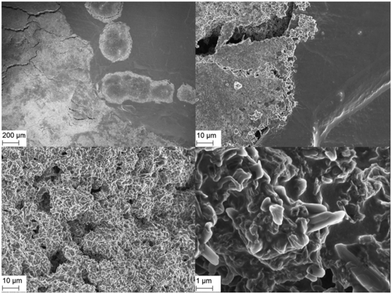
In order to verify the conclusions of this model, scanning electron micrographs (SEM) were taken from Li electrodes before/after 50 and 370 lithium plating/stripping cycles at j = 0.1 mA cm−2 in symmetrical Li/Li cells. Fig. 5 shows the Li WE surface after 370 cycles. The electrode surface is divided into locally bordered smooth and rough or rather dendritic areas. SEM analyses of the uncycled Li electrodes determine that the rough areas appear only after lithium plating/stripping cycles and the smooth areas correspond to the surface of the still uncycled Li. The local concentration and the clear borders of the rough areas confirm the conclusion of the strong preference of lithium dissolution and deposition processes on areas where these processes already took place.
For a more general understanding of the lithium deposition and dissolution behaviour on/of the Li metal anode in liquid electrolytes, these basic investigations were expanded to three further electrolytes: 1 M LiPF6 in EC/DMC (1![[thin space (1/6-em)]](https://www.rsc.org/images/entities/char_2009.gif) :
:![[thin space (1/6-em)]](https://www.rsc.org/images/entities/char_2009.gif) 1), 1 M LiPF6 in TEGDME, and 1 M LiTFSI in DMSO. During lithium plating/stripping experiments in Li/Li symmetrical cells several similarities between the electrolytes can be observed. Accordingly, the interpretation of the overpotential profiles in the EC/DEC-based electrolyte (Fig. 3) can be used as a reference. In comparison to this reference, the individual deviations of the other electrolytes are discussed in the following.
1), 1 M LiPF6 in TEGDME, and 1 M LiTFSI in DMSO. During lithium plating/stripping experiments in Li/Li symmetrical cells several similarities between the electrolytes can be observed. Accordingly, the interpretation of the overpotential profiles in the EC/DEC-based electrolyte (Fig. 3) can be used as a reference. In comparison to this reference, the individual deviations of the other electrolytes are discussed in the following.
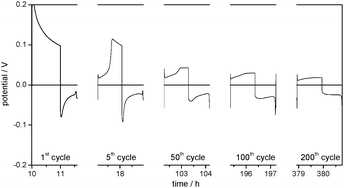
Fig. 6 shows the overpotential profiles of the lithium deposition and dissolution processes in 1 M LiPF6 in an EC/DMC (1![[thin space (1/6-em)]](https://www.rsc.org/images/entities/char_2009.gif) :
:![[thin space (1/6-em)]](https://www.rsc.org/images/entities/char_2009.gif) 1) electrolyte. These profiles, the development of the electrode surface resistances in EIS (Table 2) and the morphology of the Li electrodes before and after the plating/stripping cycles are analogous to the EC/DEC-based reference electrolyte and thus confirm the model.
1) electrolyte. These profiles, the development of the electrode surface resistances in EIS (Table 2) and the morphology of the Li electrodes before and after the plating/stripping cycles are analogous to the EC/DEC-based reference electrolyte and thus confirm the model.
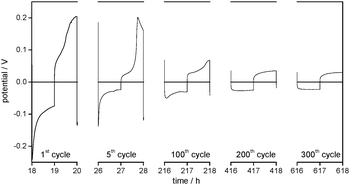 | ||
Fig. 6 Selected overpotential profiles of subsequent lithium plating/stripping processes on the WE in Li/Li cells with 1 M LiPF6 in EC/DMC (1![[thin space (1/6-em)]](https://www.rsc.org/images/entities/char_2009.gif) : :![[thin space (1/6-em)]](https://www.rsc.org/images/entities/char_2009.gif) 1) as the electrolyte at j = 0.1 mA cm−2. 1) as the electrolyte at j = 0.1 mA cm−2. | ||
For the Li WE in 1 M LiPF6 in TEGDME electrolyte (Fig. 7), the overpotential profiles and the general decrease of the potentials in the early cycles confirm the model as well. Different from the EC/DEC- and EC/DMC-based electrolytes, the SEM investigations show the formation of a surface film after only 50 cycles. However, under this film, the SEM images show locally separated rough and smooth areas on the Li electrode, and the EIS investigations (Table 2) also detect a decrease of the surface resistances Rsurface after 50 cycles.
So far, the processes on the Li electrode have shown the same behaviour as in the two investigated carbonate based electrolytes. However, after several hundred cycles the overpotentials of lithium deposition and dissolution in the TEGDME-based electrolyte increase exponentially until the experiment has to be stopped. This behaviour was found to be highly reproducible upon several repetitions of the experiment. It can be concluded that the strong increase of the cell resistance is caused by a large degradation of the electrolyte on the Li electrode.
The EIS measurements (Table 2) confirm an increase of the electrolyte resistance Relectrolyte (195 to 744 Ω) between the 50th and 230th cycle, and also show a dramatic increase of the surface resistance Rsurface (450 to 59![[thin space (1/6-em)]](https://www.rsc.org/images/entities/char_2009.gif) 698 Ω). It can be deduced that the increase of the overpotentials is primarily due to the formation of an insulating surface film, as the SEM investigations show a large growth of the surface layer between the 50th and 230th cycle.
698 Ω). It can be deduced that the increase of the overpotentials is primarily due to the formation of an insulating surface film, as the SEM investigations show a large growth of the surface layer between the 50th and 230th cycle.
The lithium plating/stripping experiments in the 1 M LiTFSI in DMSO electrolyte at j = 0.1 mA cm−2 reproducibly show a high fluctuation and noise of the absolute potential values (see forthcoming Fig. 9b) and the shape of the overpotential profiles. In addition, high resistances at the electrode surface Rsurface after 50 and 210 cycles are observed in EIS measurements (Table 2). The EIS investigations reveal the formation of a resistive surface film. Both observations can be explained by severe lithium corrosion/electrolyte decomposition during lithium deposition.
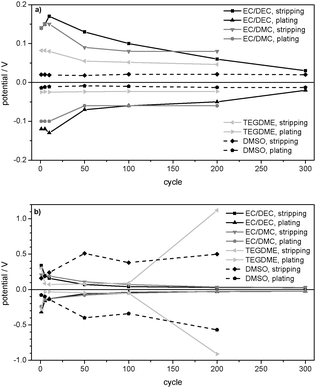
The lithium deposition and dissolution processes at the one order of magnitude lower current density of j = 0.01 mA cm−2 (Fig. 8) show low overpotentials of −10 up to −15 mV for the lithium deposition and between 18 and 22 mV for the lithium dissolution over 300 cycles, which stay almost constant during the whole experiment. Compared to the experiment at j = 0.1 mA cm−2, the overpotentials are reduced by more than a factor of 10 (compare Fig. 9a and b).
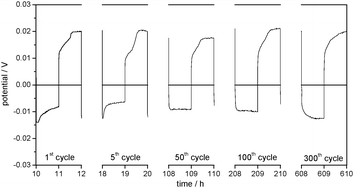 | ||
| Fig. 8 Selected overpotential profiles of subsequent lithium plating/stripping processes on the WE in Li/Li symmetrical cells with 1 M LiTFSI in DMSO as the electrolyte at j = 0.01 mA cm−2. | ||
Apparently, the surface resistance Rsurface has increased less and thus less electrolyte degradation takes place. This may be also explained by a lower amount of dendrites, which are more reactive with the electrolyte. Generally, it can be stated that the extent of degradation of DMSO and/or the LiTFSI salt on the Li electrode strongly depends on the current density.
The shape of the overpotential profiles in Fig. 8 shows the same development during cycling as discussed for the EC/DEC-based electrolyte in Fig. 3a and b. It can be concluded that lithium deposition and dissolution in 1 M LiTFSI in DMSO electrolyte at the lower current density of j = 0.01 mA cm−2 proceed with the same characteristics as described for the other electrolytes above.
Apart from the large extent of electrolyte decomposition and SEI film formation in the TEGDME- and DMSO-based electrolytes, the comparison of the results point at a self-enforcing heterogeneity of lithium deposition and dissolution according to the model in Fig. 3a and b in all investigated electrolytes.
The comparison of the maximum overpotentials in Fig. 9a and b shows that the behaviour of 1 M LiPF6 in EC/DEC (3![[thin space (1/6-em)]](https://www.rsc.org/images/entities/char_2009.gif) :
:![[thin space (1/6-em)]](https://www.rsc.org/images/entities/char_2009.gif) 7) and 1 M LiPF6 in EC/DMC (1
7) and 1 M LiPF6 in EC/DMC (1![[thin space (1/6-em)]](https://www.rsc.org/images/entities/char_2009.gif) :
:![[thin space (1/6-em)]](https://www.rsc.org/images/entities/char_2009.gif) 1) confirms the general model of an increase of the surface area and thus a general decrease of the overpotentials during cycling, whereas 1 M LiPF6 in TEGDME and 1 M LiTFSI in DMSO deviate at the current density of j = 0.1 mA cm−2. As deduced from the overpotential profiles and confirmed by EIS (Table 2) and SEM investigations, the deviations of the TEGDME- and DMSO-based electrolytes are due to the formation of thick, resistive surface layers stemming from excessive electrolyte decomposition. In 1 M LiPF6 in TEGDME, this effect occurs only after about 150 lithium plating/stripping cycles, whereas it appears during the whole cycling experiment in 1 M LiTFSI in DMSO electrolyte. As displayed in Table 2, the strong decrease of the overpotentials in the EC/DEC-, EC/DMC- and TEGDME-based electrolytes (during the first 150 cycles) is accompanied by a strong decrease of the lithium/electrolyte surface resistance Rsurface between Rsurface (OCP, 0 days) and Rsurface (50 cycles). SEM confirms the conclusion that this decrease is due to the formation of dendrites and thus an increase in the surface area. Concerning the deviations from the general model of the TEGDME- and DMSO-based electrolytes at j = 0.1 mA cm−2, Table 2 indicates a dramatic increase of Rsurface in 1 M LiPF6 in TEGDME between cycle no. 50 and cycle no. 230 due to the formation of a resistive surface layer. In contrast, a further decrease of Rsurface is observed in the EC/DEC- and EC/DMC-based electrolytes between 50 and 370 cycles. In 1 M LiTFSI in DMSO the surface resistance remains comparably constant during the lithium plating/stripping experiment at j = 0.1 mA cm−2.
1) confirms the general model of an increase of the surface area and thus a general decrease of the overpotentials during cycling, whereas 1 M LiPF6 in TEGDME and 1 M LiTFSI in DMSO deviate at the current density of j = 0.1 mA cm−2. As deduced from the overpotential profiles and confirmed by EIS (Table 2) and SEM investigations, the deviations of the TEGDME- and DMSO-based electrolytes are due to the formation of thick, resistive surface layers stemming from excessive electrolyte decomposition. In 1 M LiPF6 in TEGDME, this effect occurs only after about 150 lithium plating/stripping cycles, whereas it appears during the whole cycling experiment in 1 M LiTFSI in DMSO electrolyte. As displayed in Table 2, the strong decrease of the overpotentials in the EC/DEC-, EC/DMC- and TEGDME-based electrolytes (during the first 150 cycles) is accompanied by a strong decrease of the lithium/electrolyte surface resistance Rsurface between Rsurface (OCP, 0 days) and Rsurface (50 cycles). SEM confirms the conclusion that this decrease is due to the formation of dendrites and thus an increase in the surface area. Concerning the deviations from the general model of the TEGDME- and DMSO-based electrolytes at j = 0.1 mA cm−2, Table 2 indicates a dramatic increase of Rsurface in 1 M LiPF6 in TEGDME between cycle no. 50 and cycle no. 230 due to the formation of a resistive surface layer. In contrast, a further decrease of Rsurface is observed in the EC/DEC- and EC/DMC-based electrolytes between 50 and 370 cycles. In 1 M LiTFSI in DMSO the surface resistance remains comparably constant during the lithium plating/stripping experiment at j = 0.1 mA cm−2.
Table 2 displays the constant surface resistances Rsurface on/at the pristine Li electrodes under OCP conditions. Constant values of Rsurface were reached after x = 2 days in the TEGDME-based electrolyte, x = 4 days in the EC/DMC-based electrolyte, x = 6 days in the EC/DEC-based electrolyte and x = 7 days in the DMSO-based electrolyte. The EC/DEC- and EC/DMC-based electrolytes show very high surface resistances, whereas 1 M LiPF6 in TEGDME and 1 M LiTFSI in DMSO present lower values. The order of the surface resistances of the pristine Li electrode after cell assembly Rsurface (OCP, 0 days) as well as after reaching the constant surface resistance Rsurface (OCP, x days) corresponds to the following order of the maximum overpotentials in the first cycle at j = 0.01 mA cm−2 in Fig. 9a: EC/DEC-, EC/DMC-, TEGDME- and DMSO-based electrolyte. This analogy confirms the deduction that a large SEI resistance on the pristine Li electrode is directly connected to a high overpotential for lithium deposition and dissolution.
The strong increase of the overpotential due to severe electrolyte decomposition that was observed in the TEGDME- and DMSO-based electrolytes at j = 0.1 mA cm−2 (Fig. 9b) does not appear at a current density of j = 0.01 mA cm−2 (Fig. 9a). Hence, the TEGDME- and DMSO-based electrolytes also behave according to the reference model (Fig. 3a and b) at j = 0.01 mA cm−2.
The comparison of the maximum overpotentials of the lithium plating/stripping experiments at j = 0.01 mA cm−2 (Fig. 9a) and j = 0.1 mA cm−2 (Fig. 9b) confirms the well-known fact that a higher current density generally induces higher overpotentials. It is also observed that the rate of the overpotential decrease and thus the rate of dendrite formation correlate with the current density.
Besides the general decrease of the electrode surface resistance Rsurface during subsequent lithium plating/stripping cycles, EIS investigations (Table 2) indicate an increase of Rsurface under OCP conditions. As this increase is supposed to be due to the spontaneous formation of a resistive surface film, the SEI, further investigations were concentrated on the film development and properties.
Therefore, the passivation quality of the SEI and thus the rechargeability of the Li anode in the particular electrolytes were investigated in Li (WE)/Cu (CE) cells. Fig. 4 shows the potential of the Li WE in a Li/Cu cell. Besides the already discussed development of the overpotential profiles it can be observed that the duration and thus the capacity of the lithium deposition process on the Li electrode increase during repeated cycling. In these cells the Cu CE basically works as a substrate, on which lithium from the WE is deposited and then dissolved again. The overpotential drop at the end of each deposition process indicates that the lithium deposition process on the WE is limited by the amount of deposited lithium on the CE. The difference between the capacities of the deposition and dissolution processes therefore refers to the lithium loss due to electrolyte degradation/lithium corrosion during and after deposition of lithium on the Cu electrode and due to the loss of electronic contact to dendritic deposited lithium. The increasing capacity of the lithium re-deposition on the WE shows that the lithium loss on the CE is reduced. This indicates that a passivating and ion conducting film is formed on the deposited lithium, which remains mechanically intact on the Cu surface also when lithium is dissolved again.
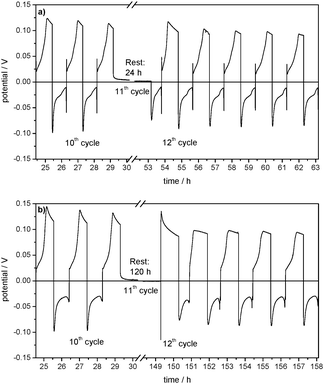
For further investigations of the passivation quality of this film, self-discharge experiments have been carried out. In these experiments lithium is deposited on a Cu CE and dissolved again after a rest time of 24 h or 120 h. The comparison of the Coulombic efficiency of this lithium deposition and dissolution cycle with deposition and dissolution cycles without a rest time shows how much active lithium is ‘lost’ during the rest time. The higher the loss of lithium in the rest time, the lower is the passivation quality of the SEI.
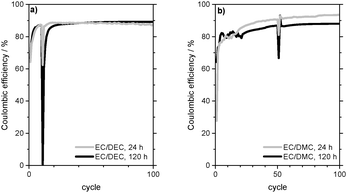
Fig. 10a presents the development of the charge capacity of the WE and the Coulombic efficiency of subsequent lithium deposition/dissolution on the Cu CE in 1 M LiPF6 in EC/DEC (3![[thin space (1/6-em)]](https://www.rsc.org/images/entities/char_2009.gif) :
:![[thin space (1/6-em)]](https://www.rsc.org/images/entities/char_2009.gif) 7) electrolyte. The Coulombic efficiency increases during the first cycles, which indicates the formation of a passivating film on the deposited lithium.
7) electrolyte. The Coulombic efficiency increases during the first cycles, which indicates the formation of a passivating film on the deposited lithium.
Furthermore, it can be deduced that this film (partly) remains on the Cu electrode when lithium is dissolved. A rest time of 24 h in the 11th cycle causes a drop in the Coulombic efficiency from 87% to 62% (Table 3). The resulting capacity loss due to self-discharge/further lithium corrosion during the rest time is 0.028 mA h. As the Coulombic efficiency of the following 12th cycle is again 86% and thus almost as high as before the rest time, it can be concluded that the passivation quality of the SEI basically remains the same during the rest time.
![[thin space (1/6-em)]](https://www.rsc.org/images/entities/char_2009.gif) :
:![[thin space (1/6-em)]](https://www.rsc.org/images/entities/char_2009.gif) 7), 1 M LiPF6 in EC/DMC (1
7), 1 M LiPF6 in EC/DMC (1![[thin space (1/6-em)]](https://www.rsc.org/images/entities/char_2009.gif) :
:![[thin space (1/6-em)]](https://www.rsc.org/images/entities/char_2009.gif) 1), 1 M LiPF6 in TEGDME and 1 M LiTFSI in DMSO after 50 and 100 lithium plating/stripping cycles (cyc.) at j = 0.1 mA cm−2 (for EC/DEC and EC/DMC) and j = 0.01 mA cm−2 (for TEGDME and DMSO) and after a rest time of 24 h and 120 h (rest time/self-discharge test in the 51st or * 11th cycle)
1), 1 M LiPF6 in TEGDME and 1 M LiTFSI in DMSO after 50 and 100 lithium plating/stripping cycles (cyc.) at j = 0.1 mA cm−2 (for EC/DEC and EC/DMC) and j = 0.01 mA cm−2 (for TEGDME and DMSO) and after a rest time of 24 h and 120 h (rest time/self-discharge test in the 51st or * 11th cycle)
| 50 cyc. | 100 cyc. | 200 cyc. | 24 h | 120 h | |
|---|---|---|---|---|---|
| EC/DEC | 88–89% | 88–89% | 88% | 62%* (−25%) | 0%* (−87%) |
| EC/DMC | 87–91% | 88–93% | 81% (−10%) | 67% (−26%) | |
| TEGDME | 43–51% | 43–54% | 53% | 12% (−30%) | — |
| DMSO | 20–33% | 28–63% | 55–82% | 0% (−33%) | — |
Also the overpotential profiles of the cycles before and after the rest time (Fig. 11a) indicate that the following 12th cycle only differs in the lithium dissolution process at the WE. This is due to the lower amount of lithium deposited on the WE after the rest time in the 11th cycle.
From Fig. 10a it can also be seen that the Coulombic efficiency drops from 87% to 0% between the 10th cycle and the 11th cycle, which includes 5 days of rest time (Table 3). This indicates a complete corrosion of the deposited lithium on the Cu CE during the rest time. The following 12th cycle shows a Coulombic efficiency of 60% and it takes another 8 cycles to reach 87%. As the Coulombic efficiencies and thus the overpotential profiles of lithium dissolution (Fig. 11b) after the self-discharge cycle are also similar to those of the SEI formation in the first cycles of the experiment (compare Fig. 4), it can be deduced that in contrast to the experiment with a rest time of 24 h the passivating film on the Cu foil is now lost during the rest time and has to be formed again.
Analogous to the experiments in the EC/DEC-based electrolyte, the passivating properties of the surface film formed by the other electrolytes were investigated (Table 3). These experiments were carried out at j = 0.1 mA cm−2 for 1 M LiPF6 in EC/DMC (1![[thin space (1/6-em)]](https://www.rsc.org/images/entities/char_2009.gif) :
:![[thin space (1/6-em)]](https://www.rsc.org/images/entities/char_2009.gif) 1) electrolyte (Fig. 10b) and at j = 0.01 mA cm−2 for 1 M LiPF6 in TEGDME and 1 M LiTFSI in DMSO electrolytes. Also in these electrolytes it can be observed that the Coulombic efficiencies increase continuously to a certain plateau during the first cycles. It can be concluded that the electrolyte decomposition compounds of these electrolytes also form a passivating film on the Cu electrode.
1) electrolyte (Fig. 10b) and at j = 0.01 mA cm−2 for 1 M LiPF6 in TEGDME and 1 M LiTFSI in DMSO electrolytes. Also in these electrolytes it can be observed that the Coulombic efficiencies increase continuously to a certain plateau during the first cycles. It can be concluded that the electrolyte decomposition compounds of these electrolytes also form a passivating film on the Cu electrode.
In these experiments, the passivation quality of the SEI in different electrolytes differs strongly (Table 3). The lithium plating/stripping experiments in Li/Cu cells with 1 M LiPF6 in EC/DEC (3![[thin space (1/6-em)]](https://www.rsc.org/images/entities/char_2009.gif) :
:![[thin space (1/6-em)]](https://www.rsc.org/images/entities/char_2009.gif) 7) and 1 M LiPF6 in EC/DMC (1
7) and 1 M LiPF6 in EC/DMC (1![[thin space (1/6-em)]](https://www.rsc.org/images/entities/char_2009.gif) :
:![[thin space (1/6-em)]](https://www.rsc.org/images/entities/char_2009.gif) 1) electrolytes show Coulombic efficiencies of 87–95%. Although these values are considerably higher than those observed for the TEGDME- and DMSO-based electrolytes (at j = 0.01 mA cm−2), they are not sufficient for a reasonable rechargeable operation of the lithium metal anode.
1) electrolytes show Coulombic efficiencies of 87–95%. Although these values are considerably higher than those observed for the TEGDME- and DMSO-based electrolytes (at j = 0.01 mA cm−2), they are not sufficient for a reasonable rechargeable operation of the lithium metal anode.
In 1 M LiTFSI in DMSO and 1 M LiPF6 in TEGDME electrolytes the large lithium corrosion prevents the formation of a passivating SEI at j = 0.1 mA cm−2. Even at the lower current density of j = 0.01 mA cm−2 these electrolytes show lower Coulombic efficiencies than the carbonate-based electrolytes at j = 0.1 mA cm−2.
At j = 0.01 mA cm−2 the lithium plating/stripping experiments in the TEGDME-based electrolyte show Coulombic efficiencies with high fluctuation and average values of only 43–57%, which indicate a poor passivation quality of the SEI. This is also confirmed by the comparably high capacity loss in the self-discharge experiment.
In the DMSO-based electrolyte Coulombic efficiencies between 55% and 82% are observed after ca. 200 cycles. Self-discharge experiments at various cycles show a complete loss of the deposited lithium by corrosion in only 24 h. Accordingly, the passivation quality of the SEI in the DMSO-based electrolyte is poorer than that of the TEGDME-based electrolyte (compare Table 3). A reasonable operation of both electrolytes in rechargeable batteries with a lithium metal anode is not possible, though the electrolytes have been proposed for lithium/air batteries.
From Table 3 it is also clear that the Coulombic efficiencies of the subsequent lithium deposition and dissolution on the Cu foil and the Coulombic efficiencies of the self-discharge experiments with rest times of 24 and 120 h are higher in 1 M LiPF6 in EC/DMC (1![[thin space (1/6-em)]](https://www.rsc.org/images/entities/char_2009.gif) :
:![[thin space (1/6-em)]](https://www.rsc.org/images/entities/char_2009.gif) 1) electrolyte than in 1 M LiPF6 in EC/DEC (3
1) electrolyte than in 1 M LiPF6 in EC/DEC (3![[thin space (1/6-em)]](https://www.rsc.org/images/entities/char_2009.gif) :
:![[thin space (1/6-em)]](https://www.rsc.org/images/entities/char_2009.gif) 7). In both electrolytes, the SEI cannot prevent continuous lithium corrosion and thus self-discharge occurs during the rest times. A comparison of the Coulombic efficiencies of the self-discharge experiments for 1 and 5 days in 1 M LiPF6 in the EC/DMC (1
7). In both electrolytes, the SEI cannot prevent continuous lithium corrosion and thus self-discharge occurs during the rest times. A comparison of the Coulombic efficiencies of the self-discharge experiments for 1 and 5 days in 1 M LiPF6 in the EC/DMC (1![[thin space (1/6-em)]](https://www.rsc.org/images/entities/char_2009.gif) :
:![[thin space (1/6-em)]](https://www.rsc.org/images/entities/char_2009.gif) 1) electrolyte shows that with a five times longer rest time, the additional capacity loss due to self-discharge is only doubled. The lithium corrosion reaction with the electrolyte is slowed down.
1) electrolyte shows that with a five times longer rest time, the additional capacity loss due to self-discharge is only doubled. The lithium corrosion reaction with the electrolyte is slowed down.
Experimental
The two carbonate-based standard electrolytes, 1 M LiPF6 in EC/DEC (3![[thin space (1/6-em)]](https://www.rsc.org/images/entities/char_2009.gif) :
:![[thin space (1/6-em)]](https://www.rsc.org/images/entities/char_2009.gif) 7) and 1 M LiPF6 in EC/DMC (1
7) and 1 M LiPF6 in EC/DMC (1![[thin space (1/6-em)]](https://www.rsc.org/images/entities/char_2009.gif) :
:![[thin space (1/6-em)]](https://www.rsc.org/images/entities/char_2009.gif) 1), were used as commercially available (UBE, battery grade 99.9%). The 1 M LiPF6 in TEGDME electrolyte was prepared from LiPF6 salt (Sigma-Aldrich, 99.9%) and TEGDME solvent (Acros Organics, extra pure 99.9%), and for preparation of 1 M LiTFSI in DMSO electrolyte LiTFSI salt (3 M, 99.9%) was dissolved in DMSO (Acros Organics, extra pure 99.9%). TEGDME and DMSO were dried using molecular sieves and LiTFSI was dried for 72 h at 110 °C in a Pfeiffer HiCube vacuum pump with an average vacuum of 10−7 mbar. LiPF6 was used as commercially available (Sigma-Aldrich, 99.9%).
1), were used as commercially available (UBE, battery grade 99.9%). The 1 M LiPF6 in TEGDME electrolyte was prepared from LiPF6 salt (Sigma-Aldrich, 99.9%) and TEGDME solvent (Acros Organics, extra pure 99.9%), and for preparation of 1 M LiTFSI in DMSO electrolyte LiTFSI salt (3 M, 99.9%) was dissolved in DMSO (Acros Organics, extra pure 99.9%). TEGDME and DMSO were dried using molecular sieves and LiTFSI was dried for 72 h at 110 °C in a Pfeiffer HiCube vacuum pump with an average vacuum of 10−7 mbar. LiPF6 was used as commercially available (Sigma-Aldrich, 99.9%).
The constant current cycling experiments and electrochemical impedance spectroscopy were performed in three-electrode Swagelok® cells containing a Li WE and a Li/Li+ RE in combination with a Li or Cu CE. The Li foil was used untreated as commercially available (Rockwood Lithium, 99.9%), whereas the Cu foil was washed with distilled water and ethanol and dried in a Büchi® B585 glass oven (24 h at 200 °C and below 3.0 × 10⁻² mbar). For the cells containing LiPF6 salt a stack of three separators was used: a polypropylene/polyethylene/poly-propylene (PP/PE/PP) Celgard® 2325 separator, a polypropylene (PP) Freudenberg® 2190 separator and again a PP/PE/PP Celgard® 2325 separator. For the DMSO-based electrolyte, the Freudenberg® separator was replaced by a glass fiber Whatman® separator (grade GF/D). The separators were dried in a Büchi® B585 glass oven at 50 °C (Celgard®), 90 °C (Freudenberg®) and 300 °C (Whatman®) in a vacuum below 3.0 × 10⁻² mbar for 18 hours.
Due to the great sensitivity of lithium metal and other components in the cell to air and moisture, an argon filled glove box (UNIlab by MBRAUN) with an average H2O and O2 content below 0.1 ppm was used for the storage of lithium, mixing and storage of the electrolytes, Swagelok® cell assembly and sample preparation for the SEM measurements.
The constant current cycling experiments were carried out in a dry oven (BINDER) at 20 °C using a MACCOR Series 4000 battery test system (MACCOR, INC.). In the experiments with Li/Li symmetrical cells a constant current density of j = 0.1 mA cm−2 or j = 0.01 mA cm−2 was applied for 1 hour for charging and the same time for discharging. The potential of the Li WE was detected against a Li/Li+ RE. The cut-off potential was set to +4 V vs. Li/Li+ for charge (deposition, plating) and −4 V vs. Li/Li+ for discharge (dissolution, stripping).
Also in the experiments in Li (WE)/Cu (CE) cells the potential of the WE was detected against a Li/Li+ RE. A constant current of j = 0.1 mA cm−2 or j = 0.01 mA cm−2 was applied for 1 hour for discharging the Li WE. For the dissolution of lithium deposited on the Cu CE the same current was applied until lithium was completely dissolved and the potential reached the cut-off condition. In the self-discharge experiments the cell rested in OCP conditions for 1 or 5 days after lithium was deposited on the Cu CE.
EIS was measured using a Solartron SI 1287 potentiostat in combination with a Solartron SI 1260 impedance/gain phase analyser. The spectra were detected between 1 mHz and 1 MHz with an amplitude of 5 mV. They were analysed using ZView Ver. 3.2b of Scribner Ass. Inc., and were interpreted by the equivalent circuit in Fig. 12. R1 corresponds to the Ohmic resistance of the electrolyte Relectrolyte. The sum of R2 and R3 refers to the semicircle shown in the Nyquist plots, which was interpreted as the ‘Li electrode surface resistance’ (Rsurface = R2 + R3) of both electrodes.
In order to investigate the surface of the Li electrodes, after the constant current cycling experiments the Swagelok® cells were disassembled. The sample electrodes were dried under vacuum and transferred to the scanning electron microscope in a sealed vessel. SEM was performed using an Auriga field emission (FE)-SEM Crossbeam Workstation of Carl Zeiss with an acceleration voltage of 3 kV.
Conclusions
The interpretation of the overpotentials of lithium deposition and dissolution on lithium metal allowed an in situ observation of different stages of these processes. By comparative investigations of several liquid electrolytes through constant current cycling experiments combined with EIS and SEM analyses, a detailed model of lithium deposition and dissolution processes has been proposed. In addition to the understanding so far, our model regards that the Li dissolution and deposition processes/mechanisms change during cycling, which can be clearly seen from development of overpotentials during cycling. Furthermore, mutual influences of SEI formation vs. heterogeneous lithium deposition and dissolution, and vice versa were identified.The evolved method opens a new perspective which allows a direct, fast and non-destructive analysis of the behaviour of the lithium metal anode in liquid electrolytes. It can be transmitted to other electrolytes and for battery systems using alternative metal anodes, such as sodium or magnesium.
Furthermore, the rate of lithium corrosion under open circuit conditions could be investigated.
Generally, it can be stated that charge and discharge of the lithium metal anode in 1 M LiPF6 in EC/DEC (3![[thin space (1/6-em)]](https://www.rsc.org/images/entities/char_2009.gif) :
:![[thin space (1/6-em)]](https://www.rsc.org/images/entities/char_2009.gif) 7), 1 M LiPF6 in EC/DMC (1
7), 1 M LiPF6 in EC/DMC (1![[thin space (1/6-em)]](https://www.rsc.org/images/entities/char_2009.gif) :
:![[thin space (1/6-em)]](https://www.rsc.org/images/entities/char_2009.gif) 1), 1 M LiPF6 in TEGDME or 1 M LiTFSI in DMSO electrolytes results in dendrite formation and electrolyte decomposition. The electrolytes show the formation of a SEI on lithium metal. By analysis of the Coulombic efficiencies in lithium plating/stripping and self-discharge experiments, it is witnessed that the Li electrode shows poor rechargeability in all investigated electrolytes. Especially the TEGDME- and DMSO-based electrolytes are not suitable for the operation with the rechargeable lithium metal anode at reasonable current densities.
1), 1 M LiPF6 in TEGDME or 1 M LiTFSI in DMSO electrolytes results in dendrite formation and electrolyte decomposition. The electrolytes show the formation of a SEI on lithium metal. By analysis of the Coulombic efficiencies in lithium plating/stripping and self-discharge experiments, it is witnessed that the Li electrode shows poor rechargeability in all investigated electrolytes. Especially the TEGDME- and DMSO-based electrolytes are not suitable for the operation with the rechargeable lithium metal anode at reasonable current densities.
Acknowledgements
The authors wish to thank the German Ministry of Education and Research (BMBF) for funding of this work through the project ‘MEET-HiEnD’ (03X4634A).Notes and references
- M. Winter, J. O. Besenhard, M. E. Spahr and P. Novák, Adv. Mater., 1998, 10, 725–763 CrossRef CAS.
- M. Winter, Z. Phys. Chem., 2009, 223, 1395–1406 CrossRef CAS.
- J. M. Tarascon and M. Armand, Nature, 2001, 414, 359–367 CrossRef CAS PubMed.
- C. O. Laoire, S. Mukerjee, K. M. Abraham, E. J. Plichta and M. A. Hendrickson, J. Phys. Chem. C, 2010, 114, 9178–9186 CAS.
- S. A. Freunberger, Y. Chen, Z. Peng, J. M. Griffin, L. J. Hardwick, F. Bardé, P. Novák and P. G. Bruce, J. Am. Chem. Soc., 2011, 133, 8040–8047 CrossRef CAS PubMed.
- R. Wagner, N. Preschitschek, S. Passerini, J. Leker and M. Winter, J. Appl. Electrochem., 2013, 43, 481–496 CrossRef CAS PubMed.
- C. Brissot, M. Rosso, J. N. Chazalviel and S. Lascaud, J. Power Sources, 1999, 81–82, 925–929 CrossRef CAS.
- J. O. Besenhard, M. W. Wagner, M. Winter, A. D. Jannakoudakis, P. D. Jannakoudakis and E. Theodoridou, J. Power Sources, 1993, 44, 413–420 CrossRef CAS.
- H. Schranzhofer, J. Bugajski, H. J. Santner, C. Korepp, K. C. Möller, J. O. Besenhard, M. Winter and W. Sitte, J. Power Sources, 2006, 153, 391–395 CrossRef CAS PubMed.
- K. Xu, Chem. Rev., 2004, 104, 4303–4418 CrossRef CAS.
- P. Verma, P. Maire and P. Novák, Electrochim. Acta, 2010, 55, 6332–6341 CrossRef CAS PubMed.
- E. Peled, D. Golodnitsky and G. Ardel, J. Electrochem. Soc., 1997, 144, L208–L210 CrossRef CAS PubMed.
- K. Kanamura, H. Tamura, S. Shiraishi and Z.-i. Takehara, J. Electroanal. Chem., 1995, 394, 49–62 CrossRef.
- E. Peled, J. Electrochem. Soc., 1979, 126, 2047–2051 CrossRef CAS PubMed.
- T. Schedlbauer, U. C. Rodehorst, C. Schreiner, H. J. Gores and M. Winter, Electrochim. Acta, 2013, 107, 26–32 CrossRef CAS PubMed.
- D. Aurbach, E. Zinigrad, Y. Cohen and H. Teller, Solid State Ionics, 2002, 148, 405–416 CrossRef CAS.
- J. B. Goodenough and Y. Kim, Chem. Mater., 2009, 22, 587–603 CrossRef.
- Y. S. Cohen, Y. Cohen and D. Aurbach, J. Phys. Chem. B, 2000, 104, 12282–12291 CrossRef CAS.
- K. Hayashi, Y. Nemoto, S.-i. Tobishima and J.-i. Yamaki, Electrochim. Acta, 1999, 44, 2337–2344 CrossRef CAS.
- X. Zhang, R. Kostecki, T. J. Richardson, J. K. Pugh and P. N. Ross, J. Electrochem. Soc., 2001, 148, A1341–A1345 CrossRef CAS PubMed.
- M. Egashira, H. Takahashi, S. Okada and J.-i. Yamaki, J. Power Sources, 2001, 92, 267–271 CrossRef CAS.
- V. S. Bryantsev and M. Blanco, J. Phys. Chem. Lett., 2011, 2, 379–383 CrossRef CAS.
- V. S. Bryantsev, V. Giordani, W. Walker, M. Blanco, S. Zecevic, K. Sasaki, J. Uddin, D. Addison and G. V. Chase, J. Phys. Chem. A, 2011, 115, 12399–12409 CrossRef CAS PubMed.
- S. E. Sloop, J. K. Pugh, S. Wang, J. Kerr and K. Kinoshita, Electrochem. Solid-State Lett., 2001, 4, A42–A44 CrossRef CAS PubMed.
- X. Sun, H. Lee, X.-Q. Yang and J. McBreen, Electrochem. Solid-State Lett., 2002, 5, A248–A251 CrossRef CAS PubMed.
- B. D. McCloskey, R. Scheffler, A. Speidel, D. S. Bethune, R. M. Shelby and A. C. Luntz, J. Am. Chem. Soc., 2011, 133, 18038–18041 CrossRef CAS PubMed.
- C. Laoire, S. Mukerjee, E. J. Plichta, M. A. Hendrickson and K. Abraham, J. Electrochem. Soc., 2011, 158, A302–A308 CrossRef CAS PubMed.
- H.-G. Jung, J. Hassoun, J.-B. Park, Y.-K. Sun and B. Scrosati, Nat. Chem., 2012, 4, 579–585 CrossRef CAS PubMed.
- D. Xu, Z.-l. Wang, J.-j. Xu, L.-l. Zhang and X.-b. Zhang, Chem. Commun., 2012, 48, 6948–6950 RSC.
- D. Aurbach and E. Granot, Electrochim. Acta, 1997, 42, 697–718 CrossRef CAS.
- D.-J. Lee, J. Hassoun, S. Panero, Y.-K. Sun and B. Scrosati, Electrochem. Commun., 2012, 14, 43–46 CrossRef CAS PubMed.
- R. Black, S. H. Oh, J.-H. Lee, T. Yim, B. Adams and L. F. Nazar, J. Am. Chem. Soc., 2012, 134, 2902–2905 CrossRef CAS PubMed.
- K. Yoshida, M. Nakamura, Y. Kazue, N. Tachikawa, S. Tsuzuki, S. Seki, K. Dokko and M. Watanabe, J. Am. Chem. Soc., 2011, 133, 13121–13129 CrossRef CAS PubMed.
- S. S. Zhang and T. R. Jow, J. Power Sources, 2002, 109, 458–464 CrossRef CAS.
- K. Tasaki, A. Goldberg and M. Winter, Electrochim. Acta, 2011, 56, 10424–10435 CrossRef CAS PubMed.
- K. C. Möller, T. Hodal, W. K. Appel, M. Winter and J. O. Besenhard, J. Power Sources, 2001, 97–98, 595–597 CrossRef.
- S. Jankowsky, M. M. Hiller, R. Stolina and H. D. Wiemhöfer, J. Power Sources, 2015, 273, 574–579 CrossRef CAS PubMed.
- E. Barsoukov and J. R. Macdonald, Impedance Spectroscopy: Theory, Experiment, and Applications, John Wiley & Sons, 2005 Search PubMed.
- K. Naoi, M. Mori and Y. Shinagawa, J. Electrochem. Soc., 1996, 143, 2517–2522 CrossRef CAS PubMed.
- I. Yoshimatsu, T. Hirai and J. I. Yamaki, J. Electrochem. Soc., 1988, 135, 2422–2427 CrossRef CAS PubMed.
| This journal is © the Owner Societies 2015 |

