
 Open Access Article
 This Open Access Article is licensed under a
 Creative Commons Attribution 3.0 Unported Licence
Eu3+ and Tb3+ doped LaPO4 nanorods, modified with a luminescent organic compound, exhibiting tunable multicolour emission†
Marcin
Runowski
a,
Tomasz
Grzyb
a,
Anna
Zep
b,
Paulina
Krzyczkowska
b,
Ewa
Gorecka
b,
Michael
Giersig
ac and
Stefan
Lis
*a
aAdam Mickiewicz University, Faculty of Chemistry, Umultowska 89b, 61-614 Poznań, Poland. E-mail: blis@amu.edu.pl
bUniversity of Warsaw, Faculty of Chemistry, Laboratory of Physical Chemistry of Dielectrics and Magnetics, Żwirki i Wigury 101, 02-089 Warszawa, Poland
cFreie Universität Berlin, Institute of Experimental Physics, Arnimallee 14, 14195 Berlin, Germany
First published on 12th September 2014
Abstract
Co-precipitation reaction followed by hydrothermal treatment were used to synthesise Eu3+ or Tb3+ doped LaPO4 nanorods, of 5–10 nm in width and 50–100 nm in length. Surface modification of the as-prepared nanoparticles with a selected luminescent organic compound resulted in formation of hybrid inorganic–organic nanomaterials. The products obtained exhibited tunable multicolour luminescence, dependent on the surface modification and applied excitation wavelength. The colour of their emission can be altered from red-orange to yellow-green. Powder X-ray diffraction (XRD), high resolution transmission electron microscopy (HRTEM) and scanning transmission electron microscopy (STEM) confirmed the structure and morphology of the products synthesized. Successful surface modification of the nanophosphors was evidenced by analytical and spectroscopic techniques such as dynamic light scattering (DLS) – providing size distribution histograms and zeta potentials of the nanoparticles; IR spectroscopy and elemental analysis which proved the presence of an organic phase in the structure; spectrofluorometry (excitation/emission spectra and luminescence decay curves) which confirmed the formation of hybrid, surface modified nanomaterials revealing tunable multicolour emission.
1. Introduction
Luminescent nanomaterials based on lanthanide ions (Ln3+) have fascinated researchers for over the last two decades.1–5 The spectroscopic properties of Ln3+ ions are unique among the other elements, which result from their electronic configuration [Xe]4fn (n = 0–14). 4f orbitals of lanthanide ions are shielded by 5p and 6s shells, which makes the 4f–4f electronic transitions nearly insensitive to the coordination environment of Ln3+ ion, and provides narrow spectral width of emission or absorption bands as well as long-lived luminescence.6 The parity-forbidden character of the 4f–4f transitions results in a very low molar absorption coefficients and also low efficiencies of Ln3+ emission, when the direct excitation of 4f–4f absorption bands is applied. However, some Ln3+ ions, like Tb3+ and Ce3+, can be effectively excited via the allowed 4f–5d transitions, which strongly enhances the luminescence efficiency.7 Also the other, partially allowed processes like charge transfer (CT) observed in O2− containing host materials and energy transfer (ET), can increase absorption of the excitation light and therefore luminescence intensity.8,9 These specific properties of Ln3+ ions allow the design of nanomaterials revealing effective luminescence by applying ET and CT phenomena (indirect excitation). Much effort has been made to study ET between, e.g.: Ce3+ and Tb3+, Gd3+ and Eu3+ or in up-converting systems: Yb3+ and Er3+, Yb3+ and Tb3+.10–13 Also ET from the host or ligand to Ln3+ ion has been extensively investigated.14 The emission bands of Ln3+ ions can be observed in the ultraviolet, visible and near infrared ranges.The high potential of Ln3+-doped nanomaterials is used in many different applications like lighting, phosphors production, organic light emitting diodes (OLEDs and LEDs), lasers, optical amplifiers or waveguides and such areas like medicine and biology.4,15–19 Some of these applications result from the strong interest in Ln3+-doped hybrid inorganic–organic materials.20–22 In general, hybrid materials have altered properties that can be tailored according to the needs, e.g. they can show increased mechanical resistance, thermal stability, luminescence efficiency etc.23–25 Also the multifunctionality and the possibility to modulate their properties are important factors increasing development of such hybrid materials.26–31 Such sophisticated bi- or multifunctional hybrid/composite nanomaterials can exhibit simultaneously different desired properties like luminescence and magnetism, which are crucial for development of advanced bioimaging, drug delivery, luminescence tracing, document protection etc.28,29,32,33 One of the areas most recently studied is surface modification of nanocrystals (NCs). Significantly increased stability of colloids, lowered cytotoxicity of NCs and their higher biocompatibility, possibility of NCs use as drug carriers, production of biological sensors and detectors are only a few examples of the numerous applications that result from the inorganic–organic characteristics of hybrid nanomaterials.20,34–36
In this study we report the preparation of hybrid inorganic–organic nanomaterials based on LaPO4 nanorods doped with Tb3+ or Eu3+ ions, having organically modified surface. Our aim was to synthesize the nanomaterials exhibiting tunable luminescence dependent on the excitation wavelength used and study their photophysical properties. Such nanocomposites exhibit bright, multicolour luminescence originating from inorganic and organic components. They can be applied as advanced phosphors, luminescence tracers, biomarkers, etc. What is more, nanomaterials based on lanthanide phosphates reveal low cytotoxicity,24 and the use of functional organic compound as a surface modifier can alter the surface properties of the nanostructures modified and extend the range of their potential applications.
2. Experimental section
2.1. Materials
Eu2O3, Tb4O7 and La2O3 (Stanford Materials, 99.99%) were separately dissolved in a concentrated HNO3 (POCh S.A., ultra-pure) to obtain Eu(NO3)3, Tb(NO3)3 and La(NO3)3 aqueous solutions, respectively. Ammonium phosphate monobasic NH4H2PO4 (Sigma-Aldrich, ReagentPlus®, ≥98.5%) was used as a source of phosphate ions. Polyethylene glycol (PEG) 6000 (Alfa Aesar, 98%) was used as a surfactant. The synthetic procedure leading to 2,3-di(3,4-dioctyloxyphenyl)-quinoxaline-6-carboxylic acid starts with the preparation of the appropriate ketone – 3,3,4,4-tetraoctyloxydibenzoyl, which has already been described in literature.37 From this ketone and 3,4-diaminobenzoic acid, final compound was prepared according to the method described by E. J. Foster38,39 and H.-J. Chen.40 In all experiments, ultra-pure distilled water and absolute ethanol were used.2.2. Synthesis of nanophosphors – LaPO4:Ln3+ 10% (Ln3+ = Eu3+ or Tb3+)
The typical synthesis was carried out to get 1.5 g of the final product. The co-precipitation reaction was performed in ambient conditions, using a hot-plate magnetic stirrer. The initial pH of the prepared RE(NO3)3 solutions was around 5. Solution A: La(NO3)3 (11.62 mL, 0.494 M) and Eu(NO3)3 (1.52 mL, 0.419 M) were mixed together at 9/1 molar ratio, and filled with water up to 75 mL. 50 mL of ethanol was added to the as-prepared solution. Subsequently, 0.75 g of PEG was dissolved in this solution. Solution B: 25% molar excess of NH4H2PO4 was dissolved in the same solvent systems, with addition of the same amount of PEG. The as-prepared solution B was added dropwise to solution A during 20 minutes. Afterwards the obtained white precipitate was centrifuged and washed with water and ethanol several times. To get well-crystallised nanomaterial, the as-prepared product was dispersed in 70 mL of water, transferred into a Teflon lined vessel and treated under hydrothermal conditions for 120 minutes at 200 °C and 40 bar (microwave autoclave – ERTEC, Magnum II, 600 W). When the reaction was complete, the purification procedure was repeated. The final product was dried under vacuum overnight. Tb3+ doped product was prepared in the same way, using Tb(NO3)3 instead of Eu(NO3)3.2.3. Surface modification of nanorods
The following organic compound was selected as an exemplary surface modifier because of its complex character, presence of functional groups allowing further chemical modification, potential liquid crystal properties and intensive luminescence.41 5 mg of 2,3-di(3,4-dioctyloxyphenyl)-quinoxaline-6-carboxylic acid (C53H78N2O6 – for the reader's convenience the simple abbreviation the “organic” will be used throughout the article) dissolved in 10 mL of THF was added slowly to a stirred suspension of nanorods (50 mg) in 25 mL of THF. The reaction mixture was stirred at room temperature for further 72 h and the obtained yellow precipitate was then centrifuged (5 min, 13![[thin space (1/6-em)]](https://www.rsc.org/images/entities/char_2009.gif) 000 rpm). In the next step, pure THF was added to the nanomaterial. Afterwards, the mixture was sonicated for 60 s and then centrifuged once more (5 min, 13000 rpm). The procedure was repeated until no trace of excess of the organic compound was found as determined by TLC. The final, hybrid nanomaterials (yellow powders), revealed tunable multicolour luminescence originating from both inorganic and organic components. Here is worth noting, that there was no observed release of the organic compound from the nanoparticles surface, after washing the product in water. Only a long sonication and washing with THF or toluene caused a slow release of the organic compound. Fig. 1 illustrates a scheme of the nanomaterials surface modification.
000 rpm). In the next step, pure THF was added to the nanomaterial. Afterwards, the mixture was sonicated for 60 s and then centrifuged once more (5 min, 13000 rpm). The procedure was repeated until no trace of excess of the organic compound was found as determined by TLC. The final, hybrid nanomaterials (yellow powders), revealed tunable multicolour luminescence originating from both inorganic and organic components. Here is worth noting, that there was no observed release of the organic compound from the nanoparticles surface, after washing the product in water. Only a long sonication and washing with THF or toluene caused a slow release of the organic compound. Fig. 1 illustrates a scheme of the nanomaterials surface modification.
 | ||
| Fig. 1 Scheme of organic surface modification of LaPO4:Ln3+ 10% nanoparticles. | ||
2.4. Characterization
Electron microscopy measurements were carried out using transmission electron microscope-TEM Zeiss LIBRA 200FE, operating at 200 kV. Powder XRD (X-ray diffractograms) were recorded on a Bruker AXS D8 Advance diffractometer, using Cu Kα radiation (λ = 1.5406 Å). The elemental analysis of the products was performed using an Elementar Analyser Vario EL III. Setaram Setsys 1200 device, was used for simultaneous thermogravimetric-differential thermal analysis (TG-DTA), with a heating rate of 5 °C min−1 in air. IR spectra were recorded on FT-IR spectrophotometer, JASCO 4200. The IR spectra were measured in transmission mode, the samples were mixed with KBr, ground and pressed forming transparent discs. The particle size distribution (hydrodynamic diameter) and zeta (ζ) potential of the nanomaterials synthesized were recorded on Malvern Zetasizer Nano ZS, equipped with dynamic light scattering (DLS) module (He–Ne laser 633 nm, max 4 mW). Before measurements each product was dispersed in MiliQ quality water, forming stable aqueous colloid (0.1 mg mL−1). The excitation/emission spectra and luminescence decay curves of the dried products were measured in ambient conditions, using a Hitachi F-7000 spectrofluorometer. All spectra were appropriately corrected for the apparatus response.3. Results and discussion
3.1. Structure and morphology
The recorded powder XRD patterns of LaPO4:Tb3+ 10% and LaPO4:Eu3+ 10% were compared with the pattern from ICDD (International Centre for Diffraction Data) standards database (Fig. 2). Both diffractograms are similar and fit well to that of the hexagonal, hydrated lanthanum phosphate, LaPO4·0.5H2O (ICDD 000-046-1439). However, the diffractograms reveal also some very small reflexes (overlapping with the background noise), which are probably related to the monoclinic phase (monazite). The obtained XRD patterns exhibit broadened reflexes, which indicate the nanocrystallinity of the products synthesized, and at some extent, it can be due to the superposition of reflexes of hexagonal and monoclinic phase.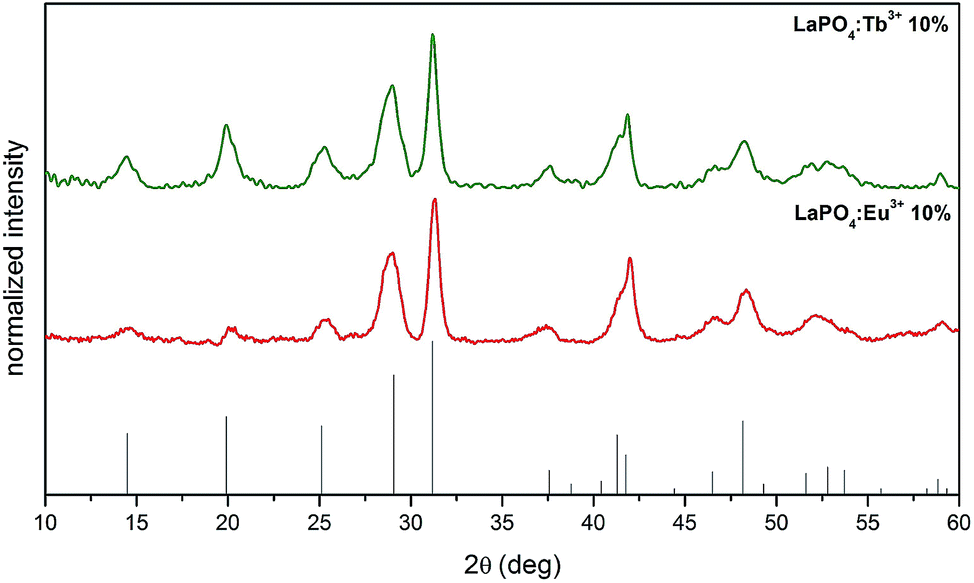 | ||
| Fig. 2 XRD patterns of LaPO4:Eu3+ 10% (0.5H2O) and LaPO4:Tb3+ 10% (0.5H2O). | ||
Fig. 3 presents electron microscope images of the nanomaterials synthesized. TEM images of LaPO4:Eu3+ 10% (a) and LaPO4:Tb3+ 10% (b), HR-TEM image of LaPO4:Eu3+ 10% including FFT (Fast Fourier Transform) inset (c), STEM image of LaPO4:Eu3+ 10%. TEM images (a and b) reveal numerous phosphate nanorods similar in shape. The nanorods synthesized are of 5–10 nm in width and 50–100 nm in length, revealing high aspect ratio. The presented HRTEM image of LaPO4:Eu3+ 10% (c) shows its interplanar distances, namely 0.35 nm (110) and 0.31 nm (200). The observed orientation of the planes and their calculated interplanar distances are consistent with FFT (Fig. 3c inset) of HR-TEM image and XRD analysis. The characteristic hexagonal pattern of the performed FFT undoubtedly confirms the crystal structure of the product obtained. The STEM image provides additional information about the LaPO4:Eu3+ 10% morphology (d), confirming the elongated shape of the synthesized nanoparticles.
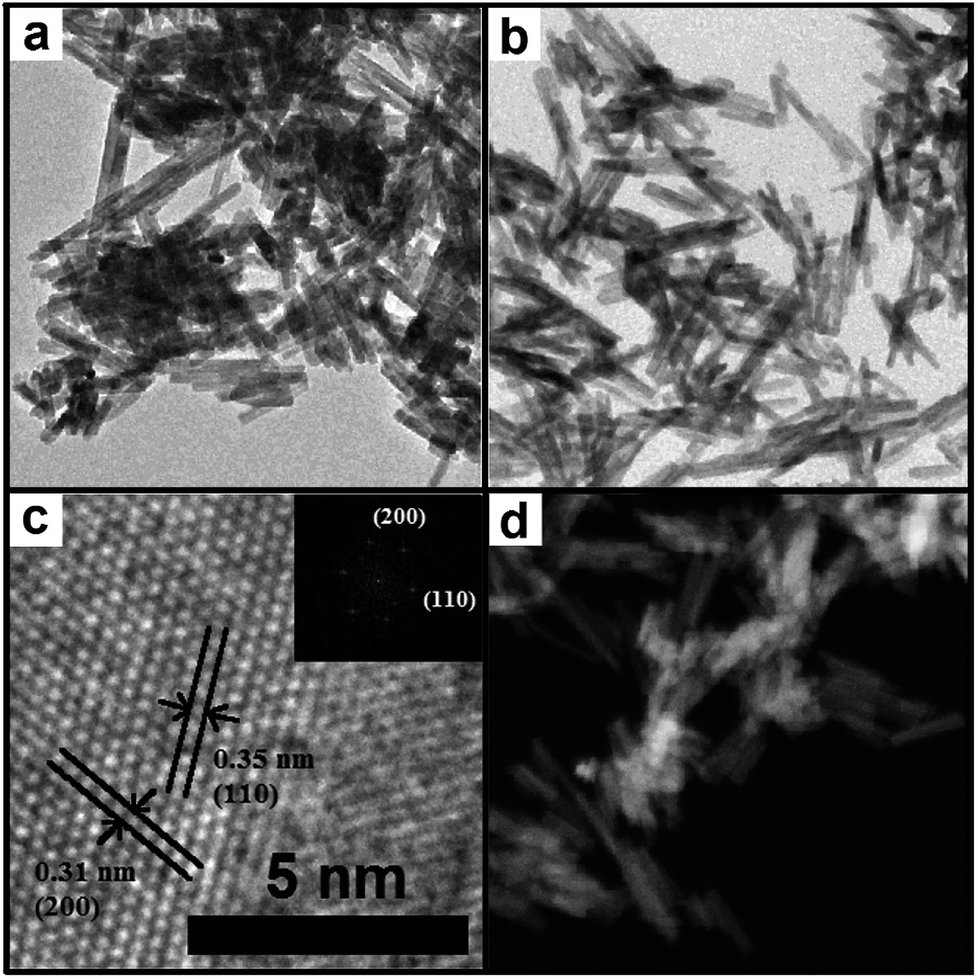 | ||
| Fig. 3 TEM images of LaPO4:Eu3+ 10% (a), LaPO4:Tb3+ 10% (b); HR-TEM image and its FFT inset for LaPO4:Eu3+ 10% (c); STEM image of LaPO4:Eu3+ 10% (d). | ||
In order to determine the amount of organic modifiers in the nanomaterials obtained, the elemental analysis of LaPO4:Eu3+ 10%, LaPO4:Tb3+ 10%, LaPO4:Eu3+ 10%@organic and LaPO4:Tb3+ 10%@organic was performed. For LaPO4:Eu3+ 10% product, the content of N, C, H was 0.004, 0.157 and 0.732 (wt%), respectively, whereas for LaPO4:Tb3+ 10% product, the corresponding contents were 0.005, 0.155 and 0.746 (wt%), respectively. In the products modified with the organic compound (C53H78N2O6), the contents of N, C, H for LaPO4:Eu3+ 10%@organic was 0.085, 2.267 and 0.942 (wt%), respectively, whereas for LaPO4:Tb3+ 10%@organic product, the values obtained were 0.087, 2.249 and 0.955 (wt%), respectively. On the basis of the results, the molar concentration of the organic compound bound to the surface is 0.0332 mmol (2.79 wt%) and 0.0329 mmol (2.76 wt%) per one gram of LaPO4:Eu3+ 10%@organic and LaPO4:Tb3+ 10%@organic products, respectively. The results presented confirm a successful functionalization of the nanomaterials surface. The excessive hydrogen content in their structure was related to the adsorbed water molecules.
Additionally, TG-DTA measurements were performed to investigate the stability of the organic surface layer and confirm the composition of the nanomaterials synthesized. The results obtained agree well with the elemental analysis data, and they are presented in full in ESI (Fig. S1†).
Fig. 4 illustrates the IR spectra of LaPO4:Eu3+ 10%, LaPO4:Tb3+ 10%, LaPO4:Eu3+ 10%@organic, LaPO4:Tb3+ 10%@organic, and pure organic compound. All spectra recorded reveal broad absorption peaks around 3400 cm−1 and 1640 cm−1, corresponding to the O–H stretching (ν) and deformation (σ) vibrations, respectively. The observed O–H bonds correspond to water molecules adsorbed on the nanorods surface and structural water molecules (hydration of phosphates). The absorption peaks around 2924 and 2865 cm−1 are related to νC–H vibrations of –CH2 groups of organic compound molecules (adsorbed on the surface of phosphate nanorods). The spectra of the pure and modified phosphates exhibit very intensive and broad peaks assigned to the vibrations of phosphate groups. The peaks around 1050, 950 cm−1 were assigned to the stretching vibrations within PO4 groups, and around 615, 542 cm−1 to the bending vibrations within these groups.42,43 What is more, the quite intensive band observed at ∼960 cm−1 confirms the coexistence of monoclinic phosphate (minor phase) together with the hexagonal lanthanum phosphate (major phase), which was mentioned during discussion of the XRD patterns. The peaks below 1700 cm−1 in the spectrum of the pure organic compound, correspond to the vibrations of numerous bonds in the very complex structure of this compound. The presence of peaks around 2900 and 1200 cm−1 in the spectra of the organically modified phosphates (LaPO4:Eu3+ 10%@organic and LaPO4:Tb3+ 10%@organic), confirms their successful modification with the organic compound used.
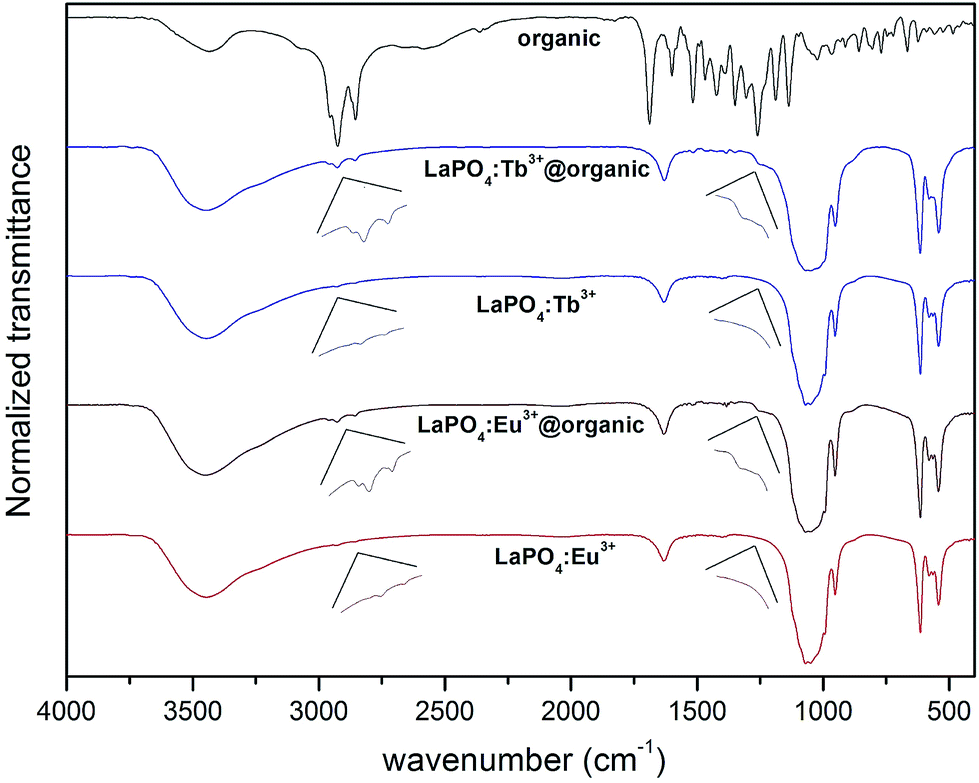 | ||
| Fig. 4 IR spectra of pure organic compound (surface modifier), unmodified LaPO4:Eu3+ 10% and LaPO4:Tb3+ 10%, surface modified LaPO4:Eu3+ 10%@organic and LaPO4:Tb3+ 10%@organic. | ||
The ζ-potential and average particle size distribution of the nanomaterials synthesized were measured by the DLS method. All of the measurement were carried out at pH = 7. The ζ-potential recorded for LaPO4:Eu3+ 10% was +29.3 mV, and for LaPO4:Tb3+ 10% it was +34.6 mV. The ζ-potential recorded for the surface modified LaPO4:Eu3+ 10%@organic and LaPO4:Tb3+ 10%@organic nanorods decreased to +17.8 mV and +27.3 mV, respectively. The decreased ζ-potential values confirmed surface modification of the nanomaterials synthesized. What is more, all of the nanomaterials exhibited relatively high surface charge, additionally confirming their stability at neutral pH, which is important in potential bioapplications. The average particle size distribution of the products synthesized is presented in Fig. 5. The approximate sizes of LaPO4:Eu3+ 10% (a) and LaPO4:Tb3+ 10% (b) particles are about 300 nm, and increase after surface modification for LaPO4:Eu3+ 10%@organic (c) and LaPO4:Tb3+ 10%@organic (d) to about 500 nm. This fact clearly confirms surface alterations of the nanomaterials modified, manifested by increased hydrodynamic diameter of the nanoparticles. However, the recorded DLS curves revealed the polydispersity of the nanomaterials obtained, which was caused by particles agglomeration and their “sticking” to bigger clusters after surface modification. The hydrodynamic radius/diameter of the particles analysed is usually larger in comparison to the real particle sizes from TEM data, since the DLS method takes into account surface solvation of the particles, and their agglomeration/aggregation in the colloidal solution. One must remember, that the data presented are onlya rough approximation of the nanoparticles sizes because of their highly anisotropic shape (DLS size measurements assume the spherical shape of the analysed objects).
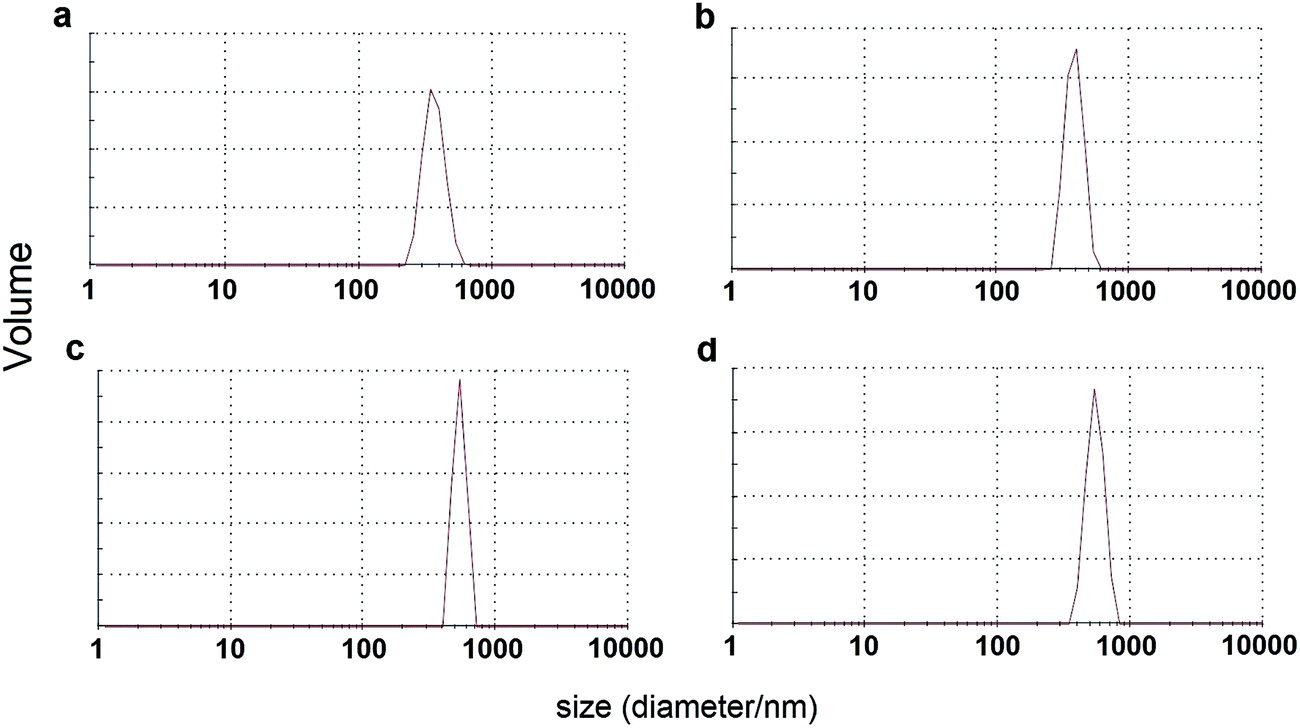 | ||
| Fig. 5 Particle size distribution for LaPO4:Eu3+ 10% (a) and LaPO4:Tb3+ 10% (b) LaPO4:Eu3+ 10%@organic (c) and LaPO4:Tb3+ 10%@organic (d), measured by DLS method. | ||
3.2. Luminescent properties
Fig. 6–8 show the spectroscopic properties of Eu3+ and Tb3+ doped phosphate nanorods and the corresponding surface modified products, namely LaPO4:Eu3+ 10%@organic and LaPO4:Tb3+ 10%@organic. All spectra were recorded for solid products (dried powders). Fig. 6a presents three excitation spectra of LaPO4:Eu3+10% (λem = 620 nm) and LaPO4:Eu3+ 10%@organic (λem = 500, 620 nm). For bare LaPO4:Eu3+ 10% (λem = 620 nm – the maximum of 5D0 → 7F2 transition in Eu3+ ion), a dominant broad band centred at 256 nm related to O2− → Eu3+ charge transfer (CT) transition can be observed. This band is the most intensive one in the whole spectrum because the mentioned CT transition is allowed by selection rules, in contrast to the forbidden 4f–4f transitions within Eu3+ ion (the series of narrow bands observed at 300–400 nm). For the surface modified LaPO4:Eu3+ 10%@organic nanomaterial, the same dominant band can be observed (λem = 620 nm). The series of intrinsic 4f–4f transitions is hardly visible in this spectrum, because they overlap with the appearing absorption band of the organic surface modifier. The third plot obtained for the same modified nanomaterial, whose excitation spectrum was recorded at λem = 500 nm (the maximum of emission band for the organic compound) does not reveal the characteristic bands related to the transitions in Eu3+ ions. In this spectrum only a very broad absorption band centred at 282 nm corresponding to the surface organic compound can be observed in the whole presented wavelength range.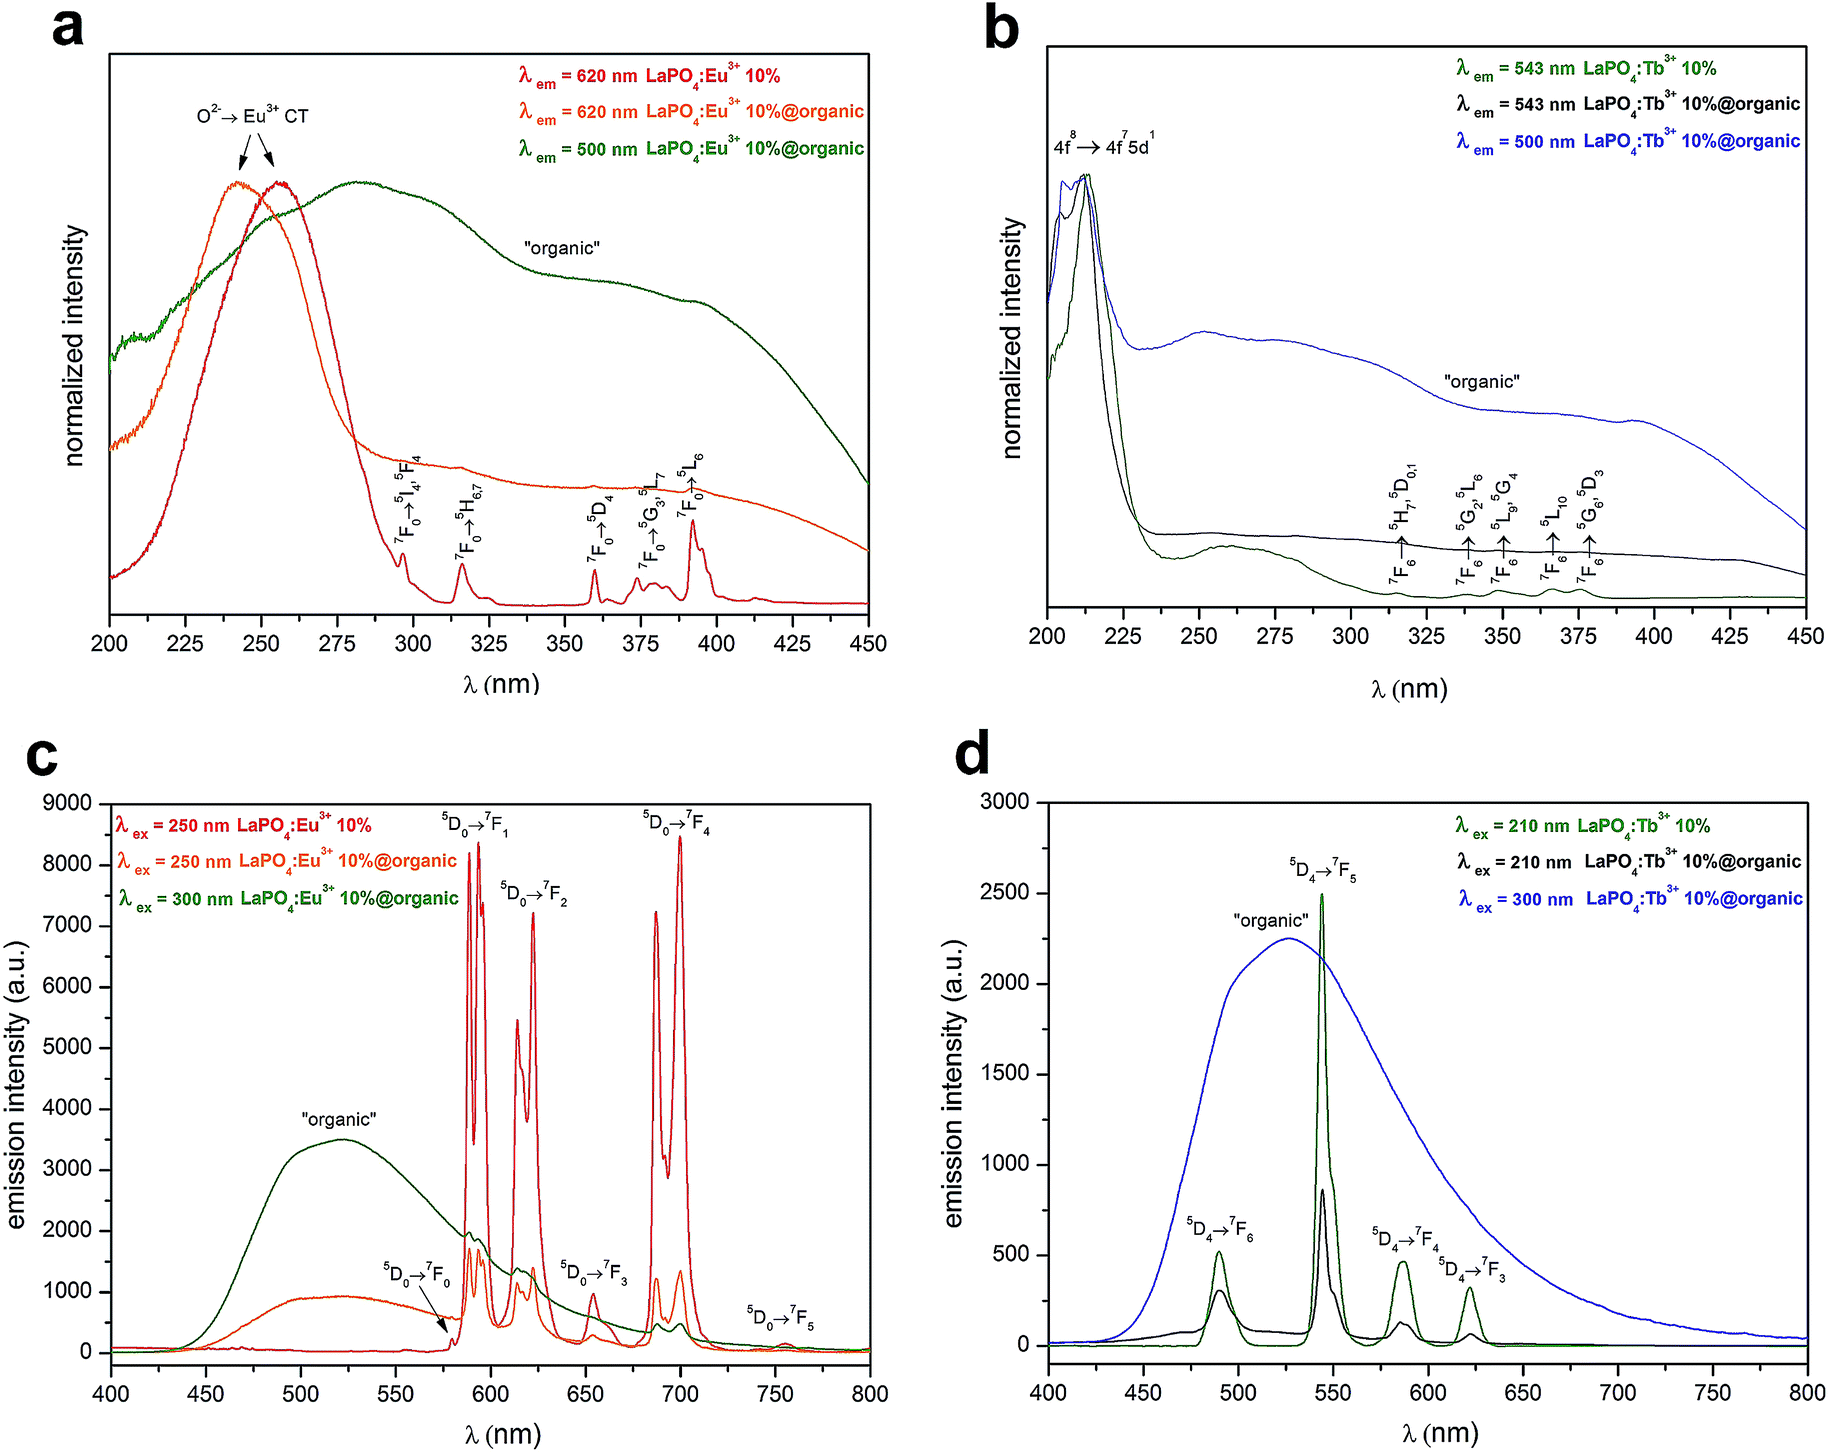 | ||
| Fig. 6 Excitation spectra of LaPO4:Eu3+ 10%, LaPO4:Eu3+ 10%@organic (a) and LaPO4:Tb3+ 10%, LaPO4:Tb3+ 10%@organic (b); emission spectra of LaPO4:Eu3+ 10%, LaPO4:Eu3+ 10%@organic (c) and LaPO4:Tb3+ 10%, LaPO4:Tb3+ 10%@organic (d). | ||
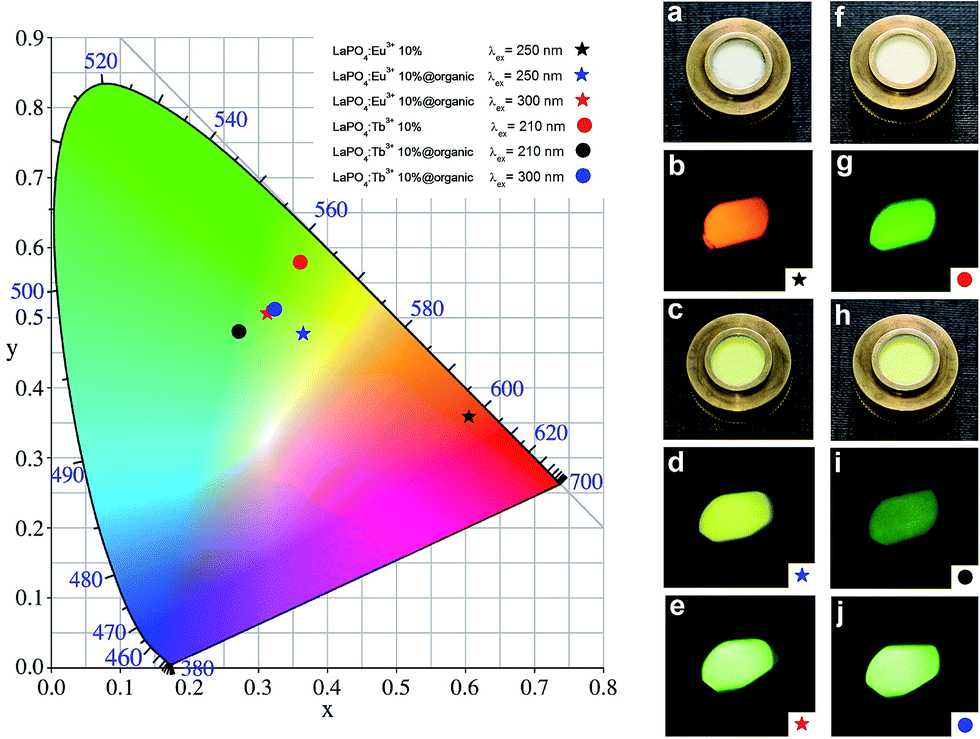 | ||
| Fig. 7 Chromaticity diagram and photographs of LaPO4:Eu3+ 10% (a and b), LaPO4:Eu3+ 10%@organic (c–e), LaPO4:Tb3+ 10% (f and g) and LaPO4:Tb3+ 10%@organic (h–j), taken in daylight (a, c, f and h) and under UV light irradiation (λex = 210 nm – g and i; λex = 250 nm – b and d; λex = 300 nm – e and j). | ||
 | ||
| Fig. 8 Luminescence decay curves of LaPO4:Eu3+ 10%, LaPO4:Eu3+ 10%@organic and LaPO4:Tb3+ 10%, LaPO4:Tb3+ 10%@organic. | ||
Fig. 6b shows three excitation spectra of LaPO4:Tb3+ 10% (λem = 543 nm) and LaPO4:Tb3+ 10%@organic (λem = 500, 543 nm). The spectrum of LaPO4:Tb3+ 10% (λem = 543 nm is the maximum of the most intensive in the emission spectrum 5D4 → 7F5 transition, within Tb3+ ions), shows a dominant broad band centred at 213 nm corresponding to 4f8 → 4f75d1 (f–d) allowed transition. The bands at higher wavelengths are assigned to the forbidden 4f–4f transitions in Tb3+ ion. In the spectrum of LaPO4:Tb3+ 10%@organic recorded at the same λem = 543 nm, the slightly shifted f–d transition is also dominant. The other 4f–4f transitions are not visible. The last excitation spectrum of this modified nanomaterial (λem = 500 nm) also reveals the dominant band related to f–d transition in Tb3+ ion. However, the very broad absorption band (with maximum ranging from 250 to 280 nm) assigned to the surface organic modifier, can be observed in the whole spectrum, as well.
Fig. 6c presents three emission spectra of LaPO4:Eu3+10% (λex = 250 nm) and LaPO4:Eu3+ 10%@organic (λex = 250, 300 nm). In the first spectrum of LaPO4:Eu3+10% recorded at λex = 250 nm (the position of the most intensive CT transition in the excitation spectrum), six narrow, split bands corresponding to the 5D0 → 7FJ (J = 0–5) transitions can be observed. The hypersensitive electric dipole 5D0 → 7F2 transition is sensitive to the site symmetry alterations.44,45 The ratio between integrated areas of the 5D0 → 7F2 and 5D0 → 7F1 transition bands is informative about the presence of symmetry centre in the site occupied by the Eu3+ ions. The values calculated both for LaPO4:Eu3+ 10% and LaPO4:Eu3+ 10%@organic are close to 1 (1.04 and 1.01 respectively). The ratio higher than 1 indicates that the Eu3+ ions are situated at sites without inversion symmetry. However, in the LaPO4:Eu3+ material the Eu3+ ions occupy sites with D2 symmetry in the LaPO4 structure which is non-centrosymmetric and the presence of an inversion centre cannot be assumed.46–48
The product exhibits an intense, bright red luminescence. When the surface modified nanomaterial was excited at the same wavelength, the intensity of the mentioned transitions decreased, and a new broad band appeared in the range of 500–550 nm. This band corresponds to the emission of the organic compound. As a consequence of these alternations in the spectrum shape, the observed luminescence of the product was tuned to yellowish emission. Upon exciting the organic modified nanomaterial at 300 nm (absorption range of the organic compound), the characteristic bands of Eu3+ ions can hardly be observed, in contrast to the very high intensity and broad emission band of the organic compound. The resulting emission of the product is green.
Fig. 6d shows three emission spectra of LaPO4:Tb3+ 10% (λex = 210 nm) and LaPO4:Tb3+ 10%@organic (λex = 210, 300 nm). The spectrum of LaPO4:Tb3+ 10%, recorded at λex = 210 nm (the position of the most intensive transition in the excitation spectrum), presents four narrow bands assigned to the 5D4 → 7FJ (J = 6–3) transitions, characteristic of Tb3+ ions.7 The product exhibits bright green luminescence. The spectrum of the LaPO4:Tb3+ 10%@organic nanophosphor excited at the same wavelength reveals four bands typical of Tb3+ ions, as well. However, the intensity of these bands decreased in comparison to that in the spectrum of the unmodified product. Besides these bands, less intensive bands around 500–550 nm, corresponding to the organic modifier can also be observed. The colour of the product emission is still green, however shifted towards blue. The spectrum of the modified nanomaterial excited at 300 nm reveals only the intensive, broad band assigned to the organic compound. Its luminescence is greenish, namely the colour of emission is slightly altered when compared to that of the unmodified nanophosphor.
For more detailed specification of the luminescence colours one can refer to the included chromaticity diagram (CIE 1964 10 deg observer), presented in Fig. 7. The photographs of the products synthesized, taken in daylight and under UV light, showing their multicolour emission, are included in Fig. 7, as well.
Fig. 8 presents the luminescence decay curves and calculated radiative lifetimes for the 5D0 → 7F2 and 5D4 → 7F5 transitions of Eu3+ and Tb3+ ions, respectively. All data were recorded at 293 K; λem = 620 nm, λex = 250 nm for the Eu3+ doped compounds and λem = 543 nm and λex = 210 nm, for the Tb3+ doped compounds. In hexagonal lanthanum phosphate, all lanthanide ions should be at the sites of the same type (coordination environment).24 However, the experimental profiles were successfully fitted to the biexponential function of decay, namely y = A1exp(−x/τ1) + A2exp(−x/τ2) + y0. The nanomaterials synthesized exhibit high surface-to-volume ratio. Therefore a large part of ions forming the material is placed on or near the surface of nanocrystals. Hence, after surface modification with the organic compound used, a significant number of the surface/near surface ions were localised in a new coordination environment (altered local site symmetry). The reason for this phenomenon was a strong coordination/binding of the organic molecules to the nanoparticles surface. This is why, the nanophosphors obtained exhibit a shorter second component of luminescence decay. Here is worth noting, that the presence of a small amount of monoclinic LaPO4 in the sample can affect the lifetime components and disturb their decay profiles. However, because of the large contribution (≈30%) of the second lifetime components and their significant shortening after the surface modification, we assume that the discussed biexponential character of the luminescence decay is predominantly caused by the differently emitting surface ions. The calculated luminescence lifetimes for the products synthesized are in the range of 4.25–4.96 ms (τ1) and 1.08–2.70 ms (τ2). The detailed values are presented in Fig. 8. Such relatively long radiative lifetimes are in line with literature data for lanthanide doped inorganic phosphors.49,50 The observed lifetimes for Eu3+ and Tb3+ doped products are generally similar, however the lifetimes of Eu3+ ions are slightly shorter when compared to those of Tb3+ ions. Analysis of the decay profiles leads to a conclusion that the modified nanomaterials exhibit a shorter average lifetime, in comparison to their unmodified analogues. The lifetime shortening is particularly pronounced in the second lifetime component (τ2), assigned to the surface ions (shortening from 1.75 to 1.08 ms and from 2.70 to 2.24 ms for Eu3+ and Tb3+ ions, respectively). This phenomenon can be explained by a strong interaction between surface ions and organic molecules attached to the nanoparticles surface, resulting in enhanced luminescence quenching. The results obtained are in agreement with the data on the emission decrease of the modified nanorods (see the emission spectra in Fig. 6a and b).
4. Conclusions
The highly luminescent, crystalline nanomaterials doped with Eu3+ and Tb3+ ions were synthesized via the co-precipitation approach followed by hydrothermal treatment. The nanomaterials formed were in the form of elongated nanorods (5–10 nm in width and 50–100 nm in length) composed of hexagonal LaPO4·0.5H2O. Subsequently, the products obtained were modified with a luminescent organic compound. The surface modification resulted in a formation of hybrid inorganic–organic nanomaterials, which exhibited tunable and multimodal luminescence. The products emission could be tuned from red-orange to yellow-green luminescence. Successful modification of the surface of nanocrystals was checked by DLS, IR spectroscopy, elemental analysis, TG-DTA and spectrofluorometry. These novel, functional nanomaterials can be applied in luminescence tracing, detection techniques, multicolour imaging, as novel light sources and in many other special applications requiring sophisticated, hybrid nanomaterials exhibiting tunable emission. The products synthesized can be also used in biomedical applications requiring multifunctionality of nanomaterials.Acknowledgements
Financial support from the National Science Centre (Grant no. UMO-2012/06/M/ST5/00325) is kindly acknowledged. M.R. gratefully acknowledges the financial support from the Polish Ministry of Science and Higher Education - scientific work financed from the budget for science in 2012–2015 as a research project within the program called “Diamond Grant” Nr DI2011 011441. A.Z. and E.G. gratefully acknowledges the financial support from the National Science Centre (Grant 2013/08/M/ST5/00781). P.K. gratefully acknowledges the financial support from the National Science Centre (Grant 2012/05/N/ST5/01505). M.G. thanks the National Science Centre “Maestro Project NR DEC-2012/06/A/ST4/00373” and the Foundation for Polish Science in Warsaw for financial support.Notes and references
- R. Bhargava, J. Lumin., 1996, 70, 85–94 CrossRef CAS.
- S. Heer, O. Lehmann, M. Haase and H.-U. Güdel, Angew. Chem., Int. Ed., 2003, 42, 3179–3182 CrossRef CAS PubMed.
- Z.-G. Yan and C. Yan, J. Mater. Chem., 2008, 18, 5046–5059 RSC.
- W. Feng, C. Han and F. Li, Adv. Mater., 2013, 1–17 Search PubMed.
- Q. Lü, A. Li, F. Guo, L. Sun and L. Zhao, Nanotechnology, 2008, 19, 145701 CrossRef PubMed.
- P. A. Tanner, Chem. Soc. Rev., 2013, 42, 5090–5101 RSC.
- T. Grzyb, M. Runowski, A. Szczeszak and S. Lis, J. Phys. Chem. C, 2012, 116, 17188–17196 CAS.
- T. Grzyb, R. J. Wiglusz, V. Nagirnyj, A. Kotlov and S. Lis, Dalton Trans., 2014, 43, 6925–6934 RSC.
- F. Wang, X. Fan, M. Wang and Y. Zhang, Nanotechnology, 2007, 18, 25701–25706 CrossRef.
- T. Grzyb, RSC Adv., 2014, 4, 2590–2595 RSC.
- T. Grzyb, M. Runowski, K. Dąbrowska, M. Giersig and S. Lis, J. Nanopart. Res., 2013, 15, 1958–1972 CrossRef PubMed.
- C. Cao, S. Guo, B. K. Moon, B. C. Choi and J. H. Jeong, Solid State Sci., 2013, 19, 99–103 CrossRef CAS PubMed.
- F. Auzel, Chem. Rev., 2004, 104, 139–173 CrossRef CAS PubMed.
- S. Lis, M. Elbanowski, B. Mąkowska and Z. Hnatejko, J. Photochem. Photobiol., A, 2002, 150, 233–247 CrossRef CAS.
- S. Wang, J. Feng, S. Song and H. Zhang, CrystEngComm, 2013, 15, 7142–7151 RSC.
- C. C. Lin and R.-S. Liu, J. Phys. Chem. Lett., 2011, 2, 1268–1277 CrossRef CAS.
- Q. Y. Zhang and X. Y. Huang, Prog. Mater. Sci., 2010, 55, 353–427 CrossRef CAS PubMed.
- S. V. Eliseeva and J.-C. G. Bünzli, Chem. Soc. Rev., 2010, 39, 189–227 RSC.
- G. Boulon, Opt. Mater., 2012, 34, 499–512 CrossRef CAS PubMed.
- K. Binnemans, Chem. Rev., 2009, 109, 4283–4374 CrossRef CAS PubMed.
- P. Escribano, B. Julián-López, J. Planelles-Aragó, E. Cordoncillo, B. Viana and C. Sanchez, J. Mater. Chem., 2008, 18, 23–40 RSC.
- L. D. Carlos, R. A. S. Ferreira, V. de Zea Bermudez, B. Julián-López and P. Escribano, Chem. Soc. Rev., 2011, 40, 536–549 RSC.
- J.-N. Park, P. Zhang, Y.-S. Hu and E. W. McFarland, Nanotechnology, 2010, 21, 225708 CrossRef PubMed.
- M. Runowski, K. Dąbrowska, T. Grzyb, P. Miernikiewicz and S. Lis, J. Nanopart. Res., 2013, 15, 2068 CrossRef PubMed.
- E. He, H. Zheng, J. Dong, W. Gao, Q. Han, J. Li, L. Hui, Y. Lu and H. Tian, Nanotechnology, 2014, 25, 045603–045611 CrossRef PubMed.
- S. A. Corr, Y. P. Rakovich and Y. K. Gun'ko, Nanoscale Res. Lett., 2008, 3, 87–104 CrossRef CAS.
- S. T. Selvan, T. T. Y. Tan, D. K. Yi and N. R. Jana, Langmuir, 2009, 26, 11631–11641 CrossRef PubMed.
- S. X. C. Mi, J. Zhang, H. Gao, X. Wu, M. Wang, Y. Wu, Y. Di, Z. Xu and C. Mao, Nanoscale, 2010, 2, 1141–1148 RSC.
- M. Runowski, T. Grzyb and S. Lis, J. Nanopart. Res., 2012, 14, 1188 CrossRef PubMed.
- B. Lu, Z. Zhang, J. Hao and J. Tang, RSC Adv., 2014, 4, 21909 RSC.
- Y. He, S. Vasiraju and L. Que, RSC Adv., 2014, 4, 2433 RSC.
- M. Liong, J. Lu, M. Kovochich, T. Xia, S. G. Ruehm, A. E. Nel, F. Tamanoi and J. I. Zink, ACS Nano, 2008, 2, 889–896 CrossRef CAS PubMed.
- P. Kulpinski, M. Namyslak, T. Grzyb and S. Lis, Cellulose, 2012, 19, 1271–1278 CrossRef CAS.
- J. Wang, J. Hu, D. Tang, X. Liu and Z. Zhen, J. Mater. Chem., 2007, 17, 1597–1601 RSC.
- L. Lou, K. Yu, Z. Zhang, B. Li, J. Zhu, Y. Wang, R. Huang and Z. Zhu, Nanoscale, 2011, 3, 2315–2323 RSC.
- M. Runowski, A. Ekner-Grzyb, L. Mrówczyńska, S. Balabhadra, T. Grzyb, J. Paczesny, A. Zep and S. Lis, Langmuir, 2014, 30, 9533–9543 CrossRef CAS PubMed.
- B. Mohr, V. Enkelmann and G. Wegner, J. Org. Chem., 1994, 59, 635–638 CrossRef CAS.
- E. J. Foster, C. Lavigueur, Y.-C. Ke and V. E. Williams, J. Mater. Chem., 2005, 15, 4062–4068 RSC.
- E. J. Foster, R. B. Jones, C. Lavigueur and V. E. Williams, J. Am. Chem. Soc., 2006, 128, 8569–8574 CrossRef CAS PubMed.
- C.-J. Chen, Y.-C. Wu, H.-S. Sheu, G.-H. Lee and C. K. Lai, Tetrahedron, 2011, 67, 114–124 CrossRef CAS PubMed.
- J. Szydłowska, P. Krzyczkowska, M. Salamończyk, E. Górecka, D. Pociecha, B. Maranowski and A. Krówczyński, J. Mater. Chem. C, 2013, 1, 6883–6889 RSC.
- S. Lucas, E. Champion, D. Bregiroux, D. Bernache-Assollant and F. Audubert, J. Solid State Chem., 2004, 177, 1302–1311 CrossRef CAS PubMed.
- Z. Xu, Y. Cao, C. Li, P. Ma, X. Zhai, S. Huang, X. Kang, M. Shang, D. Yang, Y. Dai and J. Lin, J. Mater. Chem., 2011, 21, 3686–3694 RSC.
- B. R. Judd, J. Chem. Phys., 1966, 44, 839 CrossRef CAS PubMed.
- M. Runowski, S. Balabhadra and S. Lis, J. Rare Earths, 2014, 32, 242–247 CrossRef CAS.
- T. Anfimova, Q. Li, J. O. Jensen, and N. J. Bjerrum, Int. J. Electrochem. Sci. 2014, 9, 2285–2300 Search PubMed.
- J. a. Diaz-Guillén, A. F. Fuentes, S. Gallini and M. T. Colomer, J. Alloys Compd., 2007, 427, 87–93 CrossRef PubMed.
- K. Binnemans and C. Görller-Walrand, J. Rare Earths, 1996, 14, 173–180 Search PubMed.
- I. Omkaram, G. Seeta Rama Raju and S. Buddhudu, J. Phys. Chem. Solids, 2008, 69, 2066–2069 CrossRef CAS PubMed.
- M. Runowski and S. Lis, J. Alloys Compd., 2014, 597, 63–71 CrossRef CAS PubMed.
Footnote |
| † Electronic supplementary information (ESI) available: TG-DTA curves of the LaPO4:Eu3+ 10%, LaPO4:Tb3+ 10%, surface modified LaPO4:Eu3+ 10%@organic and LaPO4:Tb3+ 10%@organic nanomaterials (Fig. S1†). See DOI: 10.1039/c4ra06168c |
| This journal is © The Royal Society of Chemistry 2014 |