Computational studies on the adsorption of CO2 in the flexible perfluorinated metal–organic framework zinc 1,2-bis(4-pyridyl)ethane tetrafluoroterephthalate
Bor Kae
Chang
*,
Paul D.
Bristowe
and
Anthony K.
Cheetham
Department of Materials Science and Metallurgy, University of Cambridge, Cambridge CB2 3QZ, UK. E-mail: bc314@cam.ac.uk; Fax: +44 (0)1223 334567; Tel: +44 (0)1223 334300
First published on 5th November 2012
Abstract
Carbon dioxide adsorption sites within the flexible metal–organic framework (MOF) zinc 1,2-bis(4-pyridyl)ethane tetrafluoroterephthalate (Znbpetpa) were investigated using density functional theory (DFT) and canonical Monte Carlo (MC) calculations. Two types of sites with different heats of adsorption were found by using DFT and confirmed by the MC results. Expansion of the cavities occurred simultaneously with gas uptake and the process of “breathing” within the MOF was identified. The presence of such a mechanism makes the understanding of this structure useful in tuning the design of MOFs for permanent trapping of gases.
1 Introduction
Adsorption of gases in a flexible framework structure such as zinc 1,2-bis(4-pyridyl)ethane tetrafluoroterephthalate (Znbpetpa)1,2 presents an interesting scenario that can shed light on the response of non-rigid MOFs to specific guest–host interactions. As gas fills the cavities of the crystalline material, expansion or swelling of the cell is expected, a phenomenon known as “breathing” which has been observed in other hybrid crystalline structures.3 In certain cases, materials possess a distinct gate opening mechanism, as observed in the copper bipyridine complex studied by Li and Kaneko4 and demonstrated in MOF-55 and ZIF-8.6,7 This can present even more drastically differentiated adsorption isotherm profiles for various gas species, and the same structure can exhibit different selectivity when the environment is altered, as described in the hydration of MIL-53(Cr).8We have previously demonstrated the flexibility present in the material Znbpetpa and the crucial role played by van der Waals forces.9 The presence of a breathing mechanism could imply an enhanced ability to trap molecules for storage. By using density functional theory (DFT) calculations to investigate CO2 adsorption in this system, the amount of breathing can be observed from first principles, albeit at a marked increase in computational costs arising from the fact that changes in cell parameters when the adsorbate is added to the system must be taken into account. Nonetheless, a systematic and thorough approach can reveal important features such as the changes in system total energy when a molecule is adsorbed at various sites within the structure, enabling differentiation of sites in CO2 uptake.
Semi-empirical Monte Carlo (MC) simulations can further corroborate or challenge findings from DFT by providing a parameterized approach to investigate adsorption in Znbpetpa. Canonical (NVT) ensemble sampling can emulate the infinite dilution condition where a single CO2 molecule enters the system with fixed volume and temperature. Although the framework structures must remain rigid using such a method, MC is a rapid technique that has been widely applied to gas adsorption phenomena in metal–organic frameworks.10–12
2 Methods
2.1 DFT computational details
For consistency with previous studies on Znbpetpa,9 CASTEP13 and the GGA-PBE functional14 were used for all the following DFT work, including the dispersion correction using the G06 method.15 Dispersion interactions have been shown to contribute up to approximately half of the adsorption energy of CO2 in the zeolite H-FER16 and CO, N2, and CO2 in Mg-MOF-74;17 previous work12 has also further demonstrated the need to implement the van der Waals dispersion correction in the current study to obtain the correct cell parameters and Zn–C–O chain features.Results of the convergence tests on the CO2 molecule justified the use of 640 eV for the kinetic energy plane wave cutoff and a 2 × 2 × 1 k-point sample grid; however, in order to match the parameters used in the Znbpetpa calculations, a 2 × 2 × 2 sampling grid was used in the following adsorption calculations. The convergence criteria for single-point energy and geometry optimization were as follows: total energy, maximum ionic force, maximum ionic displacement and maximum stress are 1 × 10⁻⁵ eV per atom, 3 × 10⁻² eV Å−1, 1 × 10⁻³ Å and 5 × 10⁻² GPa respectively.
2.2 Monte Carlo computational details
The Sorption Metropolis Monte Carlo module within Materials Studio v6.0.0 from Accelrys Software Inc. was used to perform the classical simulations. For comparison, both the UFF18 and the DREIDING19 force fields were applied to describe Znbpetpa and CO2 in two separate series of calculations. The total energy of the system is approximated as the sum of all pair-wise inter-atomic interactions represented by a Lennard-Jones (LJ) potential and Coulombic interaction: | (1) |
To locate the preferred adsorption site the configurational space was searched using a simulated annealing method.20,21 The temperature was lowered in succession, letting the gas molecule reach a desirable configuration at each stage by allowing it to repeatedly rotate, translate, or very rarely re-position in a different physical location with preset probabilities of occurrence. These moves were accepted or rejected following the Metropolis Monte Carlo method,22 where changes that lowered system energy were automatically accepted. Energy increasing moves were still considered, but only accepted with a probability equal to exp(−ΔU/kBT), where kB is the Boltzmann constant and T is the current system temperature. At high temperatures, the acceptance ratio allowed higher energy states to be explored and thus avoid steering the system directly into local minima. As the temperature was lowered in the simulated annealing process, the acceptance ratio of energy increasing moves becomes more stringent as well, leading to a rapid convergence towards a minimum in configurational space. This process of heating up the system and gradually cooling it was repeated in several heating cycles to decrease the likelihood of finding local minima. Interactions were evaluated up to a cutoff of 18.5 Å by pairwise summation for the dispersive forces, and using the Ewald23 and group summation method for the electrostatic interactions. Forty heating cycles were performed where the maximum and final temperatures were 105 K and 100 K, respectively, and the NVT ensemble sampling process consisted of 107 equilibration steps followed by another 107 production steps, with final calculated properties coming only from the latter. The total energy as a function of number of steps showed convergence within 3 × 10⁶ steps or 11 heating cycles. Calculations were performed using one unit cell, but tests on 2 × 2 × 1 unit cells to evaluate finite size effects confirmed the converged results.
2.3 Model systems
Initial atomic positions and cell parameters of the Znbpetpa unit cell, described extensively elsewhere,1,2,9 were taken from the G06 geometry optimized result, which is nearly identical to the experimental structure determined by X-ray diffraction. For the DFT calculations of the total energy of CO2, the molecule was placed in a cubic box with large enough dimensions as determined by convergence testing (15 Å on each side) to avoid self-interaction between periodic images. CO2 is a linear molecule with double bonds between the central carbon and oxygen atoms. The experimental bond lengths are 1.163 Å,24 which relaxed to 1.156 Å after geometry optimization. When placed within the Znbpetpa unit cell, the experimental value was used as the initial bond length.![[P with combining macron]](https://www.rsc.org/images/entities/i_char_0050_0304.gif) , centrosymmetry was disregarded when CO2 was included. The initial positions for the CO2 molecules were chosen based on “chemical intuition”, as demonstrated by Bourrelly et al. on MIL-53(Cr)25 and Ramsahye et al. on MIL-53(Al) and MIL-47(V).26 Previous experimental and computational works by Rowsell, Spencer, Rosi et al.27–30 and Yildirim, Wu et al.31,32 have shed light on this topic, where sites above the faces and edges of inorganic polyhedra and aromatic rings of the organic linkers were described as “hotspots” of adsorption activity for adsorbate molecules in MOFs. Although it was suggested by Ramsahye et al. in their studies on MIL MOFs that shielding of metal ions by surrounding oxygen and CO2 with its large quadrupole moment together lead to mainly electrostatic interactions with organic units,26 the initial positions above metal polyhedra faces were still included for completeness. If these positions are less attractive to adsorbate molecules, then this will be reflected in the converged structure.
, centrosymmetry was disregarded when CO2 was included. The initial positions for the CO2 molecules were chosen based on “chemical intuition”, as demonstrated by Bourrelly et al. on MIL-53(Cr)25 and Ramsahye et al. on MIL-53(Al) and MIL-47(V).26 Previous experimental and computational works by Rowsell, Spencer, Rosi et al.27–30 and Yildirim, Wu et al.31,32 have shed light on this topic, where sites above the faces and edges of inorganic polyhedra and aromatic rings of the organic linkers were described as “hotspots” of adsorption activity for adsorbate molecules in MOFs. Although it was suggested by Ramsahye et al. in their studies on MIL MOFs that shielding of metal ions by surrounding oxygen and CO2 with its large quadrupole moment together lead to mainly electrostatic interactions with organic units,26 the initial positions above metal polyhedra faces were still included for completeness. If these positions are less attractive to adsorbate molecules, then this will be reflected in the converged structure.
To this end, a total of 14 sites in the structure were probed (see Fig. 1). In six of the configurations, the molecule was placed directly above the faces of a trigonal bipyramid and thus designated as “inorganic sites”, while the other eight “organic sites” were above the conjugated ring faces of the two types of organic linkers. For the inorganic set, the O![[double bond, length as m-dash]](https://www.rsc.org/images/entities/char_e001.gif) C
C![[double bond, length as m-dash]](https://www.rsc.org/images/entities/char_e001.gif) O molecule was aligned to form a straight line with the zinc atom perpendicular to the designated face of the polyhedron, with the closer oxygen atom 2.5 Å from the metal center. Positions of CO2 for the organic configurations were more diverse, with distances and orientations dependent on available cavity space in the near vicinity. These initial distances and orientations with respect to the aromatic ring face are listed in Table 1.
O molecule was aligned to form a straight line with the zinc atom perpendicular to the designated face of the polyhedron, with the closer oxygen atom 2.5 Å from the metal center. Positions of CO2 for the organic configurations were more diverse, with distances and orientations dependent on available cavity space in the near vicinity. These initial distances and orientations with respect to the aromatic ring face are listed in Table 1.
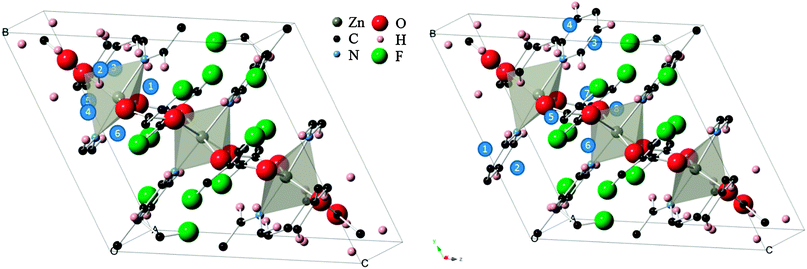 | ||
| Fig. 1 (left) “Inorganic” CO2 adsorption sites (blue circles) within the Znbpetpa structure. (right) “Organic” sites in the same unit cell, with triazole rings included. The Znbpetpa structure contains 3 metal center polyhedra: a central octahedron and 2 trigonal bipyramids. | ||
| Initial site number | Distance from ring face (Å) | Parallel or perpendicular to ring face |
|---|---|---|
| 1 | 0.914 | Near perpendicular |
| 2 | 0.678 | Perpendicular |
| 3 | 2.212 | Parallel |
| 4 | 1.241 | Perpendicular |
| 5 | 1.335 | Parallel |
| 6 | 2.113 | Parallel |
| 7 | 1.203 | Parallel |
| 8 | 2.113 | Parallel |
These positions were further refined in a two-step process by first constraining the cell parameters and allowing CO2 to move freely within the structure, then finally relaxing all atomic positions and cell parameters. The heats of adsorption were calculated from the series of geometry optimizations using
| ΔH = EMOF+CO2 − EMOF − ECO2 | (2) |
Specific Lennard-Jones parameters used in this study from the DREIDING and UFF force fields are listed in Table 2. The description of CO2 was taken from the work of Liu and Smit,33 with C![[double bond, length as m-dash]](https://www.rsc.org/images/entities/char_e001.gif) O bond lengths of 1.18 Å, and charges of qc = +0.576e and qO = −0.288e. Framework atomic partial charges, when used, were determined for each configuration with the charge equilibration method proposed by Rappé and Goddard.34
O bond lengths of 1.18 Å, and charges of qc = +0.576e and qO = −0.288e. Framework atomic partial charges, when used, were determined for each configuration with the charge equilibration method proposed by Rappé and Goddard.34
| DREIDING | UFF | |||
|---|---|---|---|---|
| σ (Å) | ε (kcal mol−1) | σ (Å) | ε (kcal mol−1) | |
| Zn | 4.5400 | 0.0550 | 2.7630 | 0.1240 |
| H | 3.1950 | 0.0152 | 2.8860 | 0.0440 |
| F | 3.4720 | 0.0725 | 3.3640 | 0.0500 |
| N (aromatic) | 3.6621 | 0.0774 | 3.6600 | 0.0690 |
| O | 3.4046 | 0.0957 | 3.5000 | 0.0600 |
| C (sp2) | 3.8983 | 0.0951 | 3.8510 | 0.1050 |
| C (aromatic) | 3.8983 | 0.0951 | 3.8510 | 0.1050 |
| C (aromatic, 1 hydrogen) | 4.2300 | 0.1356 | 3.8510 | 0.1050 |
| C (sp3, 2 hydrogens) | 4.0677 | 0.1984 | 3.8510 | 0.1050 |
3 Results and discussion
3.1 DFT results
During the first stage of DFT optimization, with the framework atoms constrained, the CO2 molecule was effectively allowed to move freely from its original site until the convergence criteria were met. This resulted in the molecule relaxing to a more energetically favorable position and orientation within the rigid MOF, further refining the starting adsorption sites. Similar to the observations of Ramsahye et al.26 on the MIL structure, interaction with metal centers were not highly preferred since CO2 placed in inorganic sites ended up elsewhere. In several scenarios, CO2 molecules starting in nearby sites migrated towards the closest cavity within the framework. This is shown in Fig. 2, where the original sites have converged into six general cavities found in the structure. Organic site 6, enclosed by the faces of the tetrafluoroterephthalate (tftpa) linker and the edges of the 1,2-bis(4-pyridyl)ethane (bpe) linkers (Fig. 2, right), failed to produce a converged structure. The fact that in all the other scenarios, the CO2 molecule was able to move to more energetically favorable sites leads to the conclusion that steric effects around organic site 6 prohibit the adsorbate to exit the initial cavity.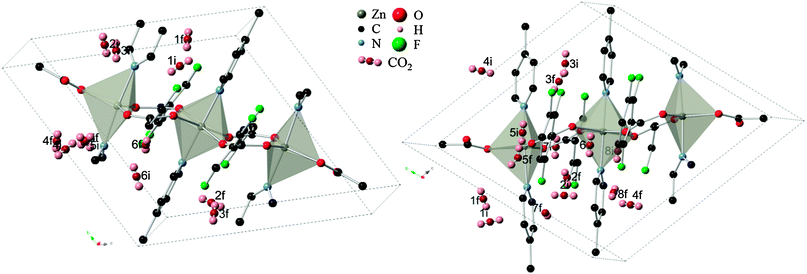 | ||
| Fig. 2 (left) Relaxation of “inorganic” CO2 adsorption sites from initial (i) to converged final locations (f) within the Znbpetpa structure. (right) “Organic sites” in the same unit cell undergoing similar relocation. All atomic radii have been reduced, hydrogen and molecular fragments removed, and CO2 bond lengths shortened for clarity. Positions 2 and 3 on the left and position 4 on the right are shown across the cell due to periodic boundary conditions. | ||
The 13 remaining sites in six cavities from the previous partial relaxation of the structure were taken as the starting point for full relaxation of atomic positions and cell parameters to take into account structural changes during adsorption. Of these sites, five locations in the P1 symmetry successfully converged, with one site (organic site 7) showing unphysical dissociation of the CO2 molecule and was therefore not considered further. The remaining 8 sites failed to produce a correctly converged structure, but still yielded important information about the system by indicating that these locations are non-physical for CO2 adsorption. The set of four valid locations can be divided into two pairs of symmetry-related sites which were arrived at independently. These sites were designated as configurations A and B, as depicted in Fig. 3 with their corresponding heats of adsorption. Interestingly, the change in system energy for configuration A is about half that of configuration B, indicating the presence of two distinct types of adsorption sites. It is therefore postulated that initial loading of CO2 molecules would lead to the more energetically favorable configuration B in Znbpetpa, with a mixture of both A and B type loading at higher intake as A type sites become nearly saturated.
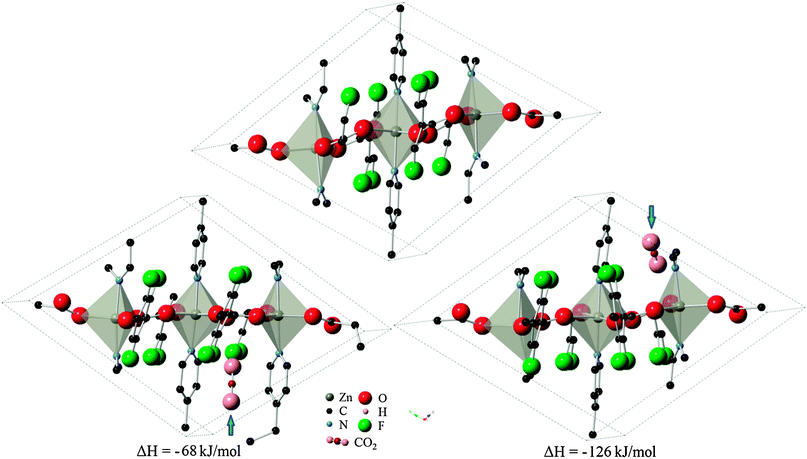 | ||
| Fig. 3 Location of CO2 molecule in configurations (left) A and (right) B, marked by blue arrow, and corresponding change in system enthalpy from (top) evacuated structure. Hydrogen atoms and some fragments have been removed for clarity. | ||
The difference in energies for the two sites can be explained by the strength of the host–guest interactions in each case, as depicted in Fig. 4. The CO2 molecule, when adsorbed to site A, lies in between two pyridine ring faces and the edge of a third pyridine molecule. The two ring faces are further away than the ring edge, with measurements indicating O(CO2)-H(pyridine edge) distances of 2.974 Å and 2.585 Å. In the case of adsorption in site B however, the CO2 molecule is found in a bridging position between two ring edges. O(CO2)-H(pyridine) distances in this configuration consists of two closer contacts than found in configuration A, and two additional ones that are slightly further apart (2.365 Å, 2.459 Å, 2.658 Å, 3.144 Å). The close proximity of the ring edge, indicating stronger interactions, and the higher number of contact points in configuration B explain the larger heat of adsorption.
 | ||
| Fig. 4 CO2 molecule in (left) configuration A and (right) configuration B. Measurements to closest contact points are shown in angstroms and some atoms have been removed for clarity. | ||
The heat of adsorption for site A, with an absolute value of 68 kJ mol−1, falls within the range of experimentally observed values for various MOFs tabulated by Keskin et al.,35 where the majority of reported heats of adsorption range from 20 to 50 kJ mol−1, with a few values reaching as high as 90 kJ mol−1. However, the absolute value calculated for site B, 128 kJ mol−1, is much higher, likely due to the relatively smaller cavity sizes found here. MIL-100 (62 kJ mol−1) has a minimum free internal diameter of nearly 2.5 nm,36 and the sodalite-type Cu-BTTri(en) (90 kJ mol−1) possesses a large open cavity in the unit cell as well.37
The cavities are large enough to hold CO2 molecules without expanding, as evidenced by the converged results where the cell parameters were locked. However, the flexibility innate in Znbpetpa allows the structure to expand specific cavities to accommodate arriving adsorbate. Indeed, in both configurations, CO2 uptake within Znbpetpa is accompanied by an expansion of the specific cavity within the structure (Fig. 3), leading to changes in the cell dimensions (Table 3). Final volumes in configurations A and B increased by 8.3% and 6.2% with initial gas intake, respectively. This confirms the presence of a “breathing” mechanism in Znbpetpa. Further analysis of the resulting converged structures shows the response of the structure to gas entry. In configuration A (Fig. 3, left), it was observed that the presence of CO2 rotated the neighboring bpe (octahedron) linker by 2° to accommodate the molecule, and this expansion was accompanied by a straightening of the zigzag backbone that runs diagonally across the cell. The straightening effect was not as dominant in configuration B (Fig. 3, right), where the gas molecule was aligned parallel to the edge of a bpe (trigonal bipyramid) linker. In this configuration, however, the tftpa linker was pushed so much that it tilts in the opposite direction when compared to the evacuated structure. A “bowing” effect was also seen in the N–Zn–N axis of the trigonal bipyramid across the cell from the CO2 adsorption site, which was bent from 174.8° to 166.4°. Note that the periodic image of CO2 due to the boundary conditions is to the left of this lower pyridine ring from the view of Fig. 3.
| Evacuated | Config. A | Increase (%) | Config. B | Increase (%) | |
|---|---|---|---|---|---|
| a | 10.531 Å | 10.652 Å | 1.15 | 10.702 Å | 1.62 |
| b | 11.749 Å | 13.091 Å | 11.4 | 12.310 Å | 4.77 |
| c | 13.480 Å | 13.780 Å | 2.23 | 14.197 Å | 5.32 |
| α | 103.667° | 100.836° | −2.73 | 101.856° | −1.75 |
| β | 111.150° | 115.588° | 3.99 | 113.096° | 1.75 |
| γ | 107.016° | 110.471° | 3.23 | 111.656° | 4.34 |
| Vol. | 1373.787 Å3 | 1487.258 Å3 | 8.26 | 1458.692 Å3 | 6.18 |
3.2 NVT-MC results
Three varieties of the Znbpetpa system were investigated with the Monte Carlo calculations: evacuated and configurations A and B. In the evacuated scenario, even by doubling the number of CO2 loading attempts to 2 × 10⁷, the calculation could not find any preferred adsorption locations. This highlights the importance of the breathing and readjustment of cavity atoms which accompany adsorption in Znbpetpa. Results for configurations A and B on the other hand showed excellent match with DFT results. Fig. 5 shows the final locations of CO2 in Znbpetpa as predicted by the two methods, with the shortest distance between the gas molecule and neighboring organic linker (configuration A) and orientation with regards to the zinc metal centers (configuration B) labeled for comparison. MC output placed the CO2 in nearly identical locations and orientations to the DFT results, confirming the validity of these sites.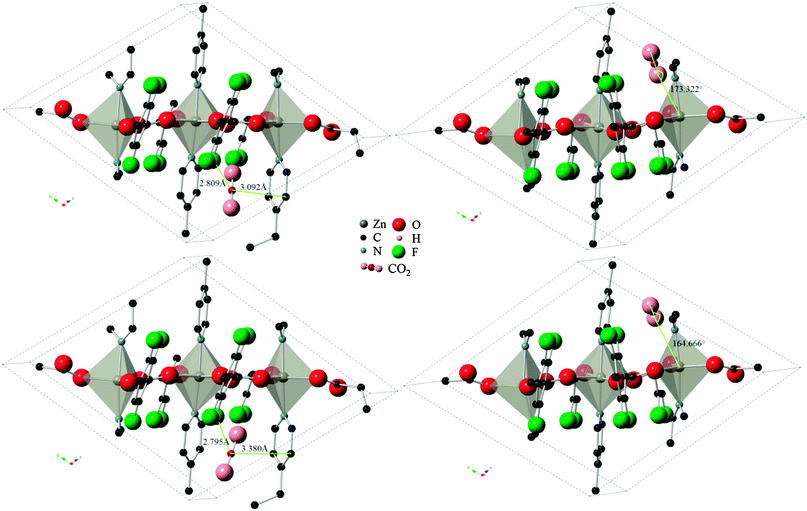 | ||
| Fig. 5 Final locations of the CO2 molecule in Znbpetpa. Top figures are DFT results, bottom figures are MC results (DREIDING force field, with framework charges calculated), left figures are of configuration A, and right figures are of configuration B. Hydrogen atoms and some fragments have been removed for clarity. | ||
Results using the DRIEDING and UFF force fields yielded almost identical results for the CO2 position and orientation within Znbpetpa, here using configuration A adsorption as an example (Fig. 6, top and left). The same occurred when atomic point charges were absent or present on the framework itself (Fig. 6, top and right). This led to the conclusion that steric effects in the structure, not framework charges or variations in the description of intermolecular forces, determines the uptake of CO2.
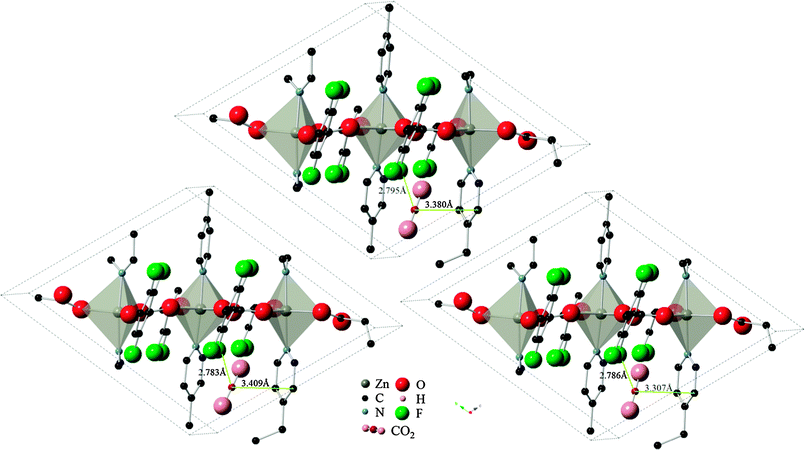 | ||
| Fig. 6 Final locations of CO2 configuration A in Znbpetpa. (Top) DREIDING force field used and framework charges calculated with charge equilibration method; (left) UFF force field used and framework charged; (right) DREIDING force field used and no charges imposed on framework structure. Hydrogen atoms and some fragments have been removed for clarity. | ||
4 Conclusions
DFT calculations on possible CO2 adsorption sites within the flexible Znbpetpa structure identified two configurations with low adsorption enthalpy. Total system energies indicated that configuration B with ΔH = −126 kJ mol−1 is the most attractive site for adsorbing gas molecules, while a separate site A with ΔH = −68 kJ mol−1 also exists. Both adsorption sites displayed a “breathing” of the structure when adsorption occurs and an expansion of the gas-holding cavity.The use of NVT MC calculations on three possible framework adsorption modes further confirmed the importance of steric effects for gas uptake in Znbpetpa. No ideal adsorption site was found in the evacuated structure, while gas molecule positions and orientations in configurations A and B were in excellent agreement with DFT results. Furthermore, the use of different force fields and the absence or presence of framework atomic charge potentials did not affect the MC results. Because of the inability of MC to predict framework relaxations, its role has been reduced to validating and supporting the DFT conclusions.
These results highlight the importance of considering framework flexibility when studying gas adsorption in MOFs, and also help to refine preferred adsorption sites. Consideration of these factors will assist in taking advantage of the “breathing” mechanism found in materials of the same class for applications in permanent trapping of gases.
Acknowledgements
B.K.C. acknowledges support from the Ministry of Education, Republic of China, and A.K.C. is grateful to the ERC for an Advanced Investigator Award. The calculations were performed using the high performance computing facilities at the UK National Supercomputing Service (HECToR). Computing resources were provided by EPSRC grant EP/F038356/1 awarded to the UK Car-Parrinello consortium. B.K.C. is grateful to CS Ruan for useful discussions.Notes and references
- Z. Hulvey, J. D. Furman, S. A. Turner, M. Tang and A. K. Cheetham, Cryst. Growth Des., 2010, 10, 2041–2043 CrossRef CAS.
- Z. Hulvey, D. A. Sava, J. Eckert and A. K. Cheetham, Inorg. Chem., 2011, 50, 403–405 CrossRef CAS.
- G. Férey and C. Serre, Chem. Soc. Rev., 2009, 38, 1380–1399 RSC.
- D. Li and K. Kaneko, Chem. Phys. Lett., 2001, 335, 50–56 CrossRef CAS.
- K. S. Walton, A. R. Millward, D. Dubbeldam, H. Frost, J. J. Low, O. M. Yaghi and R. Q. Snurr, J. Am. Chem. Soc., 2008, 130, 406–407 CrossRef CAS.
- S. A. Moggach, T. D. Bennett and A. K. Cheetham, Angew. Chem., Int. Ed., 2009, 48, 7087–7089 CrossRef CAS.
- D. Fairen-Jimenez, S. A. Moggach, M. T. Wharmby, P. A. Wright, S. Parsons and T. Düren, J. Am. Chem. Soc., 2011, 133, 8900–8902 CrossRef CAS.
- P. L. Llewellyn, S. Bourrelly, C. Serre, Y. Filinchuk and G. Férey, Angew. Chem., Int. Ed., 2006, 45, 7751–7754 CrossRef CAS.
- B. K. Chang, N. C. Bristowe, P. D. Bristowe and A. K. Cheetham, Phys. Chem. Chem. Phys., 2012, 14, 7059–7064 RSC.
- R. B. Getman, Y.-S. Bae, C. E. Wilmer and R. Q. Snurr, Chem. Rev., 2012, 112, 703–723 CrossRef CAS.
- T. Düren, Y.-S. Bae and R. Q. Snurr, Chem. Soc. Rev., 2009, 38, 1237–1247 RSC.
- S. Keskin, J. Liu, R. B. Rankin, J. K. Johnson and D. S. Sholl, Ind. Eng. Chem. Res., 2009, 48, 2355–2371 CrossRef CAS.
- S. J. Clark, M. D. Segall, C. J. Pickard, P. J. Hasnip, M. J. Probert, K. Refson and M. C. Payne, Z. Kristallogr., 2005, 220, 567–570 CrossRef CAS.
- J. P. Perdew, K. Burke and M. Ernzerhof, Phys. Rev. Lett., 1996, 77, 3865–3868 CrossRef CAS.
- S. Grimme, J. Comput. Chem., 2006, 27, 1787–1799 CrossRef.
- A. Pulido, M. R. Delgado, O. Bludský, M. Rubeš, P. Nachtigall and C. O. Areán, Energy Environ. Sci., 2009, 2, 1187 RSC.
- L. Valenzano, B. Civalleri, S. Chavan, G. T. Palomino, C. O. Areán and S. Bordiga, J. Phys. Chem. C, 2010, 114, 11185 CrossRef CAS.
- A. K. Rappé, C. J. Casewit, K. S. Colwell, W. A. Goddard III and W. M. Skiff, J. Am. Chem. Soc., 1992, 114, 10035–10046 CrossRef CAS.
- S. L. Mayo, B. D. Olafson and W. A. Goddard III, J. Phys. Chem., 1990, 94, 8897–8909 CrossRef CAS.
- S. Kirkpatrick, C. D. Gelatt and M. P. Vecchi, Science, 1983, 220, 671–680 CrossRef.
- V. Černý, J. Opt. Theory Appl., 1985, 45, 41–51 Search PubMed.
- N. Metropolis, A. W. Rosenbluth, M. N. Rosenbluth and A. H. Teller, J. Chem. Phys., 1953, 21, 1087–1092 CrossRef CAS.
- D. Frenkel and B. Smit, Understanding Molecular Simulation: From Algorithms to Applications, Academic Press, San Diego, 2nd edn, 2002 Search PubMed.
- N. N. Greenwood and A. Earnshaw, Chemistry of the Elements, Butterworth-Heinemann Ltd, Oxford, 2nd edn, 1997 Search PubMed.
- S. Bourrelly, B. Moulin, A. Rivera, G. Maurin, S. Devautour-Vinot, C. Serre, T. Devic, P. Horcajada, A. Vimont, G. Clet, M. Daturi, J.-C. Lavalley, S. Loera-Serna, R. Denoyel, P. L. Llewellyn and G. Férey, J. Am. Chem. Soc., 2010, 132, 9488–9498 CrossRef CAS.
- N. A. Ramsahye, G. Maurin, S. Bourrelly, P. L. Llewellyn, C. Serre, T. Loiseau, T. Devic and G. Férey, J. Phys. Chem. C, 2008, 112, 514–520 CrossRef CAS.
- N. L. Rosi, J. Eckert, M. Eddaoudi, D. T. Vodak, J. Kim, M. O'Keeffe and O. M. Yaghi, Science, 2003, 300, 1127–1129 CrossRef CAS.
- J. L. C. Rowsell, J. Eckert and O. M. Yaghi, J. Am. Chem. Soc., 2005, 127, 14904–14910 CrossRef CAS.
- J. L. C. Rowsell, E. C. Spencer, J. Eckert, J. A. K. Howard and O. M. Yaghi, Science, 2005, 309, 1350–1354 CrossRef CAS.
- E. C. Spencer, J. A. K. Howard, G. J. McIntyre, J. L. C. Rowsell and O. M. Yaghi, Chem. Commun., 2006, 278–280 RSC.
- T. Yildirim and M. R. Hartman, Phys. Rev. Lett., 2005, 95, 215504 CrossRef CAS.
- H. Wu, J. M. Simmons, G. Srinivas, W. Zhou and T. Yildirim, J. Phys. Chem. Lett., 2010, 1, 1946–1951 Search PubMed.
- B. Liu and B. Smit, J. Phys. Chem. C, 2010, 114, 8515–8522 CrossRef CAS.
- A. K. Rappé and W. A. Goddard III, J. Phys. Chem., 1991, 95, 3358–3363 CrossRef CAS.
- S. Keskin, T. M. Van Heest and D. S. Sholl, ChemSusChem, 2010, 3, 879–891 CrossRef CAS.
- P. L. Llewellyn, S. Bourrelly, C. Serre, A. Vimont, M. Daturi, L. Hamon, G. De Weireld, J.-S. Chang, D.-Y. Hong, Y. K. Hwang, S. H. Jhung and G. Féray, Langmuir, 2008, 24, 7245–7250 CrossRef.
- A. Demessence, D. M. D'Alessandro, M. L. Foo and J. R. Long, J. Am. Chem. Soc., 2009, 131, 8784–8786 CrossRef CAS.
| This journal is © the Owner Societies 2013 |
