Structure and speciation of chromium ions in chromium doped Fe2O3 catalysts
Vladimir
Martis
ab,
Richard
Oldman
ac,
Ross
Anderson
c,
Martin
Fowles
c,
Tim
Hyde
c,
Richard
Smith
c,
Sergey
Nikitenko
b,
Wim
Bras
b and
Gopinathan
Sankar
*ac
aUniversity College London, Department of Chemistry, 20 Gordon Street, London, WC1H 0AJ, UK
bNetherlands Organization for Scientific Research (NWO), DUBBLE@ESRF, 6, rue Jules Horowitz, Grenoble 38000, France
cJohnson Matthey Technology Centre, Blounts Court, Sonning Common, Reading RG4 9NH, UK
First published on 1st November 2012
Abstract
In this paper, we report a detailed characterisation of chromium doped iron oxide catalysts using a range of techniques to establish the nature of chromium species in the near surface and bulk of iron oxide, high-temperature shift (HTS) catalysts. In particular we have employed X-ray absorption spectroscopy Cr K-edge near edge and extended fine structure data for comparison with chemical and X-ray photoelectron spectroscopy. There was excellent agreement between the techniques in terms of identification and quantification of Cr6+ and Cr3+ species as a function of calcination temperatures between 100 and 500 °C.
1. Introduction
Iron and copper based catalysts are widely used for the water–gas shift reactions in which steam and carbon monoxide are reacted to produce hydrogen and carbon dioxide. The operating temperatures for this reaction are between 300 and 450 °C.1–3 The majority of high-temperature shift catalysts contain small amounts of chromium oxide which acts as a stabiliser to prevent sintering and hence loss of surface area.4,5 While such benefits are realised using chromium oxide (Cr2O3) doping, Cr6+ can also be detected in addition to Cr3+ depending on catalyst preparation conditions. Although a number of studies have addressed the issue of Cr6+ and how to avoid its formation, the need remains for improved quantification and the ability to distinguish how Cr3+ and Cr6+ are distributed between surface and bulk sites.6–15Therefore, it is our aim in this paper to demonstrate the application of a combination of techniques to understand the bulk and near-surface structure of the HTS catalysts after different pre-treatments. Principally, we compare X-ray absorption spectroscopy (XAS) both near edge (XANES) and extended fine structure (EXAFS), with X-ray powder diffraction (XRD), X-ray photoelectron spectroscopy (XPS) and quantitative chemistry.
A quantitative wet chemical method does exist to accurately measure levels of Cr6+ in a Cr6+/Cr3+ mixture. However, this approach cannot discriminate between surface and bulk material.
X-ray diffraction methods are ideal for characterising the bulk solids, if they are crystalline, but not amorphous or poorly crystalline components.
Furthermore, it is also difficult to distinguish the electronic state of chromium ions in the material using this technique. XAS is an atom-specific technique, widely used in catalytic science to obtain local structure data on crystalline and amorphous materials, but once again this technique provides bulk rather than near-surface information. XPS is the ideal technique to gain near-surface information, in that it can distinguish oxidation states of the metal ions but not structural details and it can provide some quantitative information. Therefore, we have used a combination of all three X-ray techniques to determine local structure and composition of chromium 6+ and 3+ ions in the HTS catalysts as a function of pre-treatment conditions.
2. Experimental part
2.1. Catalyst preparation
The iron/chromium oxide catalyst precursors used in this study were prepared using a co-precipitation method. Briefly, iron and chromium nitrate (at a Fe/Cr molar ratio of 9.8) was dissolved in distilled water and precipitated by addition of aqueous sodium carbonate. The brown precipitate was aged under agitation at 70 °C for 1 h and washed to remove sodium impurities before separating into five batches for calcination. The five batches were subjected to 100, 200, 300, 400, 500 °C respectively with a 5 hour dwell time at target temperature.2.2. Catalyst characterization
Chemical extraction of the Cr6+ species was conducted by heating 3 g of the sample with 3 g of NaHCO3 in 150 ml of distilled water at 150 °C for 1 hour. The Cr6+ content of the resulting filtrate was determined by iodometric titration.7XRD data of HTS catalysts were collected using a Bruker AXS D8 diffractometer equipped with a 45 position sample changer and operating with Cu Kα radiation (nickel filtered) source. Room temperature scans of all the samples were performed from 10 to 130° 2θ with a step size of 0.02° using the θ/θ coupled scan mode. Data were processed using Bruker AXS Diffrac Plus, EVA V16 software and compared with the ICDD PDF files (PDF2, Release 2003) to identify the phases present in the catalysts.
The XAS spectra at Cr and Fe K-edges were measured at room temperature on the Dutch Belgium beam line (BM26A)16 at the ESRF using a water cooled Si(111) double crystal monochromator with the synchrotron ring operating in 16 bunch mode giving ∼60 mA electron current at 6 GeV energy. Higher harmonic rejection was performed using vertically focussing mirror that is installed after monochromator.16
Cr K-edge X-ray absorption spectra of all the samples were measured in the fluorescence mode because of low concentration of chromium species using Cr Kα fluorescence as a function of incident X-ray energy. XAS spectra were recorded employing a 9-element Ge detector. XAS data were acquired in step scans over a k range from 3 Å−1 to 12 Å−1 using k3 weighting for the counting time per data point increasing from 5 s at 3 Å−1 to 10 s at 12 Å−1. Fe K-edge data for HTS catalysts were recorded in transmission mode over a similar k-range. Three scans of each catalyst were recorded and averaged.
Data reduction and the curve fitting analysis of the extended X-ray absorption fine structure (EXAFS) data were performed in Athena17 and EXCURVE9818 respectively. Phase shifts and backscattering factors were calculated ab initio using Hedin–Lundqvist potentials. The EXAFS data were analysed using the single scattering wave approximation.19 Refinement was carried out with k3 weighting in the range 3.3 to 11.8 Å−1. The non-structural parameter AFAC (the amplitude reduction factor due to many electron processes) was extracted from EXAFS data of Cr and Fe foils. During refinement of foils EXAFS the coordination numbers for the first shell were fixed to crystallographic values. The best fit to data yielded AFAC 0.7 and 0.9 for Fe and Cr respectively. It is noteworthy that the refined coordination numbers in EXAFS are generated with 10–20% uncertainties20,21 and the individual errors obtained from the analysis are given in the tables. In addition, to determine the nature of chromium species and the amount of Cr6+ in the catalyst, principal component analysis (PCA) was performed on the near edge spectra (XANES) using model compounds, Cr2O3 and K2Cr2O7, representing Cr3+ and Cr6+ respectively. Each XANES of the catalysts was fitted to data from the Cr3+ and Cr6+ model compounds using Athena software.17
XPS measurements were carried out using a Thermo Fischer demonstration Escalab 250 operated with monochromatic aluminium Kα radiation as a 650 μm spot 200 W power. Samples were dusted onto conductive tape mounted on a sample stub. Charge compensation was provided by an argon ion in-lens flood gun at 20 V combined with an in-chamber flood source at ‘zero energy’ settings. Energy scales were corrected to the carbon 1s signal maxima (285 eV). Quantification was carried out by peak area measurements using curve fitting after background subtraction and applying sensitivity factors derived by Schofield.22
3. Results and discussion
XRD patterns recorded at room temperature (Fig. 1) reveal that the samples calcined at temperatures below 500 °C contains both amorphous and crystalline components, while the sample calcined at 500 °C appears to be highly crystalline. The crystalline component is identified as Fe2O3 (haematite) in all samples. There was no evidence of any significant X-ray peak shifts to confirm Fe/Cr/O solid solution formation or stoichiometric differences in any of these samples, as evidenced by the calculated lattice parameter data obtained through Rietveld analysis (TOPAS software). However, Cr3+ and Fe3+ ionic radii are very similar, both form α-alumina oxides structure and here Cr is very much the minority species. Furthermore, interatomic potential computational modelling has indicated ready solubility of Cr3+ in haematite.23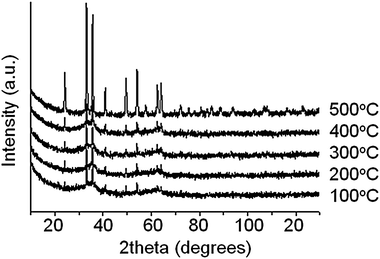 | ||
| Fig. 1 XRD patterns of HTS catalysts calcined at various temperatures. | ||
The results of quantitative chemical analysis are shown in Table 1. The data indicate that total Cr6+ levels are low for material calcined at 100 °C. The level then increases markedly up to 400 °C, when over 50% of the Cr appears to be Cr6+, and subsequently diminishes after heating to 500 °C. This variation with temperature is discussed alongside data from other techniques below.
| Calc. temp. (°C) | Bulk analysis | Surface analysis | |||
|---|---|---|---|---|---|
| Chemical | XANES | EXAFS | XPS | ||
| Cr6+/Cr3+ atom ratio | Total Cr/Feb | ||||
| a Too low to measure. b Bulk Cr/Fe formulation 0.11. | |||||
| 100 | 0.05 | a | a | a | 0.08 |
| 200 | 0.32 | 0.39 ± 0.02 | 0.37 ± 0.01 | 0.48 | 0.07 |
| 300 | 0.83 | 1.16 ± 0.01 | 1.00 ± 0.01 | 1.01 | 0.09 |
| 400 | 1.18 | 1.48 ± 0.01 | 1.50 ± 0.01 | 1.46 | 0.11 |
| 500 | 0.21 | 0.22 ± 0.02 | 0.30 ± 0.01 | 0.82 | 0.13 |
The results of XPS analysis, which are derived from the spectra in Fig. 2 by curve fitting, are shown Table 1. The spectra clearly indicate the presence of both Cr3+ (binding energy 576.8 eV) and Cr6+ (binding energy 579.4 eV) although the relative amounts vary strongly with calcination temperature. The ratio of Cr to Fe data in Table 1 suggest that total Cr at the surface slightly increase as a function of calcination temperature. This observation would be in agreement with the electron microscopy analysis by Edwards et al.,24 who measured composition variation from 6.3 ± 2.3 wt% at the centre of a catalyst grain to 10.7 ± 2.3 wt% at the edge. The Cr6+ concentration matches that measured by bulk chemical analysis with perhaps a slight surface excess up to 400 °C. After calcination at 500 °C the XPS data indicate a strong surface excess of Cr6+.
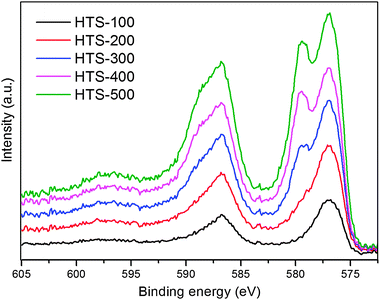 | ||
| Fig. 2 XPS data of the chromium containing iron oxide samples heated at various temperatures. We show here only the Cr 2p spectra and they were normalised and corrected using carbon 1s binding energy. | ||
X-ray absorption spectroscopy have been used extensively to characterise chromium containing catalysts.11–14 Normalized Cr K-edge XANES spectra recorded in the fluorescence mode for the chromium containing iron oxide catalysts are shown in Fig. 3 along with two model compounds, Cr2O3 and K2Cr2O7, representing Cr3+ and Cr6+ oxidation states respectively. The XANES spectra for the two model compounds containing Cr3+ and Cr6+ ions are distinctly different with the Cr2O3 data showing a pre-edge doublet (∼5994 eV) with very low intensity compared to K2Cr2O7 which has an intense single pre-edge peak. This latter feature has been reported in several publications and identified as a 1s–3d transition. Although this quadrupole transition is not allowed according to the selection rules, due to mixing of p and d states coupled with local coordination symmetry and density of unoccupied states, the transition becomes allowed. This pre-edge feature has been exploited as a signature identifying tetrahedral coordination geometry in a variety of do transition metals states in catalytic materials.25–29
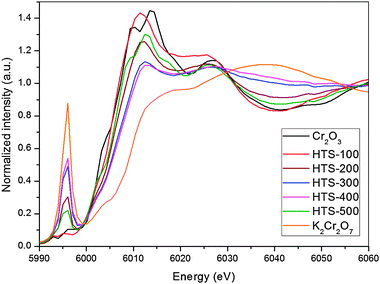
Comparison of the XANES for HTS-100 (dashed line) with that of the Cr2O3 model compound suggests that the chromium in the catalyst is similar to Cr2O3, in terms of local structure but it is important to remember it is not crystalline (Fig. 1) and Cr is only a minority dopant. The two small pre-edge features at 5993 eV and 5995 eV can be assigned to the 1s–3d(t2g) and 1s–3d(eg) electronic transitions respectively.29–32 The 2 eV separation of the Cr3+ pre-edge features agrees with 2–3 eV octahedral crystal field splitting between the t2g and eg levels measured for several Cr3+compounds in local octahedral coordination.30 However, the pre-edge XANES for the catalysts calcined above 100 °C are distinctly different to Cr2O3 in that they show the strong pre-edge feature indicating the presence of Cr6+ in widely varying amounts as a function of calcination temperature.
Quantification of the fluorescence XANES data was carried out using principal component analysis by taking Cr2O3 and K2Cr2O7 as model compounds to obtain the best linear combination fit. A typical fit to the catalyst data (HTS-500) is depicted in Fig. 4. The variation of the ratio of Cr6+ to Cr3+ derived by this method (Table 1) shows a similar pattern to that displayed by the results of bulk chemical analysis, i.e. a minimal amount of Cr6+ at 100 °C rising to a maximum at 400 °C and then dropping away after 500 °C calcination, when Cr6+ becomes unstable and reduces to Cr3+. This pattern of behaviour differs in one respect from that observed by XPS, which is a surface sensitive technique, in that the latter indicates a considerable excess of Cr6+ at the surface after calcination at 500 °C compared to the bulk. This suggests that surface Cr3+ re-oxides during cooling to room temperature.
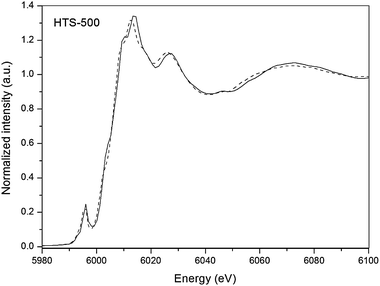 | ||
| Fig. 4 Cr K-edge fluorescence XANES of HTS-500 catalyst (solid line) and the fitted profile (dashed line) obtained by a linear combination least square fit to the Cr2O3 and K2Cr2O7 reference materials. | ||
In order to investigate further the scope for XAS methods to derive information on the occurrence of Cr6+, a second approach has been examined, the quantification of bulk transmission EXAFS data.
Fe K-edge and Cr K-edge EXAFS analysis Fig. 5 and 6 show the best fit between the calculated and experimental Fe K-edge and Cr K-edge EXAFS data respectively. The EXAFS fitting results for both Fe K-edge and Cr K-edge are summarized in Table 2. All the samples, except for the one heated at 500 °C, showed a large amorphous component by XRD in addition to some haematite. In order to determine whether the amorphous component also has similar local environment to that of the crystalline part, we analysed in detail the Fe K-edge EXAFS data of all the samples. The structural parameters obtained from Fe K-edge EXAFS data for HTS catalysts revealed that the structure of HTS-100 catalysts is very close to the haematite structure α-Fe2O3.33 The iron oxygen distances are found to be at RFe–O = 1.96 Å and RFe–O = 2.09 Å, and the iron–iron distances RFe–Fe = 2.89 Å, 3.05 Å, and 3.40 Å. These inter atomic distances are in very good agreement with the structure of haematite.33 The FeO6 octahedra in haematite share one face (RFe–Fe = 2.89 Å), three edges (RFe–Fe = 2.97 Å), three double corners (RFe–Fe = 3.37 Å) and six double corners RFe–Fe = 3.7 Å. The inter-atomic iron–oxygen distances of, RFe–O, and iron–iron, RFe–Fe, in HTS-200, -300, -400, -500 are similar to those in the crystal structure of haematite.
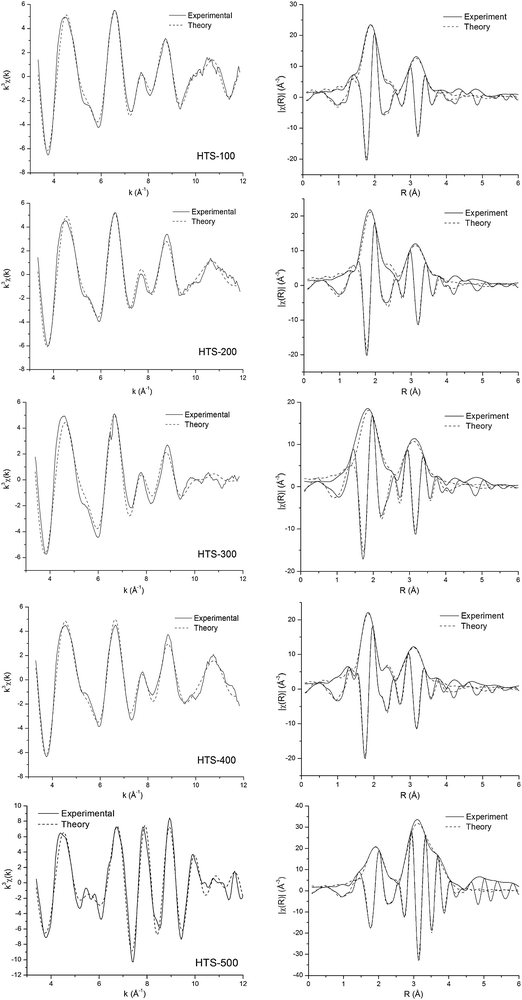 | ||
| Fig. 5 Fe K-edge EXAFS spectra analysed in k-space (after background subtraction, k3-weighted) of HTS catalysts together with corresponding Fourier transforms. The magnitude and imaginary part of Fourier transforms along with best fits are shown. The solid line is experimental data and the dashed line is the best fit. | ||
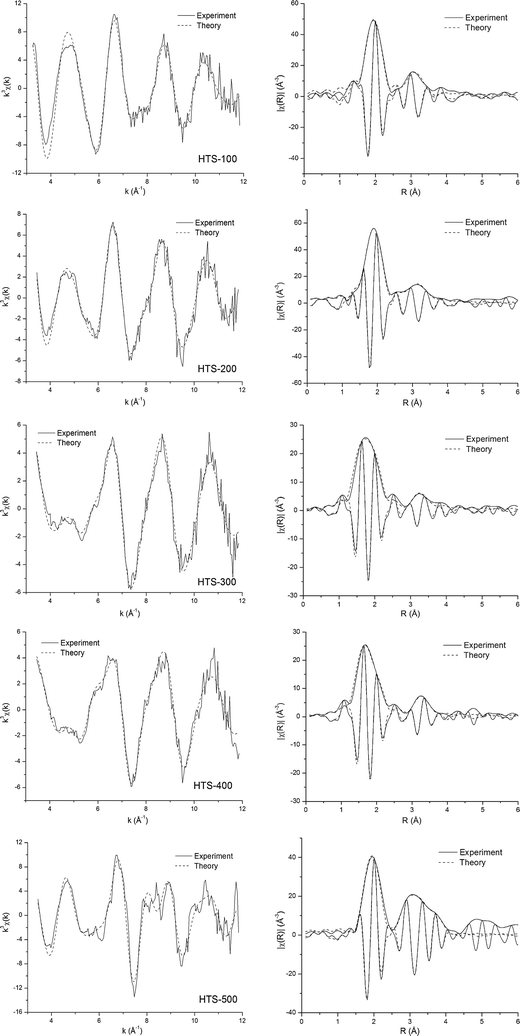 | ||
| Fig. 6 Cr K-edge EXAFS spectra analyzed in k-space (after background subtraction, k3-weighted) of HTS catalysts and Fourier transform of corresponding EXAFS spectra. The magnitude and imaginary part of Fourier transforms along with best fits are shown. The solid line is experimental data and the dashed line is the best fit. | ||
| Catalyst | Fe K-edge | Cr K-edge | ||||||||
|---|---|---|---|---|---|---|---|---|---|---|
| Scatt. | N | R (Å) | σ 2 (Å2) | R Fit | Scatt. | N | R (Å) | σ 2 (Å2) | R Fit | |
| HTS-100 | O | 3 | 1.96(1) | 0.004(1) | 16 | O | 6 | 1.98(1) | 0.005(1) | 25 |
| O | 3 | 2.09(1) | 0.012(3) | Fe(Cr) | 1 | 2.99(2) | 0.003(3) | |||
| Fe | 1 | 2.89(1) | 0.004(1) | Fe(Cr) | 3 | 3.11(9) | 0.012(1) | |||
| Fe | 3 | 3.05(1) | 0.007(1) | Fe(Cr) | 3 | 3.43(4) | 0.020(1) | |||
| Fe | 3 | 3.40(2) | 0.022(6) | |||||||
| HTS-200 | O | 4 | 1.95(1) | 0.005(1) | 19 | O | 1 | 1.64(1) | 0.003(1) | 23 |
| O | 2 | 2.14(1) | 0.005(1) | O | 4 | 1.98(1) | 0.005(1) | |||
| Fe | 1 | 2.92(1) | 0.005(2) | Fe(Cr) | 1 | 2.97(2) | 0.005(2) | |||
| Fe | 3 | 3.06(1) | 0.010(3) | Fe(Cr) | 3 | 3.13(2) | 0.012(4) | |||
| Fe | 3 | 3.41(1) | 0.016(3) | Fe(Cr) | 3 | 3.42(3) | 0.015(4) | |||
| HTS-300 | O | 2 | 1.89(1) | 0.004(2) | 28 | O | 2 | 1.64(1) | 0.004(1) | 22 |
| O | 3 | 2.03(1) | 0.007(3) | O | 3 | 1.98(1) | 0.005(1) | |||
| Fe | 1 | 2.89(2) | 0.007(3) | Fe(Cr) | 1 | 2.97(2) | 0.010(5) | |||
| Fe | 3 | 3.03(1) | 0.011(4) | Fe(Cr) | 2 | 3.14(2) | 0.014(7) | |||
| Fe | 3 | 3.38(2) | 0.016(5) | Fe(Cr) | 3 | 3.40(2) | 0.016(3) | |||
| HTS-400 | O | 4 | 1.95(1) | 0.005(1) | 18 | O | 2 | 1.64(1) | 0.004(1) | 20 |
| O | 2 | 2.15(1) | 0.004(1) | O | 2 | 1.98(1) | 0.004(1) | |||
| Fe | 1 | 2.90(1) | 0.005(2) | Fe(Cr) | 1 | 3.03(1) | 0.010(1) | |||
| Fe | 3 | 3.05(1) | 0.009(3) | Fe(Cr) | 2 | 3.38(1) | 0.014(3) | |||
| Fe | 3 | 3.38(1) | 0.017(4) | |||||||
| HTS-500 | O | 3 | 1.94(1) | 0.004(2) | 26 | O | 1 | 1.63(1) | 0.008(4) | 33 |
| O | 3 | 2.09(1) | 0.004(4) | O | 5 | 1.99(1) | 0.005(1) | |||
| Fe | 1 | 2.88(7) | 0.004(9) | Fe(Cr) | 3 | 2.96(1) | 0.008(3) | |||
| Fe | 3 | 2.97(3) | 0.004(4) | Fe(Cr) | 1 | 3.12(2) | 0.011(9) | |||
| Fe | 3 | 3.37(1) | 0.005(1) | Fe(Cr) | 3 | 3.40(2) | 0.007(4) | |||
| Fe | 3 | 3.68(1) | 0.005(2) | Fe(Cr) | 3 | 3.71(2) | 0.010(6) | |||
| K2Cr2O7 | O | 4 | 1.61(1) | 0.008(1) | 29 | |||||
| Cr | 1 | 3.14(1) | 0.004(2) | |||||||
| Cr2O3 | O | 6 | 1.99(1) | 0.005(1) | 39 | |||||
| Cr | 1 | 2.65(2) | 0.006(4) | |||||||
| Cr | 3 | 2.89(1) | 0.005(1) | |||||||
| Cr | 3 | 3.42(1) | 0.005(2) | |||||||
| Cr | 6 | 3.65(1) | 0.008(2) | |||||||
Before we analysed the Cr K-edge data of the catalysts, we tested the modelling procedure including calculated phase shift and amplitude factors by analysing in detail the two model compounds, K2Cr2O7 and Cr2O3. In K2Cr2O7 the chromium atom is surrounded by four tetrahedrally arranged oxygen atoms at a distance of RCr(VI)–O = 1.61 Å. The chromium–chromium distance was found to be at RCr(VI)–Cr = 3.14 Å. In Cr2O3 the chromium atom is surrounded by six octahedrally spaced oxygen atoms at RCr(III)–O = 1.99 Å; the chromium–chromium distances are RCr(III)–Cr = 2.65, 2.89, 3.42, 3.65 Å. The EXAFS fitting results for K2Cr2O7 and Cr2O3 are consistent with these reported structural models derived from XRD.
Comparison of the Fourier transforms of HTS-100, -200, -300, and -400 (Fig. 7) clearly show that the magnitude of the Fourier transform peaks corresponding to the Cr–O distance at ∼2 Å decreases with calcination temperature. These changes due to thermal treatment correspond to a partial transformation in the local atom environment from the octahedral Cr3+ to tetrahedral Cr6+ coordination as detected by XANES and supported by chemical and XPS analysis. Furthermore, Fig. 7 confirms that this process is reversed on heating to 500 °C, i.e. the level of Cr6+ is significantly reduced.
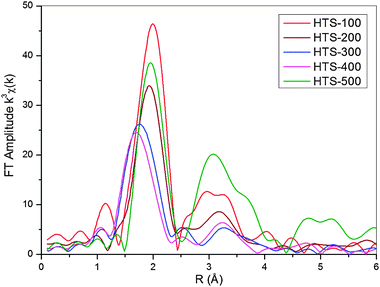 | ||
| Fig. 7 Fourier transforms of k3 weighted Cr K-edge EXAFS as a function of the atomic distance, R, for HTS catalysts calcined at various temperatures. | ||
While the EXAFS data in Fig. 5 for the Fe K-edge from the four largely amorphous materials, HTS-100, -200, -300 and -400 look broadly similar and obviously different to that for crystalline haematite (HTS-500), the Cr K-edge data look very different from one another. These structural changes in the local environment around Cr reflect the dramatic differences in relative amounts of Cr6+ and Cr3+ detected by other techniques as discussed above. The results of detailed curve fitting for the Cr K-edge EXAFS data are shown in Table 2. It is important to note when viewing Table 2 that it is not possible to distinguish Fe and Cr as backscatters since they have similar X-ray scattering power.
For HTS-100 the nearest neighbour oxygen shell can be fitted with a single octahedral shell with a Cr–O distance of 1.98 Å which is similar to Cr2O3 and close to the average value from the Fe K-edge in HTS-100. For the next nearest neighbour cations three shells were fitted following a similar pattern to the Fe K-edge in HTS-100 rather than Cr2O3, i.e. cations at 2.99 Å (1Fe), 3.11 Å (3Fe), and 3.43 Å (3Fe). The XANES data discussed above has already confirmed the sole presence of Cr3+ and these two results would suggest that Cr3+ substitutes for Fe3+ in the amorphous matrix in agreement with predictions from computational modelling.23
The Cr K-edge EXAFS fitting results for HTS-200, -300 and -400 indicate that it is necessary to have two Cr–O distances, one representing a short Cr–O distance of ∼1.64 Å (similar to K2Cr2O7) and the other with Cr–O distance of ∼1.98 Å, similar to Cr2O3. The results obtained for the short Cr–O distance is consistent with the Cr6+–O tetrahedral distance in K2Cr2O7 and the long Cr–O distance agrees with the octahedral distance found in Cr2O3. The variation in the relative number of O atoms in the two first shell sites reflects the changes in the relative amount of Cr6+ and Cr3+ as a function of calcination temperature. Indeed, the relative oxygen occupation in the two sites, tetrahedral and octahedral, can provide a quantitative estimate of the amount of the two Cr oxidation states as shown in Table 1. For the second shell of HTS-200 and -300 EXAFS fitting finds three cations atoms, one at a short distance of 2.97 Å and the other two/three at a longer distance of 3.13 Å plus three iron(chromium) atoms at 3.40 Å. This pattern is broadly similar to data for the Fe K-edge. While the next nearest neighbour cation shells are slightly different for HTS-200 and -300, the data for HTS-400 seems very different reflecting the large amount of Cr6+ compared to Cr3+ and the presence of tetrahedral geometry. However, the radii of the fitted cation shells match the average values derived for HTS-200 and -300, i.e. the overall structure is dominated by the Fe–O octahedral matrix.
HTS-500 has been already identified by XRD above as being crystalline haematite. It is not surprising therefore that EXAFS data for the Cr K-edge bears some resemblance to the Fe K-edge. However, a short Cr–O distance (1.63 Å) contribution to the EXAFS can be detected corresponding to the presence of Cr6+. XPS data discussed above indicates this oxidation state is located primarily at the surface.
4. Conclusions
Analysis of Cr doped Fe2O3 catalysts chemically and by XPS, XANES and EXAFS has revealed Cr3+ is the dominant species for the largely amorphous material calcined at 100 °C. However upon heating to 400 °C levels of Cr6+ increase markedly. There is excellent agreement between the four techniques in terms of identification and quantification of the relative levels of the two Cr species. On heating to 500 °C, when the material crystallises to form haematite, the Cr6+ also becomes unstable and reduces to Cr3+. XPS indicates that the residual Cr6+ after 500 °C calcination is located at the surface and is probably formed from re-oxidation of Cr3+ during a cooling to room temperature. However, total Cr/Fe ratio measured by XPS suggests that Cr3+ is doped into the haematite lattice. Importantly we have also shown that both principal component analysis of XANES data and modelling EXAFS data differentiating Cr6+ and Cr3+ oxygen distances provide good method of analysing mixed oxidation states.Acknowledgements
We thank EPSRC and NWO for funding and ESRF for the provision of beam time. GS thanks the Royal Society, UK for an Industry Fellowship. VM thanks to Martin Martis for his help during the beamtime.References
- L. Lloyd, D. E. Ridler and M. V. Twigg, Catalyst Handbook, ed. Wolfe Publishing, 2nd edn, 1989 Search PubMed.
- C. Ratnasamy and J. P. Wagner, Catal. Rev.: Sci. Eng., 2009, 51, 325 CAS.
- C. Rhodes, G. J. Hutchings and A. M. Ward, Catal. Today, 1995, 23, 43 CrossRef CAS.
- G. C. Chinchen, R. H. Logan and M. S. Spencer, Appl. Catal., 1984, 12, 89 CrossRef CAS.
- R. L. Keiski and T. Salmi, Appl. Catal., A, 1992, 87, 185 CrossRef CAS.
- F. Domka, A. Basinska and R. Fiedorow, Surf. Technol., 1983, 18, 275 CrossRef CAS.
- M. A. Edwards, D. M. Whittle, C. Rhodes, A. M. Ward, D. Rohan, M. D. Shannon, G. J. Hutchings and C. J. Kiely, Phys. Chem. Chem. Phys., 2002, 4, 3902 RSC.
- J. Y. Lee, D.-W. Lee, K.-Y. Lee and Y. Wang, Catal. Today, 2009, 146, 260 CrossRef CAS.
- P. Kappen, J.-D. Grunwaldt, B. S. Hammershøi, L. Tröger and B. S. Clausen, J. Catal., 2001, 198, 56 CrossRef CAS.
- G. Doppler, A. X. Trautwein, H. M. Ziethen, E. Ambach, R. Lehnert, M. J. Sprague and U. Gonser, Appl. Catal., 1988, 40, 119 CrossRef CAS.
- E. Groppo, C. Lamberti, S. Bordiga, G. Spoto and A. Zecchina, Chem. Rev., 2005, 105, 115 CrossRef CAS.
- E. Groppo, C. Prestipino, F. Cesano, F. Bonino, S. Bordiga, C. Lamberti, P. C. Thüne, J. W. Niemantsverdriet and A. Zecchina, J. Catal., 2005, 230, 98 CrossRef CAS.
- P. C. Thune, R. Linke, W. J. H. van Gennip, A. M. de Jong and J. W. Niemantsverdriet, J. Phys. Chem. B, 2001, 105, 3073 CrossRef.
- B. M. Weckhuysen, R. A. Schoonheydt, J.-M. Jehng, I. E. Wachs, S. J. Cho, R. Ryoo, S. Kijlstra and E. Poels, J. Chem. Soc., Faraday Trans., 1995, 91, 3245 RSC.
- M. Scariot, M. S. P. Francisco, M. H. Jordão, D. Zanchet, M. A. Logli and V. P. Vicentini, Catal. Today, 2008, 133–135, 174 CrossRef CAS.
- S. Nikitenko, A. M. Beale, A. M. J. van der Eerden, S. D. M. Jacques, O. Leynaud, M. G. O'Brien, D. Detollenaere, R. Kaptein, B. M. Weckhuysen and W. Bras, J. Synchrotron Radiat., 2008, 15, 632 CrossRef CAS.
- B. Ravel and M. Newville, J. Synchrotron Radiat., 2005, 12, 537 CrossRef CAS.
- N. Binsted and S. S. Hasnain, J. Synchrotron Radiat., 1996, 3, 185 CrossRef CAS.
- S. J. Gurman, N. Binsted and I. Ross, J. Phys. C: Solid State Phys., 1984, 17, 143 CrossRef CAS.
- K. Teo Boon, EXAFS: Basic Principles and Data Analysis, 1986 Search PubMed.
- G. Bunker, Introduction to XAFS: A Practical Guide to X-ray Absorption Fine Structure Spectroscopy, Cambridge University Press, 2010 Search PubMed.
- J. H. Scofield, J. Electron Spectrosc. Relat. Phenom., 1976, 8, 129 CrossRef CAS.
- S. Benny, Doctoral thesis (EngD), University College London (UCL), 2010 Search PubMed.
- M. A. Edwards, D. M. Whittle, C. Rhodes, A. M. Ward, D. Rohan, M. D. Shannon, G. J. Hutchings and C. J. Kiely, Phys. Chem. Chem. Phys., 2002, 4, 3902 RSC.
- F. Farges, G. E. Brown and J. J. Rehr, Geochim. Cosmochim. Acta, 1996, 60, 3023 CrossRef CAS.
- C. Kongmark, V. Martis, A. Rubbens, C. Pirovano, A. Lofberg, G. Sankar, E. Bordes-Richard, R.-N. Vannier and W. Van Beek, Chem. Commun., 2009, 4850 RSC.
- G. Sankar, J. M. Thomas and C. R. A. Catlow, Top. Catal., 2000, 10, 255 CrossRef CAS.
- F. Farges, Phys. Rev. B: Condens. Matter Mater. Phys., 2005, 71, 1 CrossRef.
- M. L. Peterson, J. G. E. Brown, G. A. Parks and C. L. Stein, Geochim. Cosmochim. Acta, 1997, 61, 3399 CrossRef CAS.
- R. G. Burns, Mineralogical applications of crystal field theory, Cambridge Univ. Press, 2nd edn, 1993, 7 Search PubMed.
- M. L. Peterson, G. E. Brown and G. A. Parks, MRS Proc., 1996, 432, 75 CrossRef.
- A. M. Beale, D. Grandjean, J. Kornatowski, P. Glatzel, F. M. F. de Groot and B. M. Weckhuysen, J. Phys. Chem. B, 2006, 110, 716 CrossRef CAS.
- R. L. Blake, R. E. Hessevick, T. Zoltai and L. W. Finger, Am. Mineral., 1966, 51, 123 CAS.
| This journal is © the Owner Societies 2013 |