Can post-plasma CH4 injection improve plasma-based dry reforming of methane? A modeling study
Matthias
Albrechts
 *,
Ivan
Tsonev
 and
Annemie
Bogaerts

Research group PLASMANT, Department of Chemistry, University of Antwerp, Belgium. E-mail: matthias.albrechts@uantwerpen.be
First published on 24th August 2024
Abstract
Thermal plasma-driven dry reforming of methane (DRM) has gained increased attention in recent years due to its high conversion and energy conversion efficiency (ECE). Recent experimental work investigated the performance of a pure CO2 plasma with post-plasma CH4 injection. The rationale behind this strategy is that by utilizing a pure CO2 plasma, all plasma energy can be used to dissociate CO2, while CH4 reforming proceeds post-plasma in the reforming reactor with residual heat, potentially improving the energy efficiency compared to injecting both CO2 and CH4 into the plasma. To assess whether post-plasma CH4 injection indeed improves the DRM performance, we developed a chemical kinetics model describing the post-plasma conversion process. We first validated our model by reproducing the experimental results of the pure CO2 plasma with post-plasma CH4 injection. Subsequently, we compared both strategies: injecting only CO2 inside the plasma while injecting CH4 post-plasma, vs. classical plasma-based DRM. Our modeling results indicate that below specific energy inputs (SEI) of 220 kJ mol−1, the total conversion slightly improves (ca. 5%) with the first strategy. However, the ECE is slightly lower due to the low H2 selectivity caused by substantial H2O formation. The highest conversion and ECE are obtained at SEI values of 240–280 kJ mol−1, where both strategies yield nearly identical results, indicating the limited potential of improving the performance of DRM by pure CO2 plasma with post-plasma CH4 injection. Nevertheless, the approach is still very valuable to allow higher CH4/CO2 ratios without problems of coke formation within the plasma, and thus, to improve plasma stability and reach higher syngas ratios, which is more useful for further Fischer–Tropsch or methanol synthesis.
1. Introduction
The urgent need to mitigate greenhouse gas emissions and stimulate sustainable energy solutions has led to the exploration of novel methodologies for CO2 utilization and CH4 conversion. Among these, plasma-based dry reforming of methane (DRM) proved to be a promising avenue, addressing the dual challenge of greenhouse gas reduction and sustainable synthesis of value-added products.1–3 In DRM, the reaction between CO2 and CH4 generates a mixture of H2 and CO, known as syngas, which can serve as a precursor for various industrial processes, like methanol synthesis4 and the Fischer–Tropsch process.5 Compared to alternative strategies for syngas synthesis, such as steam reforming of methane (SRM) and partial oxidation, DRM could save half of the CH4 consumption for the same amount of CO production by utilizing CO2 as well.2 Moreover, whereas SRM typically produces syngas with a H2/CO ratio of 3,6 thereby exceeding the requirements for methanol synthesis and the Fischer–Tropsch process,7 DRM provides more flexibility to adjust the syngas ratio by varying the CH4 to CO2 ratio,8 or by converting the CO with H2O into H2 and CO2 through an additional water–gas shift reaction.9Classical DRM is limited by severe coke formation, associated with the high temperatures needed to accommodate the strong endothermic process. The lack of commercial catalysts with sufficient resistance toward coke deposits has prevented DRM from being applied on a large scale.2 To address this limitation, the combination of non-thermal plasma, particularly dielectric barrier discharges (DBD), with a catalyst has gained considerable attention in recent years.1–3,10 Indeed, the unique non-equilibrium between gas and electrons in DBD can overcome the thermodynamic barrier in the DRM reaction, enabling DRM to occur at ambient conditions.11 In addition, the process only requires electricity and can be instantly switched on and off, making it adaptable to irregular and intermittent renewable energy supply.12
Despite these advantages, a DBD plasma faces challenges, such as high energy costs and low energy efficiency, preventing it from achieving competitiveness with classical DRM.2,3 Besides DBD, various other types of plasma reactors for DRM have been investigated in recent decades.3,12 While promising results have been obtained, many plasma reactors exhibit limited performance due to a significant portion of the feed gas bypassing the plasma, particularly evident in gliding arc (GA) plasma, resulting in limited conversion and energy efficiency.7 Snoeckx and Bogaerts3 introduced a target maximum energy cost of 4.27 eV per molecule for plasma technology to be competitive with classical DRM and other emerging technologies. According to their analysis, only a spark13 and an atmospheric pressure glow discharge (APGD)14 were able to achieve energy costs below this target while maintaining relatively high conversions. Subsequent studies in literature have reported additional plasma reactor configurations meeting this maximum energy cost criterion and having high total conversion (>70%), including a GA setup,15 a confined APGD reactor,7 and four microwave (MW) plasma reactors.8,16–18
These recent studies highlight the potential of MW plasma setups for DRM, reporting excellent conversion and energy efficiency.8,16–18 In addition to its impressive performance, a MW plasma offers the advantage of operating without electrodes, thereby avoiding electrode erosion, which can otherwise compromise operational longevity and introduce impurities into the plasma.19 The highest reported energy efficiency, as reported by Sun et al.,16 reaches 71%, with CO2 and CH4 conversion of 91% and 96%, respectively. Sun et al.16 developed a model to support their experimental findings, consisting of two series of continuous stirred tank reactors (CSTRs) that exchange heat and mass, representing the plasma stream and surrounding stream. Their modeling results reveal that the reforming proceeds as the surrounding gas enters and diffuses out of the plasma stream due to the flow mixing, explaining the remarkably high conversion, considering that only a limited fraction of the gas passes through the plasma. It is worth noting that the maximum energy efficiency associated with thermal conversion is ca. 90%, as will be discussed in section 4.1 below. Hence, the best energy efficiency achieved so far, 71%,16 still stays significantly below the theoretical thermal limit. This discrepancy can be attributed to various factors, such as heat losses in the reactor, possibly suboptimal mixing of the hot plasma stream with the surrounding stream, the tendency of MW plasma to overshoot the temperature required to achieve complete conversion, and the slow DRM reaction kinetics, which restricts the conversion within the limited reactor residence time. Hence, while the energy efficiency of 71%16 is already remarkable, further enhancements can possibly be achieved by optimizing the reactor design.
Cho et al.17 reported that their plasma extinguishes when they used a CH4/CO2 molar ratio of 1, due to the generation of carbon particles in the MW reactor, which was also noted in ref. 20. To generate stable plasma, Cho et al.17 opted to segregate the supply of CH4 from the discharge gas (CO2) by injecting CH4 at the end of the discharge. This approach offers several advantages. As demonstrated in their experiments,17 injecting CH4 post-plasma enables to use a higher molar ratio of CH4/CO2, as the discharge is no longer susceptible to plasma instability caused by soot formation, leading to higher syngas ratios (H2/CO) that are better suited for the synthesis of value-added products.7 We note however that by optimising the reactor design and discharge conditions, it is also possible to achieve a higher molar ratio of CH4/CO2 while maintaining plasma stability and reducing susceptibility to soot formation. Indeed, two other vortex stabilised MW plasma setups8,16 obtained good plasma stability for a 1![[thin space (1/6-em)]](https://www.rsc.org/images/entities/char_2009.gif) :
:![[thin space (1/6-em)]](https://www.rsc.org/images/entities/char_2009.gif) 1 CH4/CO2 ratio within a similar flow rate (ca. 10–30 L min−1) and SEI range (ca. 100–300 kJ mol−1). Furthermore, Biondo et al.21 were able to reach even higher CH4 fractions, up to pure CH4 feed gas, by adopting a reverse vortex flow configuration for their MW plasma at a pressure of 100 mbar. They observed that the strong convective core-periphery transport characterising the reverse vortex flow configuration significantly reduces the formation and growth of solid carbon precursors, and inhibits their deposition at the reactor walls. Finally, Jasiński et al.22 were able to reach a 2
1 CH4/CO2 ratio within a similar flow rate (ca. 10–30 L min−1) and SEI range (ca. 100–300 kJ mol−1). Furthermore, Biondo et al.21 were able to reach even higher CH4 fractions, up to pure CH4 feed gas, by adopting a reverse vortex flow configuration for their MW plasma at a pressure of 100 mbar. They observed that the strong convective core-periphery transport characterising the reverse vortex flow configuration significantly reduces the formation and growth of solid carbon precursors, and inhibits their deposition at the reactor walls. Finally, Jasiński et al.22 were able to reach a 2![[thin space (1/6-em)]](https://www.rsc.org/images/entities/char_2009.gif) :
:![[thin space (1/6-em)]](https://www.rsc.org/images/entities/char_2009.gif) 1 CH4/CO2 ratio in their MW plasma, possibly due to the high gas flow rate of 150 L min−1, stimulating the removal of carbon particles from the discharge.
1 CH4/CO2 ratio in their MW plasma, possibly due to the high gas flow rate of 150 L min−1, stimulating the removal of carbon particles from the discharge.
In addition to the advantage of circumventing discharge instability by injecting CH4 post-plasma, we assume that the tangential flow injection at the end of the discharge will create a more turbulent stream, improving the mixing between the plasma stream and the surrounding stream, thereby heating the surrounding stream and enabling conversion of the gas that did not pass through the plasma, which was proven to drive the overall conversion in ref. 16. Lastly, the authors of ref. 17 claim that the main advantage of their method is the increase in energy consumption selectivity, in which the energy injected through the plasma decomposes only CO2 rather than CH4, yielding higher CO2 conversion and higher syngas energy conversion efficiency (ECE) compared to other methods.
Rephrasing the hypothesis of ref. 17: when pure CO2 is injected into the plasma, all plasma power goes into heating and dissociation of CO2. In contrast, when a mixture of CO2/CH4 is fed to the plasma, some plasma power is absorbed by CH4, which is more easily dissociated, and less power goes to CO2, resulting in less CO2 dissociation. Since CH4 dissociates at lower temperatures due to the weaker C–H bonds than C![[double bond, length as m-dash]](https://www.rsc.org/images/entities/char_e001.gif) O bonds, it may be better to inject it post-plasma, as the CH4 reforming can proceed in the reforming reactor with residual heat, yielding the most energy-efficient process.
O bonds, it may be better to inject it post-plasma, as the CH4 reforming can proceed in the reforming reactor with residual heat, yielding the most energy-efficient process.
In this work, we aim to examine whether directing all the energy into CO2 by injecting CH4 post-plasma indeed leads to better total conversion, syngas selectivity and ECE. We focus on a CO2/CH4 molar ratio of 1, excluding higher ratios that would yield higher syngas ratios, to maintain a manageable scope for this study. To address this research question, we have developed a 0D chemical kinetics model that can interpret the post-plasma gas conversion process occurring when the effluent of a thermal plasma mixes with a gas stream injected post-plasma. We first validate our model by reproducing the experimental results of ref. 17. Subsequently, we conduct conceptual kinetic simulations to explore the potential benefits of selectively injecting all the plasma energy into CO2, by examining the total conversion, syngas selectivity and ECE.
2. Model description
To gain insight in the experimental results of ref. 17, we developed a 0D chemical kinetics model in the framework of the Chemical Reaction Engineering module of COMSOL Multiphysics.23 The model solves the 0D mass balance equations for a batch reactor, given by: | (1) |
| H2 | H | O | O2 | OH | H2O | HO2 | H2O2 |
| C | CH | CH2 | CH2(s) | CH3 | CH4 | CO | CO2 |
| HCO | CH2O | CH2OH | CH3O | CH3OH | C2H | C2H2 | C2H3 |
| C2H4 | C2H5 | C2H6 | HCCO | CH2CO | HCCOH | C3H7 | C3H8 |
| CH2CHO | CH3CHO |
The reactor volume is adjusted to keep a constant pressure, balancing variations in temperature and number density:
 | (2) |
The initial composition within the simulation represents the CO2 plasma composition at the end of the discharge, i.e. right before CH4 injection, which accounts only for a limited fraction of the total CO2 flow. Indeed, since a MW plasma is strongly contracted at atmospheric pressure,25 only a limited fraction of the CO2 passes through the plasma and is heated to high plasma temperatures. For simplicity, we approximate the CO2 discharge as a plasma stream with a constant plasma temperature (Tp) and a surrounding stream that is preheated to 800 K (Tpre), as in the experiments of ref. 17. While the authors of ref. 17 measured the temperature in the reforming reactor, they did not determine the temperature of the CO2 plasma itself. However, D'Isa et al.25 performed temperature measurements of their CO2 plasma under similar conditions (MW plasma trapped in vortex flow) and found that at atmospheric pressure, the plasma temperature is approximately 6000 K, regardless of the specific energy input (SEI), with the plasma volume increasing with SEI.25 Hence, for all SEI values considered in this work, we assume Tp equal to 6000 K. Based on the SEI (J mol−1), which is an input parameter to our model, we calculate the ratio of the molar flow rate of the plasma stream to the molar flow rate of the surrounding stream, determining the molar ratio of hot CO2 plasma (Tp) to the surrounding CO2 gas (Tpre), according to:
 | (3) |
In eqn (3), xp represents the molar fraction of hot CO2 plasma, i.e. the ratio of the molar flow rate of the plasma stream to the total CO2 flow rate, and HCO2 is the enthalpy of pure CO2 gas (J mol−1). At the plasma temperature of 6000 K, CO2 is nearly completely dissociated and in chemical equilibrium. Therefore, the initial composition of the simulation, representing the CO2 plasma zone, corresponds to the chemical equilibrium composition of CO2 at 6000 K (ca. 50% O, 49% CO and 1% C (ref. 26)). In eqn (3), HCO2, eq represents the enthalpy of the CO2 equilibrium mixture (J mol−1), and neq is a factor that accounts for the increase in number of particles of the dissociated chemical equilibrium mixture.
When CH4 is injected post-plasma, CH4 (300 K) and CO2 (Tpre) will mix with the hot CO2 plasma stream (Tp) in the reforming reactor. We model the mixing of the gases by adding CH4 (300 K) and CO2 (Tpre) to the simulation volume, containing only the hot CO2 equilibrium mixture (Tp) at the start of the simulation. Thus, we consider diffusive mass transfer from the surrounding CH4 and CO2 (Tpre) stream to the inner hot gas stream, but we neglect diffusion from the latter to the surrounding stream. In this way, we can describe the system in a single kinetic simulation, assuming that conversion does not occur in the cold surrounding stream due to slow reaction kinetics.
We introduce a mixing rate Rm (mol s−1) that determines the rate at which the gases mix in the reforming reactor, i.e. how fast CH4 and CO2 (Tpre) are added to the simulation. Therefore, the mixing rate is a source term (Rm/Vr) in the species rate expression (cf. Ri in eqn (1)), representing the diffusive mass transfer from the surrounding stream to the simulation volume. Approximating the cold gas in the surrounding stream as gas contained in a volume with plane-parallel geometry and length R (radius of the reforming reactor), where the density is 0 at boundary x = R, the lowest-order diffusion solution yields an exponential decay of the average gas density:27
| n(t) = n0e−t/τ0 | (4) |
 | (5) |
 | (6) |
 the characteristic mixing time. Note that the expression above integrates to ntot for t → ∞. The molar ratio of CH4 to CO2 (Tp) and of CO2 (Tpre) to CO2 (Tp), determining ntot for CH4 and CO2, is equal to
  and
and  , respectively.
The temperature of the gas mixture is calculated in the heat-balance equation:
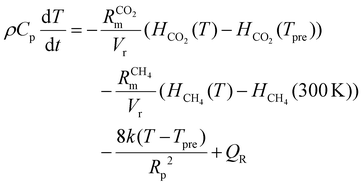 | (7) |
 .
.
The above model description applies to the experiments of ref. 17, used for our model validation. However, the model used later in this paper, for studying the performance of CO2 plasma with post-plasma CH4 injection and comparing it with classical plasma-based DRM, is slightly different, as will be explained in section 4 below.
To evaluate the performance of the DRM process, a wide variety of performance metrics exists in literature.28 In this work, we will focus on the CO2 and CH4 conversion (χCO2, χCH4), the CO and H2 selectivity (SCO, SH2), the total conversion χtot and the energy conversion efficiency (ECE) η, to asses the potential of post-plasma CH4 injection. Note that the ECE is also called simply “energy efficiency”, but we prefer the term ECE, because the expression accounts for the energy captured in CH4 (high enthalpy) and evaluates how efficiently this energy, along with the applied power, is converted into the energy captured by syngas.
These performance metrics are calculated as follows:
| χtot = xCO2χCO2 + xCH4χCH4 | (8) |
 | (9) |
 | (10) |
 | (11) |
 | (12) |
 , where
  is the number of moles of CO2 added post-plasma (cf.eqn (6)), and [CO2]f denotes the final molar concentration of CO2, respectively. Similar notations apply to the other species. Similarly, V0 and Vf represent the volume at the start and end of the simulation, respectively. They are required in the equations to account for gas expansion upon reaction, because more molecules are formed after than before the reaction,28 and because of a change in temperature upon reaction. Lastly, LHVCO, LHVH2 and LHVCH4 are the low heating values of CO, H2 and CH4, respectively.
3. Model validation
We first model the experimental conditions of ref. 17 to validate our model, and we direct interested readers to consult17 for a comprehensive description of the reactor configuration. Specifically, we try to reproduce the measured CO2 conversion χCO2 and CH4 conversion χCH4, as well as CO selectivity SCO and H2 selectivity SH2, across the SEI range of 122–245 kJ mol−1. In order to compare the performance of the current process to other DRM processes, the SEI is evaluated as the plasma power over the total gas flow rate, i.e. 30 slm CO2 flow rate plus 30 slm CH4 flow rate, as used in ref. 17. For SEI = 122 kJ mol−1, we set the characteristic mixing time τmix equal to 0.01 s. This value corresponds to an effective diffusivity of 1.2 × 10⁻³ m2 s−1, which lies within the same order of magnitude as the value of 8–16 × 10−3 m2 s−1 reported by Sun et al.,16 when modelling the mixing of the plasma stream with the surrounding stream in the post-plasma region of their DRM experiments with a similar MW setup. Since the average gas temperature increases with rising SEI and the diffusion constant is proportional to T3/2 according to gas kinetic theory, we increase D by a factor of 1.5 (hence τmix = 6.67 × 10⁻³ s) for SEI = 245 kJ mol−1, and linearly interpolate D for intermediate SEIs. This drop in characteristic mixing time allows better agreement with the experimental results of ref. 17 compared to keeping a constant value of 0.01 s for τmix across the SEI range.Fig. 1(a) shows the comparison between model calculations and experimental measurements for the CO2 and CH4 conversion as a function of SEI. The experimental χCO2 is perfectly captured by the model across the complete SEI range. While the χCH4 predicted by the model also follows the experimental trend, the values slightly exceed those measured in the experiment. The greatest relative deviation occurs at the lowest SEI of 122 kJ mol−1, where χCH4 = 39% predicted by the model compared to χCH4 = 32% in the experiment. Considering the model's simplicity and general experimental uncertainties, we find the agreement between model and experiment regarding χCO2 and χCH4 satisfactory.
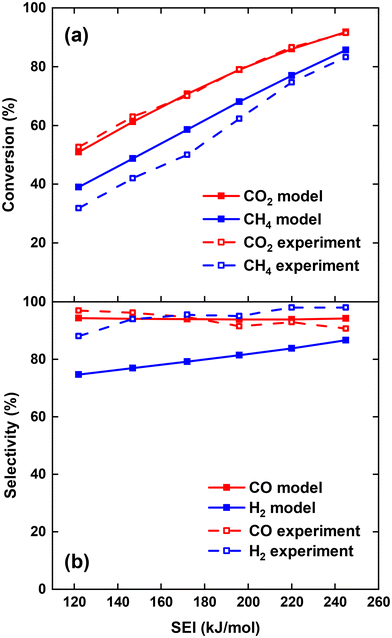 | ||
| Fig. 1 Comparison of CO2 and CH4 conversion (a) and CO and H2 selectivity (b) between model and experiment,17 as a function of the SEI. | ||
The CO and H2 selectivity predicted by the model and measured in the experiment are shown in Fig. 1(b). The CO selectivity agrees well between model and experiment, with a maximal deviation of 3.5% at SEI = 245 kJ mol−1. In contrast, SH2 predicted by the model is significantly lower (ca. 15%) than the values obtained in the experiment. This discrepancy is primarily due to the substantial generation of H2O in the model calculations compared to the lower quantities observed experimentally. For instance, at SEI = 245 kJ mol−1, the model predicts an H2O molar fraction of 4.5%, whereas H2O was reported to account for less than 0.1% of the total product mixture in the experimental setup.
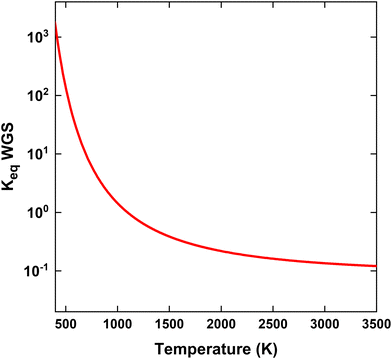
Although the absolute values for SH2 predicted by the model are too low, the rising trend of SH2 with increasing SEI in the experiment (75% to 87%) is also captured by the model (88% to 99%). This trend can be attributed to the higher temperatures reached at higher SEI values (T > 2000 K), leading to faster reaction kinetics for the conversion of H2O. Indeed, H2O is thermodynamically unfavoured above temperatures of 1200 K.29 Consequently, at higher SEI levels, more H2O will be converted to H2 within the limited residence time of the reactor, yielding a higher H2 selectivity.
Using the GRI-Mech 3.0 mechanism,24 we were unable to reproduce the experimental H2 selectivity within the existing framework of our model. This suggests that either the GRI-Mech 3.0 mechanism may not be ideally suited for our specific conditions, or that multi-dimensional effects play a role in this setup, which are not adequately accounted for in our 0D model. Therefore, we implemented the thermal chemistry set from ref. 30 to examine whether a higher H2 selectivity could be achieved using a different DRM reaction mechanism. However, the results for χCO2, χCH4, SCO and SH2 are consistent within 4% between both chemistry sets, suggesting that the discrepancy between model and experiment for SH2 might not be due to the gas-phase chemistry used in our model.
Note that Cho et al.17 calculated the mass balance for H and C to determine the fraction of H2O and solid C, respectively, which could not be measured in the GC. However, considering the H2O concentration derived in this manner, they found that O atoms were missing in the O mass balance.31 Therefore, they hypothesised that the missing O might be due to oxidation reactions of the stainless steel reactor walls at high temperatures.31 Unfortunately, our global model cannot account for these surface processes. If oxidation of the reactor walls indeed absorbs a significant amount of O atoms, it could explain the discrepancy in H2 selectivity between our model and the experiment. However, we cannot rule out the second option, that a substantial amount of H2O is formed in the experiment, as predicted by our model, which was not detected in ref. 17. In fact, this would also explain the missing O atoms in the O mass balance. Indeed, other DRM experiments in literature do report H2O formation as major by-product (e.g., ref. 7, 20 and 32–34). Nevertheless, despite the discrepancy in H2 selectivity, our model predicts the experimental trend, and we assume that we correctly capture the H2O formation in the DRM process when oxidation of the reactor walls is not important.
4. Can post-plasma CH4 injection improve the DRM performance?
After obtaining reasonable agreement with experiment,17 we now evaluate whether injecting all plasma energy into CO2, with post-plasma CH4 injection, effectively leads to improved CO2 conversion and ECE.4.1. DRM equilibrium calculation
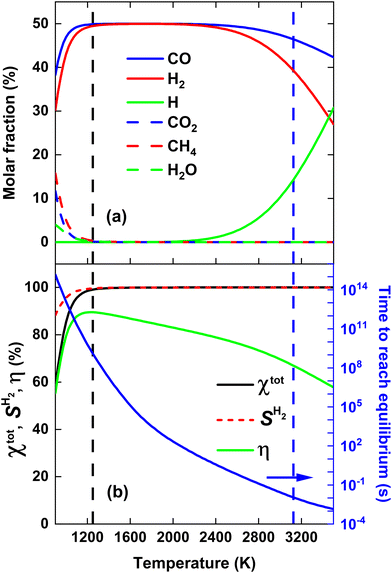
Before evaluating the performance of post-plasma CH4 injection, it is useful to first calculate the DRM equilibrium, because the latter allows us to determine the maximum ECE achievable for thermal conversion, under the assumption that we do not recover the residual heat. Indeed, by comparing the performance of a specific DRM process with this thermal limit, we can assess the potential for further process improvements. Fig. 2(a) illustrates the molar fractions of the dominant species for the thermodynamic equilibrium of a CO2/CH4 mixture with a molar ratio of 1, across the temperature range 900–3500 K. The total conversion (χtot), hydrogen selectivity (SH2) and ECE (η) are plotted in Fig. 2(b) across the same temperature range. The equilibrium was determined by running the GRI-Mech 3.0 mechanism until the concentrations of all dominant species remained constant for an extended duration (1015 s). Since all reverse processes are calculated from the equilibrium constant, this ensures the correct thermodynamic equilibrium composition. The time required to reach equilibrium (right y-axis) is determined as the point in time when the concentrations of all dominant species deviate less than 0.001% from their final value, i.e., the final timestep of the simulation where all concentrations remained constant for an extended duration.It is clear from Fig. 2(a) that the equilibrium largely shifts towards CO and H2, which exhibit molar fractions around 50% in most of the temperature range, while CO2 and CH4 are only present (with molar fractions of 10 and 15%) around 900 K. Note however, that the time to reach this equilibrium is very long in the lower temperature range (cf.Fig. 2(b)), so in practice, at realistic residence times, there will still be considerable amounts of CO2 and CH4 in the mixture. At 900 K, there is also about 5% H2O present, while above 2400 K, the H molar fraction starts to rise, upon dissociation of H2, as follows indeed from the molar fraction of the latter.
Fig. 2(b) illustrates that both χtot and SH2 > 99% for temperatures above 1200 K. SCO is not plotted, as it is close to 100% across the entire temperature range of 900–3500 K. Hence, the syngas yield is determined by SH2. Notably, the CO2/CH4 mixture yields 99% syngas already at an average gas temperature of 1250 K (indicated by the black dashed line in Fig. 2), corresponding to η = 89.5%. However, as mentioned above, reaching equilibrium at these temperatures takes more than 109 s (see right y-axis in Fig. 2(b)). To reach equilibrium within a more realistic reactor residence time of 10 ms, an average gas temperature of 3125 K is required (indicated by the vertical blue dashed line in Fig. 2), corresponding to η = 67%, close to η = 71.3% reported by Sun et al.,16 where CH4 and CO2 were injected directly into the plasma.
The slow equilibrium attainment at lower temperatures is attributed to the slow CO2 dissociation process at these temperatures, which requires breaking the highly stable C![[double bond, length as m-dash]](https://www.rsc.org/images/entities/char_e001.gif) O bond.30 Hence, one way to potentially lower the SEI required for reaching a given syngas yield is by accelerating the CO2 dissociation process. This could potentially be achieved by injecting all the plasma energy into CO2, while reforming CH4 at lower temperatures with residual heat, effectively treating more CO2 at higher temperatures for the same SEI compared to directly heating the complete CO2/CH4 mixture in the plasma, as we will study in detail in the next section.
O bond.30 Hence, one way to potentially lower the SEI required for reaching a given syngas yield is by accelerating the CO2 dissociation process. This could potentially be achieved by injecting all the plasma energy into CO2, while reforming CH4 at lower temperatures with residual heat, effectively treating more CO2 at higher temperatures for the same SEI compared to directly heating the complete CO2/CH4 mixture in the plasma, as we will study in detail in the next section.
4.2. Effect of post-plasma CH4 injection
To verify whether directing all the plasma energy into CO2 can improve the syngas yield and energy efficiency, we compare both strategies, i.e. (i) injecting only CO2 inside the plasma while injecting CH4 post-plasma, vs. (ii) injecting both CH4 and CO2 inside the plasma. To conduct this comparison, we perform two conceptual kinetic simulations, assuming uniform plasma heating and neglecting any heat losses at the wall. As it is a conceptual study, this simplification aims to ensure transparent simulation results and general modeling insights, by not focusing on plasma contraction and heat losses specific to the experimental setup of a certain plasma reactor. We note that by considering uniform plasma heating, we are effectively modeling a global diffuse plasma rather than a contracted plasma.This modeling approach differs from the one detailed in section 2 that was used to simulate the experiments of ref. 17, as explained in the paragraph below. To ensure the most representative comparison, in scenario (ii), we inject half of the 1![[thin space (1/6-em)]](https://www.rsc.org/images/entities/char_2009.gif) :
:![[thin space (1/6-em)]](https://www.rsc.org/images/entities/char_2009.gif) 1 CO2/CH4 mixture into the plasma and the other half of the 1
1 CO2/CH4 mixture into the plasma and the other half of the 1![[thin space (1/6-em)]](https://www.rsc.org/images/entities/char_2009.gif) :
:![[thin space (1/6-em)]](https://www.rsc.org/images/entities/char_2009.gif) 1 CO2/CH4 mixture post-plasma. In this way, the SEI within the plasma, i.e. the ratio of plasma power over the discharge gas flow rate, is the same for both strategies.
1 CO2/CH4 mixture post-plasma. In this way, the SEI within the plasma, i.e. the ratio of plasma power over the discharge gas flow rate, is the same for both strategies.
At the start of the simulation, the simulation volume contains the discharge gas at room temperature, which is pure CO2 for case (i) and 50% of the 1![[thin space (1/6-em)]](https://www.rsc.org/images/entities/char_2009.gif) :
:![[thin space (1/6-em)]](https://www.rsc.org/images/entities/char_2009.gif) 1 CO2/CH4 mixture for case (ii). Next, the discharge gas is heated over a heating period theat of 5 ms, as this is a typical gas residence time in atmospheric pressure MW plasmas.35 The power is calculated from the applied SEI (kJ mol−1):
1 CO2/CH4 mixture for case (ii). Next, the discharge gas is heated over a heating period theat of 5 ms, as this is a typical gas residence time in atmospheric pressure MW plasmas.35 The power is calculated from the applied SEI (kJ mol−1):
 | (13) |
After the 5 ms heating period, the power is set to zero, and the gas injected post-plasma, i.e. pure CH4 for case (i) and the other half of the 1![[thin space (1/6-em)]](https://www.rsc.org/images/entities/char_2009.gif) :
:![[thin space (1/6-em)]](https://www.rsc.org/images/entities/char_2009.gif) 1 CO2/CH4 mixture for case (ii), is added to the simulation, representing the mixing with the gas injected post-plasma (as explained in section 2). We set the characteristic mixing time equal to 2.71 ms (cf.eqn (4) and (5)). This corresponds to a total mixing time of 10 ms, which is a reasonable estimate for the reaction time in a reforming reactor based, on our modeling results for the conditions described in ref. 17. After the total mixing time of 10 ms, 99% of the gas has been added to the simulation. Subsequently, the gas mixture is immediately quenched to 300 K, simulating its exit from the reactor. For simplicity, we assume instant quenching since our calculations indicate that the quenching rate has a negligible impact on the syngas yield. Thus, the heat-balance equation is formulated as follows:
1 CO2/CH4 mixture for case (ii), is added to the simulation, representing the mixing with the gas injected post-plasma (as explained in section 2). We set the characteristic mixing time equal to 2.71 ms (cf.eqn (4) and (5)). This corresponds to a total mixing time of 10 ms, which is a reasonable estimate for the reaction time in a reforming reactor based, on our modeling results for the conditions described in ref. 17. After the total mixing time of 10 ms, 99% of the gas has been added to the simulation. Subsequently, the gas mixture is immediately quenched to 300 K, simulating its exit from the reactor. For simplicity, we assume instant quenching since our calculations indicate that the quenching rate has a negligible impact on the syngas yield. Thus, the heat-balance equation is formulated as follows:
 | (14) |
 | (15) |
| t > 15 ms: T = 300 K | (16) |
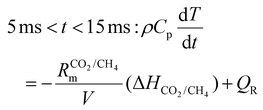
Fig. 3 illustrates the calculated temperature profile over time for both strategies, considering an SEI of 200 kJ mol−1. Initially, up to t = 5 ms, the temperature rises due to the applied power, reaching its maximum temperature of T = 3325 K for the CO2 plasma and T = 3200 K for the CO2/CH4 plasma. Subsequently, the temperature declines due to mixing with the cold gas injected at the end of the discharge, as illustrated in Fig. 3. At t = 15 ms, the temperature immediately drops to 300 K, quenching the product mixture. In case of the CO2 plasma (i), the temperature shows a relatively linear increase up to 2800 K, beyond which the endothermic CO2 dissociation starts contributing significantly, as seen by the sudden drop in the slope of the temperature profile. Conversely, in case of the CO2/CH4 plasma (ii), the temperature profile exhibits a kink at a lower temperature of 1800 K since the dissociation of CH4 has a much lower reaction barrier, becoming significant at much lower temperatures.
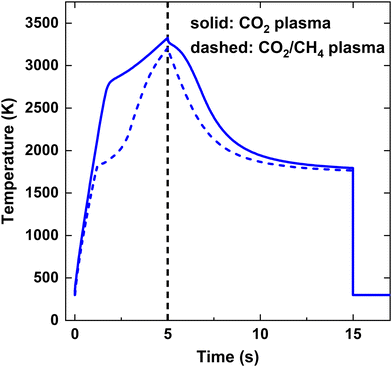 | ||
| Fig. 3 Gas temperature as a function of time for SEI = 200 kJ mol−1. The black vertical dashed line at t = 5 ms indicates the onset of post-plasma injection. | ||
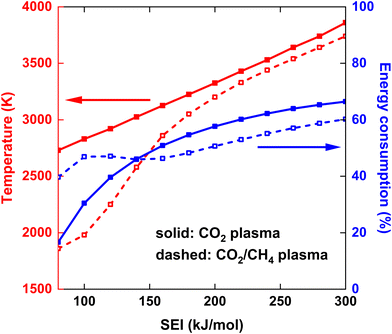
The maximum gas temperature Tmax at t = 5 ms is plotted in Fig. 4 for both strategies, across the SEI range of 80–300 kJ mol−1. We note that by assuming uniform gas heating, the global temperature is lower than the temperature of the hot CO2 plasma filament (6000 K) used in modeling the experimental conditions of ref. 17, within a similar SEI range, since we are no longer modeling a contracted plasma. In addition to the maximum temperature, the fractional energy consumption Ec (%) is plotted on the right y-axis in Fig. 4, defined as the fraction of plasma power absorbed in chemical reactions:
 | (17) |
At lower SEI values, the CO2/CH4 plasma reaches significantly lower maximum temperatures compared to the CO2 plasma (see Fig. 4). For instance, at SEI = 100 kJ mol−1, Tmax = 2730 K for the CO2 plasma and Tmax = 1980 K for the CO2/CH4 plasma. This difference can be attributed to two factors. First, the CO2/CH4 mixture has a higher average heat capacity, due to the higher heat capacity of CH4 compared to CO2. Second, the energy absorbed in endothermic processes is higher for the CO2/CH4 mixture. Indeed, CH4 is efficiently dissociated at temperatures below 2000 K, and the created H atoms accelerate the CO2 dissociation process, since the reaction CO2 + H ⇌ CO + OH has a significantly lower energy barrier than the reaction CO2 + M ⇌ CO + O + M, i.e. Ea = 105 kJ mol−1vs. Ea = 542 kJ mol−1,24 respectively, resulting in relatively high CO2 and CH4 conversion even at the lower SEI values. For example, at the end of the plasma, before post-plasma injection, at SEI = 100 kJ mol−1, χCO2 = 53% and χCH4 = 87% for the CO2/CH4 plasma (conversion of reactants relative to the amount of discharge gas) compared to χCO2 = 20% for the CO2 plasma. This is also clear from the (fractional) energy consumption, which is higher for the CO2/CH4 plasma than for the CO2 plasma (see blue curves in Fig. 4).
Notably, at higher SEI values (SEI > 140 kJ mol−1), the energy consumption becomes higher for the CO2 plasma compared to the CO2/CH4 plasma (see again blue curves in Fig. 4). The reason is that CO2 dissociation is more efficient at these elevated temperatures (T > 3000 K), allowing more energy to be stored in the strongly endothermic CO2 dissociation process. Indeed, ΔH298 K = 283 kJ mol−1 for CO2 + M ⇌ CO + O + M compared to ΔH298 K = 247 kJ mol−1 for CO2 + CH4 ⇌ 2CO + 2H2, and twice the amount of CO2 is present in the pure CO2 plasma. Nonetheless, Tmax remains higher for the CO2 plasma across the complete SEI range due to the lower heat capacity of CO2.
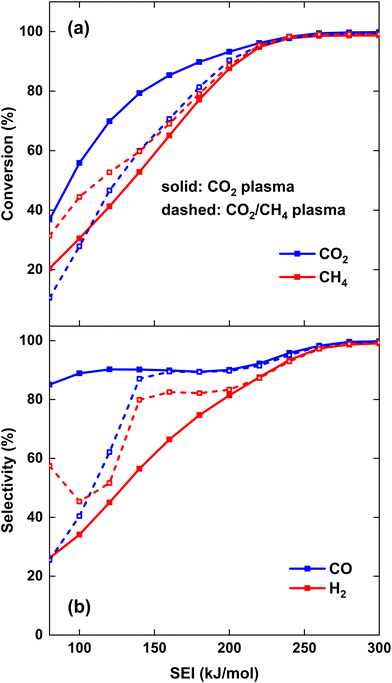
To compare the performance of both strategies, the CO2 and CH4 conversion and CO and H2 selectivity are plotted in Fig. 5(a) and (b), respectively. Fig. 5(a) illustrates that at lower SEI, the CO2 conversion is significantly higher for strategy (i), i.e., CO2 plasma with post-plasma CH4 injection, e.g. at SEI = 100 kJ mol−1, χCO2 = 56% compared to χCO2 = 28% for strategy (ii), i.e., CO2/CH4 plasma with post-plasma CO2/CH4 injection. This confirms our hypothesis defined above, because in strategy (i) all plasma power goes into heating and dissociation of CO2, while in strategy (ii) some plasma power is absorbed by CH4, resulting in less CO2 dissociation. Note, however, that the majority of the CO2 conversion for strategy (i) occurs behind the plasma upon CH4 injection, since CO2 conversion within the plasma is limited by the dissociation equilibrium of pure CO2 gas, which will be discussed in section 4.3.1 below.
Conversely, the CH4 conversion is higher for strategy (ii) at lower SEI, which is also in line with our hypothesis, because some CH4 is already converted inside the plasma, while in strategy (i) the CH4 conversion only takes place post-plasma. However, the difference between both strategies is less pronounced compared to the CO2 conversion, e.g. at SEI = 100 kJ mol−1, χCH4 = 44% for strategy (ii) compared to χCH4 = 31% for strategy (i). The difference in CO2 and CH4 conversion between both strategies decreases at higher SEI, with both strategies yielding approximately the same values for χCO2 and χCH4 at SEI values above 220 kJ mol−1, reaching very good conversions above 95%. Clearly, at high enough SEI, the injection method does not matter, because the temperature behind the plasma is high enough for conversion of both CH4 and the CO2/CH4 mixture injected post-plasma.
As depicted in Fig. 5(b), both SCO and SH2 are much lower than 100% at lower SEI values (<200 kJ mol−1) for both strategies, indicating that significant amounts of byproducts are formed in the DRM process. The main byproducts are C2H2 and H2O, with molar fractions around 1–8% and 1–14%, respectively, while C2H4 is the next most prominent byproduct, having a molar fraction below 0.5% across the complete SEI range. While the CO selectivity remains above 85% even at the lowest SEI values for the CO2 plasma with post-plasma CH4 injection (i), SCO is significantly lower at the lowest SEI values for the CO2/CH4 plasma with post-plasma CO2/CH4 injection (ii), e.g. at SEI = 100 kJ mol−1, SCO = 40%. The low CO selectivity is due to the substantial formation of C2H2 in the CO2/CH4 plasma at the lowest SEI values, as will be discussed in section 4.3.1 below. However, for SEI > 140 kJ mol−1, CO2 dissociation becomes more favourable in the CO2/CH4 plasma, and SCO is approximately the same for both strategies. At SEI values below 120 kJ mol−1, the H2 selectivity is rather low (SH2 < 65%) since significant amounts of H2O and C2H2 are formed in both strategies. In contrast to the CO selectivity, SH2 is higher for the CO2/CH4 plasma compared to the CO2 plasma. The reason is that a substantially larger amount of H2O is formed in the CO2 plasma with post-plasma CH4 injection, as will be discussed in section 4.3 below. However, similar to the conversion, both strategies yield approximately the same SCO and SH2 values at SEI values above 220 kJ mol−1, achieving 99% syngas selectivity at SEI = 280 kJ mol−1.
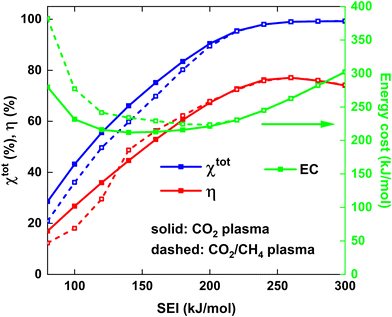
Fig. 6 shows χtot and η (left y-axis), as well as the energy cost (EC) of the conversion (right y-axis) as a function of the SEI for both strategies. At lower SEI values (<200 kJ mol−1), the total conversion is slightly higher for the CO2 plasma with post-plasma CH4 injection (i), because the increase in CO2 conversion outweighs the lower CH4 conversion compared to the CO2/CH4 plasma with post-plasma CO2/CH4 injection (ii) (see Fig. 5(a) above).
The EC is a metric for evaluating how much energy is needed for converting the reactants, particularly with the goal of energy-efficient removal of greenhouse gases. Since it is equal to the SEI divided by χtot, the EC will be slightly lower for the CO2 plasma with post-plasma CH4 injection for SEI < 200 kJ mol−1. The minimum EC of 212 kJ mol−1 for strategy (i) is reached at SEI = 140 kJ mol−1, corresponding to χtot = 66%, while a slightly higher minimum EC of 224 kJ mol−1 is reached at SEI = 200 kJ mol−1 for strategy (ii), corresponding to χtot = 89%. Although the model suggests that injecting all the energy into CO2 can slightly reduce the EC by about 5% due to enhanced CO2 conversion at lower SEI, this reduction is not particularly significant. Furthermore, the ECE is a more critical metric for evaluating the DRM process, as it measures how efficiently syngas can be produced, which is the key objective for DRM and crucial for industrial applications.18
The trend of the ECE is more complicated. Below SEI values of 140 kJ mol−1, η is slightly higher for strategy (i), due to the higher values for χCO2 and SCO, and the product of both defines the amount of CO formed (cf.eqn (12) above). However, for SEI > 140 kJ mol−1, η becomes slightly higher for strategy (ii), due to the strong increase in CO selectivity and significantly higher SH2 values (cf.Fig. 5(b)), resulting in higher values for η despite the lower total conversion. Finally, since the CO2 and CH4 conversion and CO and H2 selectivity are approximately the same for SEI values above 220 kJ mol−1, the ECE is also nearly identical in this SEI range, reaching its maximum value of 77% at 260 kJ mol−1.
Remarkably, since the best performance, characterised by high conversion and ECE, is obtained at high SEI values where both strategies yield identical results, our model suggest that there is no strong advantage of considering a pure CO2 plasma with post-plasma CH4 injection. Indeed, the hypothesis that post-plasma CH4 injection results in better syngas yield and ECE holds only in the suboptimal SEI range below 140 kJ mol−1, characterised by low conversion and low ECE. Our conclusion is also supported by the reported ECE values in literature, where the value of 67% reported by Cho et al.17 is among the highest values reported in literature due to the high thermal efficiency of their particular setup, but it does not exceed the value of 71% reported by Sun et al.,16 where CO2 and CH4 are injected directly into the plasma.
We note however that post-plasma CH4 injection might still be advantageous to increase the CH4/CO2 ratio, by mitigating discharge instability caused by soot formation, associated with high CH4 fractions within the plasma. This could potentially lead to higher syngas ratios, more appealing for industrial applications.
4.3. Kinetic analysis
To gain insight into the DRM process, we perform a kinetic analysis and evaluate how the species react over time. In particular, we aim to explain why the first strategy, i.e. (i) injecting only CO2 inside the plasma while injecting CH4 post-plasma, fails to enhance the ECE with respect to the second strategy, i.e. (ii) injecting half of the 1![[thin space (1/6-em)]](https://www.rsc.org/images/entities/char_2009.gif) :
:![[thin space (1/6-em)]](https://www.rsc.org/images/entities/char_2009.gif) 1 CO2/CH4 mixture inside the plasma and the other half of the same mixture post-plasma, within the SEI range of 140–200 kJ mol−1 (section 4.3.1), and why both strategies are equivalent in the optimal SEI range above 240 kJ mol−1 (section 4.3.2).
1 CO2/CH4 mixture inside the plasma and the other half of the same mixture post-plasma, within the SEI range of 140–200 kJ mol−1 (section 4.3.1), and why both strategies are equivalent in the optimal SEI range above 240 kJ mol−1 (section 4.3.2).
In contrast, at SEI = 140 kJ mol−1, there is a sharp increase in SCO and SH2 for strategy (ii) (cf.Fig. 5(b) above), since the O atoms resulting from CO2 dissociation will now primarily oxidise CH4 to CO. The reason is that, in contrast to SEI < 140 kJ mol−1, enough energy is present to convert C2H2 and H2O, formed during the reforming process, to CO and H2, as indicated in Fig. 7, which is discussed below. As a result, the ECE of strategy (ii) slightly exceeds that of strategy (i) for SEI > 140 kJ mol−1, as observed in Fig. 6 above.
Fig. 7 depicts the evolution of the CO2 and CH4 conversion over time (a), as well as the molar fractions of H2O and C2H2 (b). The conversion is calculated as the amount of reactant consumed relative to the total amount of reactant supplied to the system, encompassing both the discharge gas and the gas injected post-plasma. Therefore, the time-dependent conversion χ(t) is calculated for strategies (i) and (ii) as:
(i)
 | (18) |
 | (19) |
(ii)
 | (20) |
 represents the initial density of CO2/CH4 present in the simulation, i.e. the discharge gas, and nCO2/CH4 represents the actual density present at time t. Finally, Rm is the mixing rate, defined by eqn (6) above.
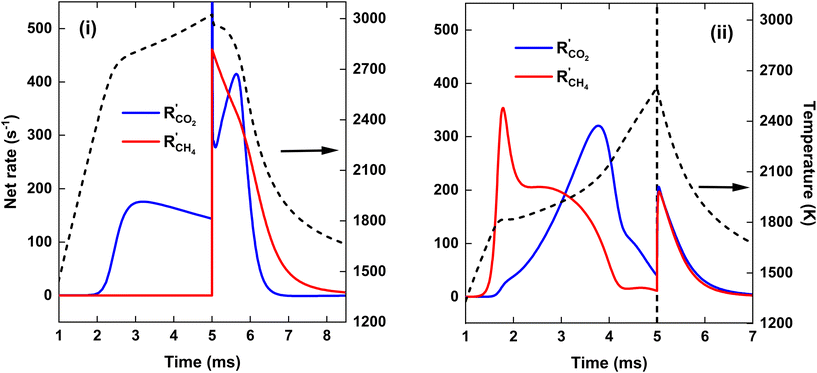
To explain the evolution of the CO2 and CH4 conversion shown in Fig. 7(a), we plot the net rates of conversion for CO2 and CH4, i.e. the sum of all individual reaction rates, in Fig. 8. To account for the change in simulation volume V over time (due to gas expansion upon reaction and rise in temperature), we scale the net volumetric reaction rate Ri of reactant i (CO2/CH4) by multiplying it with the actual V, and then divide this product by the number of moles of reactant i present in the simulation, i.e., the initial molar density ni,0 times V0, to render the rate value independent of the system size, i.e., the initial volume V0:
 | (21) |
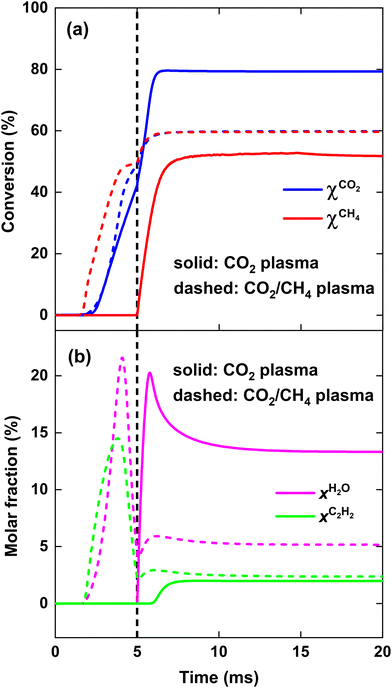
Fig. 7(a) illustrates that at the end of the discharge (t = 5 ms), a maximum CO2 conversion of 42% is reached for the CO2 plasma, corresponding to the dissociation equilibrium of CO2 at Tmax = 3020 K (cf. black dashed line in Fig. 8, panel (i)). Subsequently, upon post-plasma CH4 injection, the hot CO2 equilibrium mixture, i.e., O, O2 and CO2, reacts with CH4 at the elevated post-plasma temperatures. As a result, the CO2 conversion sharply increases (cf.Fig. 7(a)), reaching a maximum value of 80%, after which the net rate of CO2 conversion becomes negligible due to the slow reaction kinetics around T = 1800 K (cf.Fig. 8(i)). Hence, the higher overall CO2 conversion in scenario (i) (cf.Fig. 5 above) is not due to higher conversion inside the plasma (as it is even a bit lower than in scenario (ii); cf.Fig. 7(a)), but due to the additional CO2 conversion post-plasma upon reacting with CH4, as also mentioned in section 4.2 above.
Cho et al.17 mentioned that the O2 resulting from CO2 dissociation in the CO2 plasma reacts with the CH4 injected downstream. Since the oxidation of CH4 by O2 is an exothermic reaction with a low energy barrier, CH4 can be efficiently oxidized by O2 post-plasma using residual heat at a lower temperature. However, achieving complete CO2 conversion within the plasma requires very high SEI values, e.g., at SEI = 300 kJ mol−1, the CO2 conversion reaches 92% by the end of the plasma. At intermediate SEI values, a substantial amount of unreacted CO2 must react with CH4 downstream, requiring much higher temperatures due to the lower reactivity of CO2 compared to O2, similar to strategy (ii). Consequently, the total conversion for strategy (i) is only slightly higher (ca. 5%) than for strategy (ii) at SEI < 220 kJ mol−1.
Fig. 7(b) illustrates that when the hot CO2 gas mixes with CH4, CH4 is initially completely converted to CO due to the presence of reactive oxygen species (O2 and O atoms) resulting from CO2 dissociation, as indicated by the absence of C2H2 formation for t < 6 ms. Since most of the oxygen is used in the oxidation of CH4, the CH4 conversion at t = 6 ms, approximately 37%, is close to the CO2 conversion of 42% in the plasma. Notably, the CO2 conversion at t = 6 ms is around 75%, which is significantly higher than the conversion at the end of the plasma, suggesting the generation of new reactive oxygen for CH4 oxidation. However, most of the CO2 at t < 6 ms is converted to CO and H2O via the water–gas shift reaction (cf. section 4.3.3), as is clear from the substantial increase in the H2O fraction shown in Fig. 7(b). Consequently, no additional reactive oxygen is created in this manner, which explains the formation of C2H2 after t = 6 ms.
For strategy (ii), CO2 is almost completely converted in the CO2/CH4 plasma, corresponding to χCO2 = 49%, considering that only half of the total CO2 flow passes through the plasma. When the remaining half of the 1![[thin space (1/6-em)]](https://www.rsc.org/images/entities/char_2009.gif) :
:![[thin space (1/6-em)]](https://www.rsc.org/images/entities/char_2009.gif) 1 CO2/CH4 mixture is injected, the CO2 conversion rises to its maximum value of 60%, after which, similar to case (i), the CO2 conversion freezes around T = 1800 K (cf.Fig. 8(ii)).
1 CO2/CH4 mixture is injected, the CO2 conversion rises to its maximum value of 60%, after which, similar to case (i), the CO2 conversion freezes around T = 1800 K (cf.Fig. 8(ii)).
We stress that the total amount of CO2 converted within the plasma is actually higher for the CO2/CH4 plasma, despite the lower temperature and only half of the CO2 being present, compared to the pure CO2 plasma. This can be attributed to the presence of CH4 that strongly shifts the equilibrium mixture to CO at lower temperatures compared to a pure CO2 mixture, and the accelerated CO2 dissociation due to the presence of H atoms. However, for strategy (i), when CH4 is injected after the CO2 plasma, the CO2 conversion sharply increases and surpasses that of strategy (ii), i.e. χCO2 = 80% compared to χCO2 = 60%, respectively. This is due the fact that for strategy (i), all the remaining CO2 that was not converted within the plasma is reacting at the high afterglow temperature upon CH4 injection, resulting in rapid CO2 dissociation kinetics, as seen in Fig. 8(i), i.e. R′CO2 = 410 s−1 at t = 5.6 ms. In contrast, for strategy (ii), the CO2 entering the simulation due to mixing with the plasma stream after post-plasma injection on average reacts at a lower temperature since the plasma afterglow is cooler (cf.Fig. 8) due to the colder plasma and the previous mixing with the incoming cold gas.
For SEI = 140 kJ mol−1, the pure CO2 plasma yields better CO2 conversion, as more CO2 is heated to the elevated plasma temperatures compared to case (ii), where half of the CO2 is injected post-plasma. However, there is not enough residual heat to facilitate sufficient CH4 reforming, since a maximum CH4 conversion of 53% is reached around T = 1700 K (cf.Fig. 8), beyond which the CH4 dissociation freezes. Moreover, as shown in Fig. 7(b), a large amount of H2O is formed in the plasma afterglow (up to 20%), resulting in the low H2 selectivity of 56% (cf.Fig. 5(b)). For strategy (ii), a higher CH4 conversion of 60% is achieved, since half of the CH4 is completely converted within the discharge, and ca. 20% of the CH4 injected post-plasma (equivalent to 10% of the total CH4) can be converted with residual heat. Moreover, as illustrated in Fig. 7(b), strategy (ii) produces only 5% H2O, almost a factor 3 lower than in strategy (i), resulting in the significantly higher H2 selectivity of 80% (cf.Fig. 5(b)). The disparity in H2O production between the two strategies can be attributed to the equilibrium of the water–gas shift reaction, which will be discussed in detail in section 4.3.3.
Although the pure CO2 plasma with post-plasma CH4 injection yields higher CO2 conversion for SEI values under 220 kJ mol−1, resulting in slightly higher total conversion with respect to strategy (ii), the H2 selectivity is significantly lower due to substantial H2O formation. As a result, the ECE is lower for the pure CO2 plasma with post-plasma CH4 injection within the SEI range of 140–200 kJ mol−1 (cf.Fig. 6). Therefore, our model suggests that it is not possible to improve the performance of the DRM process by considering a pure CO2 plasma with post-plasma CH4 injection, within this SEI range of 140–200 kJ mol−1. Furthermore, Fig. 6 indicates that the optimal performance, characterized by high conversion and ECE, is achieved at SEI values between 240–280 kJ mol−1, where both strategies yield identical results.
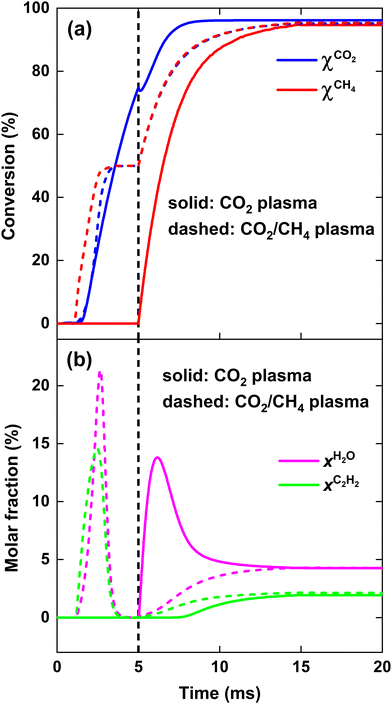
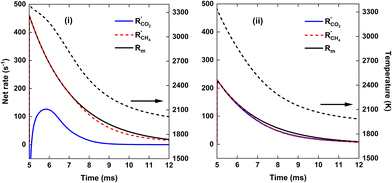
As is clear from Fig. 9, for strategy (i), in contrast to the previous case at SEI = 140 kJ mol−1, enough residual heat is present to almost completely convert the CH4 injected post-plasma, yielding χCH4 = 95%. Indeed, the temperature post-plasma is above 3000 K in the first 1.5 ms, and only drops below 2000 K after 7 ms post-plasma (cf.Fig. 10, panel (i)), while at 140 kJ mol−1, the temperature post-plasma drops below 2000 K already after 2 ms for strategy (i) and after 1 ms for strategy (ii) (cf.Fig. 8, panel (i)). The nearly 100% CH4 conversion is also clear from Fig. 10(i), where the rate of CH4 addition due to mixing is nearly balanced by the net rate of CH4 conversion (cf. black solid and red dashed line). Similarly, at this high SEI of 220 kJ mol−1, strategy (ii) also achieves near-complete conversion of CO2 and CH4 since enough residual heat is present to convert the other 50% of the 1![[thin space (1/6-em)]](https://www.rsc.org/images/entities/char_2009.gif) :
:![[thin space (1/6-em)]](https://www.rsc.org/images/entities/char_2009.gif) 1 CO2/CH4 mixture post-plasma. This is again illustrated in Fig. 10(ii), where the net rates of CO2 and CH4 conversion closely match their rate of addition due to mixing.
1 CO2/CH4 mixture post-plasma. This is again illustrated in Fig. 10(ii), where the net rates of CO2 and CH4 conversion closely match their rate of addition due to mixing.
We stress again that high SEI values above 220 kJ mol−1 are needed for the pure CO2 plasma to have complete conversion of CH4 downstream. However, at these SEI values, the DRM kinetics are fast enough to also completely convert the 1![[thin space (1/6-em)]](https://www.rsc.org/images/entities/char_2009.gif) :
:![[thin space (1/6-em)]](https://www.rsc.org/images/entities/char_2009.gif) 1 CO2/CH4 mixture injected post-plasma for strategy (ii). Consequently, our modeling results indicate that it is not possible to improve the ECE of the DRM process by using a pure CO2 plasma with post-plasma CH4 injection.
1 CO2/CH4 mixture injected post-plasma for strategy (ii). Consequently, our modeling results indicate that it is not possible to improve the ECE of the DRM process by using a pure CO2 plasma with post-plasma CH4 injection.
The reason is that the H2O fraction follows the equilibrium of the water–gas shift (WGS) reaction:
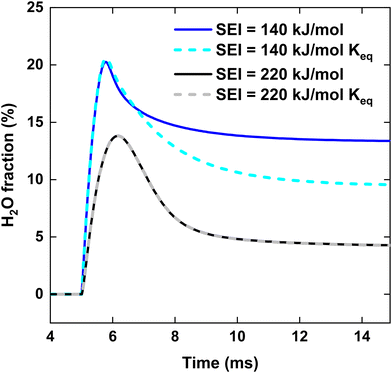
We now explain the H2O formation, determining SH2, for strategy (i) and (ii) at 140 and 220 kJ mol−1, by means of the WGS equilibrium. For strategy (i), comparing Fig. 9(b)–7(b), the H2O fraction reaches a lower maximum value at SEI = 220 kJ mol−1, with xH2O = 14% for SEI = 220 kJ mol−1vs. xH2O = 20% for SEI = 140 kJ mol−1. The lower H2O fraction at SEI = 220 kJ mol−1 is due to the substantially higher CO2 conversion compared to SEI = 140 kJ mol−1, outweighing the lower value for Keq associated with the higher afterglow temperature. In addition to the lower maximum H2O fraction at SEI = 220 kJ mol−1, H2O is able to react away more effectively, yielding a significant lower final H2O fraction of 4% compared to xH2O = 13% for SEI = 140 kJ mol−1. When CH4 is injected after the CO2 plasma, the H2O fraction initially increases until it reaches its maximum value, after which it decreases due to dilution of the H2O fraction through CH4 addition, as well as further conversion of CO2 to CO and the cooling of the gas mixture, which shifts the WGS equilibrium to CO2 and H2. The reason that the decline in H2O fraction is much smaller at SEI = 140 kJ mol−1 is that the mixture cools to temperatures where the kinetics of the WGS reaction are too slow (T < 1800 K; cf.Fig. 8(i)), effectively freezing the H2O concentration. Indeed, the drop in H2O fraction is mainly due to dilution. This is illustrated in Fig. 12, where the calculated H2O fraction as a function of time decouples from the theoretical H2O fraction predicted by the WGS equilibrium around t = 7 ms, in contrast to the case of SEI = 220 kJ mol−1 where the calculated H2O fraction perfectly aligns with the equilibrium prediction.
For strategy (ii), Fig. 7(b) and 9(b) illustrate that H2O reacts away at the end of the plasma and is slowly formed during the reforming of CH4 when the cold 1![[thin space (1/6-em)]](https://www.rsc.org/images/entities/char_2009.gif) :
:![[thin space (1/6-em)]](https://www.rsc.org/images/entities/char_2009.gif) 1 CO2/CH4 mixture is added post-plasma, reaching a final value of xH2O = 5% and xH2O = 4% for SEI = 140 kJ mol−1 and SEI = 220 kJ mol−1, respectively. For SEI = 140 kJ mol−1, following the WGS equilibrium, H2O is almost completely converted near the end of the plasma, since near-complete conversion of CO2 is achieved inside the plasma, as seen in Fig. 7(a) and (b). However, in contrast to the WGS equilibrium that predicts a high final H2O fraction of 28% due to the relatively low CO2 conversion of 60%, the H2O fraction reaches a rather low value of 5% after complete addition of the cold CO2/CH4 mixture. Indeed, similar to the injection of cold CH4 after the CO2 plasma (i), the WGS reaction kinetics quickly get frozen when the gas mixture cools down due to mixing with the cold CO2/CH4 mixture, explaining the low final H2O fraction.
1 CO2/CH4 mixture is added post-plasma, reaching a final value of xH2O = 5% and xH2O = 4% for SEI = 140 kJ mol−1 and SEI = 220 kJ mol−1, respectively. For SEI = 140 kJ mol−1, following the WGS equilibrium, H2O is almost completely converted near the end of the plasma, since near-complete conversion of CO2 is achieved inside the plasma, as seen in Fig. 7(a) and (b). However, in contrast to the WGS equilibrium that predicts a high final H2O fraction of 28% due to the relatively low CO2 conversion of 60%, the H2O fraction reaches a rather low value of 5% after complete addition of the cold CO2/CH4 mixture. Indeed, similar to the injection of cold CH4 after the CO2 plasma (i), the WGS reaction kinetics quickly get frozen when the gas mixture cools down due to mixing with the cold CO2/CH4 mixture, explaining the low final H2O fraction.
From the discussion above, it is clear why the CO2 plasma with post-plasma CH4 injection (i) yields a significantly lower SH2 at lower SEI (<200 kJ mol−1) compared to the CO2/CH4 plasma with post-plasma CO2/CH4 injection (ii). For strategy (ii), most of the H2O formed during the reforming process within the plasma is decomposed due to the high CO2 and CH4 conversion at the end of the plasma. When the cold CO2/CH4 mixture is injected post-plasma, the mixture cools down and the CO2 concentration will eventually increase since there is insufficient heat to immediately convert the added CO2 gas. Consequently, the H2O concentration will increase according to the WGS equilibrium. However, at these temperatures where the rate of CO2 conversion is significantly lower than the rate of CO2 addition due to mixing (T < 2000 K), the kinetics of the WGS reaction are also too slow to follow the WGS equilibrium. As a result, the H2O fraction will slightly increase during the reforming process post-plasma, but is frozen at a relatively low concentration. In contrast, for strategy (i), a substantial amount of H2O is formed during the reforming process following post-plasma CH4 injection, since a significant fraction of CO2 remains after the CO2 plasma due to incomplete conversion within the plasma at lower SEI (<200 kJ mol−1).
Lastly, we note that if complete CO2 dissociation is reached within the CO2 plasma for strategy (i), CH4 will be completely converted to CO by O2 and O resulting from the completely dissociated CO2 plasma, and no H2O will be formed according to the WGS equilibrium. However, this is not an energy efficient approach for DRM since the energy required to completely dissociate the CO2 gas is much higher than the energy needed to reach near 100% syngas yield from a 1![[thin space (1/6-em)]](https://www.rsc.org/images/entities/char_2009.gif) :
:![[thin space (1/6-em)]](https://www.rsc.org/images/entities/char_2009.gif) 1 CO2/CH4 mixture. This is evident from Fig. 9(a) and (b), which show that 100% syngas yield (full conversion with no byproducts) is achieved at the end of the plasma for strategy (ii), whereas the CO2 conversion at the end of the CO2 plasma in strategy (i) reaches only 75%.
1 CO2/CH4 mixture. This is evident from Fig. 9(a) and (b), which show that 100% syngas yield (full conversion with no byproducts) is achieved at the end of the plasma for strategy (ii), whereas the CO2 conversion at the end of the CO2 plasma in strategy (i) reaches only 75%.
5. Conclusions
We have developed a 0D chemical kinetics model to describe the post-plasma gas conversion process occurring when the effluent of a thermal plasma mixes with a gas stream injected post-plasma, and we applied this model here to plasma-based DRM. Specifically, our model aims to investigate the potential benefits of injecting all the plasma energy into CO2 for the thermal plasma-driven DRM process, by considering a pure CO2 plasma with post-plasma CH4 injection. The rationale behind this strategy is that when a CO2/CH4 mixture is fed to the plasma, some of the plasma power is absorbed by CH4, which is more easily dissociated, thereby reducing the power available for CO2 dissociation compared to a pure CO2 plasma. As CH4 dissociates at lower temperatures, injecting it post-plasma allows CH4 reforming to proceed in the reforming reactor with residual heat, potentially improving the energy efficiency of the process compared to injecting both CO2 and CH4 into the plasma.We first validated the model by reproducing the experimental results of ref. 17, achieving reasonable agreement for the CO2 and CH4 conversion and CO selectivity, but underestimating the H2 selectivity by ca. 15%. The lower H2 selectivity predicted by the model is due to the significantly higher H2O fraction calculated by the model compared to that measured in the experiment, possibly due to the lack of oxidation reactions of the metal reactor walls in the model, which was hypothesized to play a role in the experiment of ref. 17, or due to undetected H2O.
Subsequently, to verify whether directing all the plasma energy into CO2 can improve the syngas yield and energy efficiency, we compared both strategies, i.e. (i) injecting only CO2 inside the plasma while injecting CH4 post-plasma, vs. (ii) injecting half of the 1![[thin space (1/6-em)]](https://www.rsc.org/images/entities/char_2009.gif) :
:![[thin space (1/6-em)]](https://www.rsc.org/images/entities/char_2009.gif) 1 CO2/CH4 mixture into the plasma and the other half of the 1
1 CO2/CH4 mixture into the plasma and the other half of the 1![[thin space (1/6-em)]](https://www.rsc.org/images/entities/char_2009.gif) :
:![[thin space (1/6-em)]](https://www.rsc.org/images/entities/char_2009.gif) 1 CO2/CH4 mixture post-plasma. Our conceptual kinetic simulations assume uniform plasma heating and neglect any heat losses, to make the modeling results as transparent as possible.
1 CO2/CH4 mixture post-plasma. Our conceptual kinetic simulations assume uniform plasma heating and neglect any heat losses, to make the modeling results as transparent as possible.
Our modeling results indicate that for SEI values below 220 kJ mol−1, the CO2 conversion can be increased by considering a pure CO2 plasma with post-plasma CH4 injection (i). The enhanced CO2 conversion arises from the greater fraction of CO2 subjected to high temperatures conducive to efficient CO2 dissociation, compared to strategy (ii), where half of the CO2 is injected post-plasma. For instance, at SEI = 140 kJ mol−1, χCO2 = 80% vs. χCO2 = 60% for strategy (ii). While the CH4 conversion is slightly lower for strategy (i), e.g. at SEI = 140 kJ mol−1, χCH4 = 53% vs. χCH4 = 60% for strategy (ii), the higher CO2 conversion outweighs the lower CH4 conversion, resulting in a slightly higher (ca. 5%) total conversion for SEI < 220 kJ mol−1. Consequently, the minimum EC of conversion is slightly lower, i.e., 212 kJ mol−1vs. 224 kJ mol−1 for strategy (i) and (ii), respectively. For SEI > 220 kJ mol−1, both strategies yield nearly identical results, due to the rapid reaction kinetics at the elevated temperatures (T > 2000 K), with χtot > 95%.
For SEI < 140 kJ mol−1, strategy (i) yields a lower ECE (5–9%) due to the significantly higher χCO2 and SCO compared to strategy (ii). However, this SEI range is not particularly interesting for applications because of the relatively low conversion (<60%) and ECE (<50%). Notably, strategy (i) causes substantial H2O formation when CH4 is injected post-plasma, which is only partially decomposed within the limited reactor residence time for SEI < 220 kJ mol−1. For instance, at SEI = 140 kJ mol−1, the final H2O molar fraction is 13%, resulting in a low H2 selectivity of 56%. For strategy (ii), at SEI ≥ 140 kJ mol−1, H2O formed during the reforming process inside the plasma is almost completely converted at the end of the discharge, yielding significantly higher H2 selectivity, e.g. at SEI = 140 kJ mol−1, SH2 = 83%. As a result, for SEI values ranging between 140 and 200 kJ mol−1, although the total conversion is slightly higher (1–6%), the CO2 plasma with post-plasma CH4 injection yields a slightly lower ECE (1–4%). In other words, the substantial H2O formation, leading to a lower H2 selectivity, explains why there is no clear benefit of the CO2 plasma with post-plasma CH4 injection for SEI values between 140 and 220 kJ mol−1.
For the CO2 plasma with post-plasma CH4 injection, high SEI values above 200 kJ mol−1 are needed to ensure that enough residual heat is present post-plasma to have efficient CH4 conversion (χCH4 > 80%), and significantly convert the H2O formed during the DRM process, resulting in good H2 selectivity (SH2 > 80%). However, at these SEI values, the CO2/CH4 plasma with post-plasma CO2/CH4 injection yields similar results, as sufficient residual heat facilitates the efficient conversion of the injected CO2/CH4 mixture post-plasma.
Our model predicts the best performance for SEI values ranging from 240 to 280 kJ mol−1, where both strategies yield nearly identical results, reaching a total conversion of 99% and ECE of 77%. Consequently, our model suggests that, although enhanced CO2 conversion is feasible at lower SEI values by directing all the energy into CO2, improving the ECE of the DRM process is not possible through a pure CO2 plasma with post-plasma CH4 injection. Nonetheless, such a configuration might still be useful to increase the CH4/CO2 ratio, by circumventing plasma instability resulting from soot formation attributed to high CH4 fractions within the plasma. This could potentially yield higher syngas ratios, more appealing for industrial applications.
Author contributions
Conceptualization, M. A., I. T. and A. B; methodology & investigation, M. A., I. T. and A. B.; writing – original draft, M. A. and A. B., writing – review & editing, M. A. and A. B.; funding acquisition, A. B.; supervision, A. B.Data availability
All data that support the findings of this study are included within the article.Conflicts of interest
There are no conflicts to declare.Acknowledgements
This research was supported by the Horizon Europe Framework Program “Research and Innovation Actions” (RIA), project CANMILK (Grant No. 101069491). We also thank C. H. Cho for the valuable information about their experimental work.References
- R. S. Abiev, D. A. Sladkovskiy, K. V. Semikin, D. Y. Murzin and E. V. Rebrov, Non-thermal plasma for process and energy intensification in dry reforming of methane, Catalysts, 2020, 10(11), 1358 CrossRef CAS
.
- M. I. Malik, I. E. Achouri, N. Abatzoglou and F. Gitzhofer, Intensified performance of methane dry reforming based on non-thermal plasma technology: Recent progress and key challenges, Fuel Process. Technol., 2023, 245, 107748 CrossRef CAS
.
- R. Snoeckx and A. Bogaerts, Plasma technology–a novel solution for CO2 conversion?, Chem. Soc. Rev., 2017, 46(19), 5805–5863 RSC
.
- X. Cui and S. K. Kær, A comparative study on three reactor types for methanol synthesis from syngas and CO2, Chem. Eng. J., 2020, 393, 124632 CrossRef CAS
.
-
S. Mehariya, A. Iovine, P. Casella, D. Musmarra, A. Figoli, T. Marino, N. Sharma and A. Molino, Fischer–Tropsch synthesis of syngas to liquid hydrocarbons, in Lignocellulosic biomass to liquid biofuels, Elsevier, 2020, pp. 217–248 Search PubMed
.
- H. Zhang, Z. Sun and Y. H. Hu, Steam reforming of methane: Current states of catalyst design and process upgrading, Renewable Sustainable Energy Rev., 2021, 149, 111330 CrossRef CAS
.
- B. Wanten, S. Maerivoet, C. Vantomme, J. Slaets, G. Trenchev and A. Bogaerts, Dry reforming of methane in an atmospheric pressure glow discharge: Confining the plasma to expand the performance, J. CO2 Util., 2022, 56, 101869 CrossRef CAS
.
- S. M. Chun, Y. C. Hong and D. H. Choi, Reforming of methane to syngas in a microwave plasma torch at atmospheric pressure, J. CO2 Util., 2017, 19, 221–229 CrossRef CAS
.
- W.-J. Jang, J.-O. Shim, H.-M. Kim, S.-Y. Yoo and H.-S. Roh, A review on dry reforming of methane in aspect of catalytic properties, Catal. Today, 2019, 324, 15–26 CrossRef CAS
.
- X. Gao, Z. Lin, T. Li, L. Huang, J. Zhang, S. Askari, N. Dewangan, A. Jangam and S. Kawi, Recent developments in dielectric barrier discharge plasma-assisted catalytic dry reforming of methane over Ni-based catalysts, Catalysts, 2021, 11(4), 455 CrossRef CAS
.
- J. Li, C. Ma, S. Zhu, F. Yu, B. Dai and D. Yang, A review of recent advances of dielectric barrier discharge plasma in catalysis, Nanomaterials, 2019, 9(10), 1428 CrossRef CAS PubMed
.
- A. Bogaerts and E. C. Neyts, Plasma technology: an emerging technology for energy storage, ACS Energy Lett., 2018, 3(4), 1013–1027 CrossRef CAS
.
- W.-C. Chung and M.-B. Chang, Dry reforming of methane by combined spark discharge with a ferroelectric, Energy Convers. Manage., 2016, 124, 305–314 CrossRef CAS
.
- D. Li, X. Li, M. Bai, X. Tao, S. Shang, X. Dai and Y. Yin, CO2 reforming of CH4 by atmospheric pressure glow discharge plasma: a high conversion ability, Int. J. Hydrogen Energy, 2009, 34(1), 308–313 CrossRef CAS
.
- K. Li, J.-L. Liu, X.-S. Li, H.-Y. Lian, X. Zhu, A. Bogaerts and A.-M. Zhu, Novel power-to-syngas concept for plasma catalytic reforming coupled with water electrolysis, Chem. Eng. J., 2018, 353, 297–304 CrossRef CAS
.
- H. Sun, J. Lee and M. S. Bak, Experiments and modeling of atmospheric pressure microwave plasma reforming of a methane-carbon dioxide mixture, J. CO2 Util., 2021, 46, 101464 CrossRef CAS
.
- C. H. Cho, J. H. Kim, J. K. Yang, I. S. Park, Y.-S. Choi and I. J. Kang, Dry reforming process using microwave plasma generator with high carbon dioxide conversion efficiency for syngas production, Fuel, 2024, 361, 130707 CrossRef
.
- S. M. Chun, D. H. Shin, S. H. Ma, G. W. Yang and Y. C. Hong, CO2 microwave plasma—catalytic reactor for efficient reforming of methane to syngas, Catalysts, 2019, 9(3), 292 CrossRef
.
- S. Böddeker, V. Bracht, P. Hermanns, S. Gröger, F. Kogelheide, N. Bibinov and P. Awakowicz, Anode spots of low current gliding arc plasmatron, Plasma Sources Sci. Technol., 2020, 29(8), 08LT01 CrossRef
.
- S. Kelly, E. Mercer, R. De Meyer, R.-G. Ciocarlan, S. Bals and A. Bogaerts, Microwave plasma-based dry reforming of methane: Reaction performance and carbon formation, J. CO2 Util., 2023, 75, 102564 CrossRef CAS
.
- O. Biondo, C. F. Van Deursen, A. Hughes, A. van de Steeg, W. Bongers, M. van de Sanden, G. van Rooij and A. Bogaerts, Avoiding solid carbon deposition in plasma-based dry reforming of methane, Green Chem., 2023, 25(24), 10485–10497 RSC
.
- M. Jasiński, D. Czylkowski, B. Hrycak, M. Dors and J. Mizeraczyk, Atmospheric pressure microwave plasma source for hydrogen production, Int. J. Hydrogen Energy, 2013, 38(26), 11473–11483 CrossRef
.
- COMSOL Multiphysics® v. 6.0, COMSOL AB, Stockholm, Sweden, https://www.comsol.com.
- G. P. Smith, D. M. G. Michael Frenklach, N. W. Moriarty, B. Eiteneer, M. Goldenberg, C. Thomas Bowman, R. K. Hanson, S. Song, W. C. Gardiner Jr., V. V. Lissianski and Z. Qin, GRI-Mech 3.0. https://www.me.berkeley.edu/gri_mech/.
- F. D'Isa, E. Carbone, A. Hecimovic and U. Fantz, Performance analysis of a 2.45 GHz microwave plasma torch for CO2 decomposition in gas swirl configuration, Plasma Sources Sci. Technol., 2020, 29(10), 105009 CrossRef
.
-
A. J. Wolf, Thermal aspects of CO2 conversion in the vortex-stabilized microwave plasma. 2020 Search PubMed
.
- M. A. Lieberman and A. J. Lichtenberg, Principles of plasma discharges and materials processing, MRS Bull., 1994, 30(12), 899–901 Search PubMed
.
- B. Wanten, R. Vertongen, R. De Meyer and A. Bogaerts, Plasma-based CO2 conversion: How to correctly analyze the performance?, J. Energy Chem., 2023, 7–8 Search PubMed
.
- A. Essiptchouk, F. Miranda and G. Petraconi, Comparative analysis of methane conversion: pyrolysis, dry and steam thermal plasma reforming, J. Phys. D: Appl. Phys., 2024, 57(24), 245201 CrossRef
.
- J. Slaets, B. Loenders and A. Bogaerts, Plasma-based dry reforming of CH4: Plasma effects vs. thermal conversion, Fuel, 2024, 360, 130650 CrossRef CAS
.
- C. H. Cho , private communication.
- S. Maerivoet, I. Tsonev, J. Slaets, F. Reniers and A. Bogaerts, Coupled multi-dimensional modelling of warm plasmas: Application and validation for an atmospheric pressure glow discharge in CO2/CH4/O2, Chem. Eng. J., 2024, 152006 CrossRef CAS
.
- N. Majd Alawi, G. Hung Pham, A. Barifcani, M. Hoang Nguyen and S. Liu, In Syngas formation by dry and steam reforming of methane using microwave plasma technology, in IOP Conference Series: Materials Science and Engineering, IOP Publishing, 2019, p. 012022.
- T. P. Pham, K. S. Ro, L. Chen, D. Mahajan, T. J. Siang, U. Ashik, J.-i. Hayashi, D. Pham Minh and D.-V. N. Vo, Microwave-assisted dry reforming of methane for syngas production: a review, Environ. Chem. Lett., 2020, 18, 1987–2019 CrossRef CAS
.
- N. den Harder, D. C. van den Bekerom, R. S. Al, M. F. Graswinckel, J. M. Palomares, F. J. Peeters, S. Ponduri, T. Minea, W. A. Bongers and M. C. van de Sanden, Homogeneous CO2 conversion by microwave plasma: wave propagation and diagnostics, Plasma Processes Polym., 2017, 14(6), 1600120 CrossRef
.
- A. Gutsol and J. Bakken, A new vortex method of plasma insulation and explanation of the Ranque effect, J. Phys. D: Appl. Phys., 1998, 31(6), 704 CrossRef CAS
.
| This journal is © The Royal Society of Chemistry 2024 |

