Solvent-induced phase transformations of ZIF-L to ZIF-8 and their derivatives' gas-sensing properties†
Xiaojie
Wang
,
Zifan
You
,
Hao
Ding
,
Yuchao
Zhu
and
Xiao
Jia
 *
*
College of Chemistry, Fuzhou University, Qishan Campus, Fuzhou, Fujian 350116, P. R. China. E-mail: jiaxiao@fzu.edu.cn; Tel: +86 591 22867963
First published on 22nd June 2022
Abstract
A detailed study of topological phase transition is essential for guiding the controlled synthesis of materials. Herein, a series of zeolitic-imidazolate frameworks (ZIFs) and their derived metal oxides with tailored morphologies and adjustable phases from ZIF-L to ZIF-8 to ZnO were reported. More significantly, the phase transformation and morphology control of the product could be achieved by simply changing the molar/volume ratio of the reagents without adding any surfactant, and the growth mechanism was systemically investigated. Benefiting from their unique structural advantage, when fabricating gas sensors, all of the products and their derivatives exhibited excellent gas-sensing selectivity and rapid response/recovery times toward acetone vapor. In addition, the gas-sensing mechanism and the causes for the gas-sensing performance discrepancy in different sensors were also studied. The results showed that the oxygen vacancy (OV) content, structures, and morphologies of the product were closely related to their comparable sensitivities. The phase transition and morphology evolution of ZIFs and ZnO in this study might bring a deep understanding of the metal–organic framework crystallization process, which is expected to help the development of more precise control strategies for MOF-based materials with customized functional properties.
1. Introduction
Metal–organic framework (MOF) materials have attracted extensive attention in various promising potential applications due to their high specific surface area, adjustable pores, ordered crystal structure, and active metal center, etc.1,2 Due to their limited window size and specific defect location of the exposed surface, it is crucial to control the synthesis of MOFs with different structural forms and surface energies for tuning their thermodynamic and kinetic behaviors, so as to tailor the properties of MOF nanomaterials in the field of transportation, separation, catalysis, and chemical sensing.3–5 Owing to the modular characteristics of MOFs, the multifunctional MOF family can be broadened through isoreticular expansion techniques, topology-guided constructions, diversified syntheses, and other strategies.3,6 In addition, the use of MOFs as self-sacrificial templates via chemical reaction or calcination to deliberately design and precisely prepare corresponding metal oxides with particular frameworks is considered a convenient and simple approach owing to its economy and high efficiency.7,8 This method provides a unique strategy for the formation of MOF-derived metal oxides with special morphologies, surface structures, and the inherited prominent properties of the MOF precursors.9,10ZIF-8 occupies an irreplaceable position in the MOF family with features of low toxicity, high structural stability, and a specific surface area, making it widely used in many areas, such as drug delivery, chemical sensing, and catalysis. At present, several procedures have been used to prepare ZIF-8 with varying sizes and morphologies. However, due to its highly symmetrical bcc crystal structure, the current methods devised for the controlled synthesis of ZIF-8 are mainly focused on complicated post-synthetic chemical etching or surfactant-assisted synthesis, which involve reduction of the particle surface accessibility and is unfavorable for gas sensing or catalysis applications.11–14 As a result, it is challenging and highly desirable to explore a facile and surfactant-free method to achieve the morphology and size-controlled synthesis of ZIF-8.
As is well known, the properties of MOFs are closely related to the topology of their framework and their pore size, and the reversible conversion ability between different forms of MOFs allows them to retain their unique inherent characteristics while bringing innovative functions.15,16 Therefore, understanding the effect of topological phase transition would be helpful to guide accurate morphology control. For example, Yang's group investigated the effect of methanol on the coordination mode of ZIF-67 and proved that it could induce a spontaneous phase transition under solvothermal conditions. Based on this, a unique hollow Zn/Co ZIF rhombic dodecahedron with enhanced gas storage and selectivity was obtained.17 Wang and colleagues prepared zeolitic imidazole structures with different morphologies and crystal phase transitions by changing the water and methanol ratio in the solution, so as to enhance the adsorption interaction between heavy metal ions and binding sites, thus improving the adsorption capacity.18 Although the solvents play an essential role in the novel synthesis and phase transition processes, there is relatively little research on the solvent-induced topological phase transition and corresponding morphological evolution processes of ZIF-8.19–21
In this work, a simple surfactant-free solvothermal method that generates ZIF-8 polyhedron and nanospheres (ZIF-8-PD and ZIF-8-NS) was reported, in which zinc nitrate hexahydrate was used as a reagent, with DMF and H2O as mixed solvents. The solvent-induced effects on the phase-transition processes were also systematically studied. By easily altering the coordination interaction between the metal ion and organic ligands, such as changing the molar ratio of 2-Hmim/Zn2+ and the components of the mixture solution, ZIF-L nanoflower (ZIF-L-NF) and ZnO hollow/dual-section nanorod (ZnO-HR and ZnO-DR) nanostructures could be obtained. Further growth mechanism investigation indicated that the solution component played dual roles in altering the coordination of Zn2+ with 2-Hmim and adjusting the pH value of the reaction system in the synthesis process. In addition, MOF-derived metal oxides were prepared by calcinating the corresponding ZIF-8 precursor, namely ZnO-PD and ZnO-NS. Ultimately, the gas-sensing performances of the fabricated series of sensors were detected. The different gas-sensing behaviors related to the microstructures of the samples and the gas-sensing mechanism were also investigated in detail.
2. Experimental methods
2.1 Preparation of the MOFs and ZnO
All analytical grade chemicals were obtained from Sinopharm Chemical Reagent Co Ltd. and used without further purification.Synthesis of ZIF-L-NF: 6 mmol 2-Hmim was first dissolved in a mixed solution of 8 mL water and 2 mL DMF with magnetic stirring for 0.5 h at 30 °C, while the pH value of the solution was simultaneously measured (pH1, Table 2). Then, 1 mmol Zn(NO3)2·6H2O was added to the above solution and continuously stirred for 0.5 h, and the pH value of the mixed solution was remeasured (pH2). Next, the solution was transferred into a 25 mL Teflon-lined autoclave and heated at 100 °C for 12 h. After cooling to room temperature, the resulting solution's pH value was measured again (pH3). A white precipitate was finally collected by repeated centrifugation and rinsed with water and ethanol three times.
![[thin space (1/6-em)]](https://www.rsc.org/images/entities/char_2009.gif) :
:![[thin space (1/6-em)]](https://www.rsc.org/images/entities/char_2009.gif) 4.
4.
![[thin space (1/6-em)]](https://www.rsc.org/images/entities/char_2009.gif) :
:![[thin space (1/6-em)]](https://www.rsc.org/images/entities/char_2009.gif) 6; ZnO-HR could be prepared when the amount of DI/DMF was 8
6; ZnO-HR could be prepared when the amount of DI/DMF was 8![[thin space (1/6-em)]](https://www.rsc.org/images/entities/char_2009.gif) :
:![[thin space (1/6-em)]](https://www.rsc.org/images/entities/char_2009.gif) 3 and the reaction time was reduced to 9 h.
3 and the reaction time was reduced to 9 h.
The detailed synthesis experimental conditions are shown in Table 1.
| Samples | 2-Hmim (mmol) | DI/DMF (mL) | Zn(NO3)2·6H2O (mmol) | Time (h) |
|---|---|---|---|---|
| ZIF-L-NF | 6 | 8![[thin space (1/6-em)]](https://www.rsc.org/images/entities/char_2009.gif) : :![[thin space (1/6-em)]](https://www.rsc.org/images/entities/char_2009.gif) 2 2 |
1 | 12 |
| ZIF-L-NT | 4 | 8![[thin space (1/6-em)]](https://www.rsc.org/images/entities/char_2009.gif) : :![[thin space (1/6-em)]](https://www.rsc.org/images/entities/char_2009.gif) 2 2 |
1 | 12 |
| ZIF-8-NS | 4 | 8![[thin space (1/6-em)]](https://www.rsc.org/images/entities/char_2009.gif) : :![[thin space (1/6-em)]](https://www.rsc.org/images/entities/char_2009.gif) 2 2 |
0.5 | 12 |
| ZIF-8-PD | 4 | 16![[thin space (1/6-em)]](https://www.rsc.org/images/entities/char_2009.gif) : :![[thin space (1/6-em)]](https://www.rsc.org/images/entities/char_2009.gif) 4 4 |
1 | 12 |
| ZnO-DH | 2 | 8![[thin space (1/6-em)]](https://www.rsc.org/images/entities/char_2009.gif) : :![[thin space (1/6-em)]](https://www.rsc.org/images/entities/char_2009.gif) 2 2 |
1 | 12 |
| ZnO-DR | 2 | 16![[thin space (1/6-em)]](https://www.rsc.org/images/entities/char_2009.gif) : :![[thin space (1/6-em)]](https://www.rsc.org/images/entities/char_2009.gif) 6 6 |
1 | 12 |
| ZnO-HR | 2 | 8![[thin space (1/6-em)]](https://www.rsc.org/images/entities/char_2009.gif) : :![[thin space (1/6-em)]](https://www.rsc.org/images/entities/char_2009.gif) 3 3 |
1 | 9 |
2.2 Characterization
The crystalline structure of the products was analyzed via X-ray powder diffraction (XRD) using a Rigaku D/Max 2200PC diffractometer with Cu Kα radiation (λ = 1.5418 Å). The surface morphology and size of the products were observed with a Nova NanoSEM-230 field scanning electron microscopy (FESEM) system with an accelerating voltage of 20 kV, and a Tecnai G2 F20 S-TWIN high-resolution electron microscopy (HR-TEM) system operated at 200 kV. The composition of the products was characterized through X-ray photoelectron spectroscopy (XPS) employing a PHI Quantum 2000 Scanning ESCA spectroscopy system with Al Kα radiation. The pH value of the reaction system was recorded with an EDKORS Ph-103 meter at room temperature. The gas-sensing property of the products was tested on a gas-sensing measurement system (JF02E, Jinfeng Tech. Co. Ltd, Kunming, China).2.3 Fabrication and measurement of ZnO gas sensors
The as-prepared ZnO materials and terpineol were mixed and ground into a homogeneous slurry in an agate mortar. Then, the slurry was coated on a commercial alumina ceramic tube and heated at 300 °C for 2 h. After that, the devices were aged for a week in the air at 300 °C to improve their stability and repeatability. Finally, the gas sensors were utilized in a gas-sensing measurement system and the proper amounts of gas were injected into the test chamber. Herein, the response of the sensor is defined as S = Ra/Rg, where Ra is the resistance of the sensor in the air and Rg is the resistance of the sensor in the target gas. The response/recovery time is defined as the time taken for 90% total resistance change in the air and target gas, respectively.3. Results and discussion
3.1 Structural and morphological characteristics of the as-prepared MOFs and ZnO
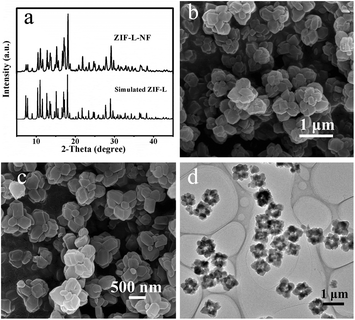
Fig. 1a shows the XRD pattern of the as-prepared ZIF-L-NF. All the sharp and strong characteristic peaks of ZIF-L-NF fitted well with the simulated ZIF-L. The morphology of ZIF-L-NF is shown in Fig. 1b and c. The SEM images revealed that ZIF-L-NF consisted of numerous flower-like microstructures with a uniform size that had an average diameter of ca. 1 μm. Further observation revealed that the ZIF-L-NF petals were assembled by several polyhedra and that they had a relatively clean surface (Fig. 1c). The hollow flower-like nanostructures of ZIF-L-NF presented in Fig. 1d should be caused by the incompact stacking of the small polyhedra.Controlled synthesis could be realized by changing the reaction parameters, such as the molar ratio of reactants, the components of the mixture solution, and the reaction time. When the molar ratio of 2-Hmim and Zn(NO3)2·6H2O was reduced from 6![[thin space (1/6-em)]](https://www.rsc.org/images/entities/char_2009.gif) :
:![[thin space (1/6-em)]](https://www.rsc.org/images/entities/char_2009.gif) 1 to 4
1 to 4![[thin space (1/6-em)]](https://www.rsc.org/images/entities/char_2009.gif) :
:![[thin space (1/6-em)]](https://www.rsc.org/images/entities/char_2009.gif) 1 with the other conditions remaining unchanged, the XRD and FESEM images indicated that the product was a ZIF-L structure with an irregular nanosheet-like morphology (ZIF-L-NT, Fig. S1†).
1 with the other conditions remaining unchanged, the XRD and FESEM images indicated that the product was a ZIF-L structure with an irregular nanosheet-like morphology (ZIF-L-NT, Fig. S1†).
With further changing the molar ratio of 2-Hmim/Zn2+ or the mixed solvent component, the structural transformation of ZIF-L to ZIF-8 was realized. Specifically, by adjusting the molar ratio of 2-Hmim/Zn2+ from 4![[thin space (1/6-em)]](https://www.rsc.org/images/entities/char_2009.gif) :
:![[thin space (1/6-em)]](https://www.rsc.org/images/entities/char_2009.gif) 1 to 4
1 to 4![[thin space (1/6-em)]](https://www.rsc.org/images/entities/char_2009.gif) :
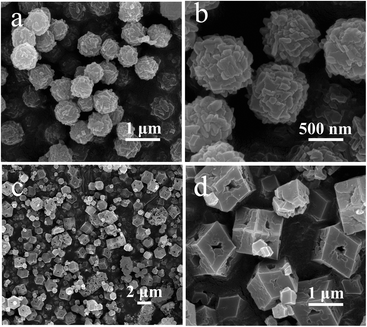
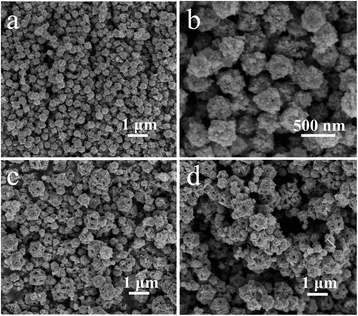
:![[thin space (1/6-em)]](https://www.rsc.org/images/entities/char_2009.gif) 0.5 while keeping the mixed solvent component the same, the sphere-like ZIF-8-NS with a uniform size of ca. 760 nm was obtained, which consisted of plenty of polyhedra (Fig. 2a and b). Also, by keeping the solute component the same and adjusting the volume of DI versus DMF from 8
0.5 while keeping the mixed solvent component the same, the sphere-like ZIF-8-NS with a uniform size of ca. 760 nm was obtained, which consisted of plenty of polyhedra (Fig. 2a and b). Also, by keeping the solute component the same and adjusting the volume of DI versus DMF from 8![[thin space (1/6-em)]](https://www.rsc.org/images/entities/char_2009.gif) :
:![[thin space (1/6-em)]](https://www.rsc.org/images/entities/char_2009.gif) 2 to 16
2 to 16![[thin space (1/6-em)]](https://www.rsc.org/images/entities/char_2009.gif) :
:![[thin space (1/6-em)]](https://www.rsc.org/images/entities/char_2009.gif) 4, the porous dodecahedral morphology of ZIF-8-PD with the size of 1 μm was prepared (Fig. 2c and d). It should be noted that ZIF-8-NS and ZIF-8-PD were in agreement with the simulated pattern of ZIF-8 (Fig. S2†).
4, the porous dodecahedral morphology of ZIF-8-PD with the size of 1 μm was prepared (Fig. 2c and d). It should be noted that ZIF-8-NS and ZIF-8-PD were in agreement with the simulated pattern of ZIF-8 (Fig. S2†).
In addition to obtaining ZIF-L and ZIF-8 structures, the ZnO structure could be directly prepared by reducing the amount of organic ligand 2-Hmim. Based on the synthesis conditions of ZIF-L-NF, when the molar ratio of 2-Hmim and Zn(NO3)2·6H2O was adjusted from 6![[thin space (1/6-em)]](https://www.rsc.org/images/entities/char_2009.gif) :
:![[thin space (1/6-em)]](https://www.rsc.org/images/entities/char_2009.gif) 1 to 2
1 to 2![[thin space (1/6-em)]](https://www.rsc.org/images/entities/char_2009.gif) :
:![[thin space (1/6-em)]](https://www.rsc.org/images/entities/char_2009.gif) 1, the wurtzite hexagonal structure of ZnO-DH containing both a dual section and hollow rods was obtained (Fig. S3†). Based on the phase transition results, the experimental conditions were optimized to obtain homogeneous ZnO products (Fig. S4†). By keeping the solute component the same and adjusting the volume of DI versus DMF from 8
1, the wurtzite hexagonal structure of ZnO-DH containing both a dual section and hollow rods was obtained (Fig. S3†). Based on the phase transition results, the experimental conditions were optimized to obtain homogeneous ZnO products (Fig. S4†). By keeping the solute component the same and adjusting the volume of DI versus DMF from 8![[thin space (1/6-em)]](https://www.rsc.org/images/entities/char_2009.gif) :
:![[thin space (1/6-em)]](https://www.rsc.org/images/entities/char_2009.gif) 2 to 16
2 to 16![[thin space (1/6-em)]](https://www.rsc.org/images/entities/char_2009.gif) :
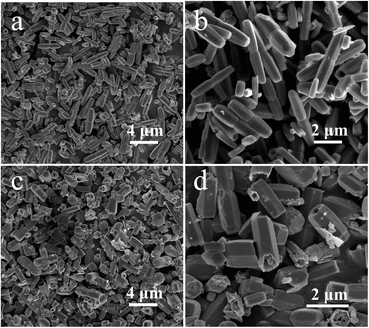
:![[thin space (1/6-em)]](https://www.rsc.org/images/entities/char_2009.gif) 6, uniform dual-section ZnO-DR with a length of 3–4 μm and a width of 0.5–1 μm could be obtained (Fig. 3a and b). The magnified FESEM image in Fig. 3b exhibited that the ZnO-DR was constructed by two connected nanorods. Also, by keeping the solute component the same and adjusting the volume ratio of DI/DMF to 8
6, uniform dual-section ZnO-DR with a length of 3–4 μm and a width of 0.5–1 μm could be obtained (Fig. 3a and b). The magnified FESEM image in Fig. 3b exhibited that the ZnO-DR was constructed by two connected nanorods. Also, by keeping the solute component the same and adjusting the volume ratio of DI/DMF to 8![[thin space (1/6-em)]](https://www.rsc.org/images/entities/char_2009.gif) :
:![[thin space (1/6-em)]](https://www.rsc.org/images/entities/char_2009.gif) 3 and reducing the reaction time to 9 h, hollow nanorod microstructures of ZnO-HR with an average length of 2 μm and an average width of 1 μm were obtained (Fig. 3c and d).
3 and reducing the reaction time to 9 h, hollow nanorod microstructures of ZnO-HR with an average length of 2 μm and an average width of 1 μm were obtained (Fig. 3c and d).
3.2 Growth mechanism
The growth mechanism was analyzed in two aspects: the molar ratio of 2-Hmim/Zn2+ and volume ratio of solvents respectively, and a schematic illustration of the mechanism is depicted in Fig. 4. In the synthesis of ZIF-L-NF, ZIF-L-NT, and ZIF-8-NS, when adjusting the molar ratio of 2-Hmim/Zn2+ while fixing the volume ratio of DI/DMF, there was a continuous change in the morphology and structure of the product (Table 1). When the molar ratio of 2-Hmim/Zn2+ was lower than 6![[thin space (1/6-em)]](https://www.rsc.org/images/entities/char_2009.gif) :
:![[thin space (1/6-em)]](https://www.rsc.org/images/entities/char_2009.gif) 1, the resulting white product was the ZIF-L structure, while the ZIF-8 structure could be obtained by increasing the molar ratio to 8
1, the resulting white product was the ZIF-L structure, while the ZIF-8 structure could be obtained by increasing the molar ratio to 8![[thin space (1/6-em)]](https://www.rsc.org/images/entities/char_2009.gif) :
:![[thin space (1/6-em)]](https://www.rsc.org/images/entities/char_2009.gif) 1. These results were consistent with a previous report that a low ratio is beneficial to form ZIF-L, whereas a high ratio is conducive to the growth of the ZIF-8 product.22 Comparing the experimental conditions of ZIF-L-NT and ZIF-8-PD, it could be found that when fixing the molar ratio of 2-Hmim/Zn2+ and increasing the volume of mixed solvents, the product similarly changed from the ZIF-L to ZIF-8 structure. This should be caused by the promoted deprotonation of 2-Hmim and the generation of more mim− and H+.23 Based on the above analysis, it was evident that both the molar ratio of 2-Hmim/Zn2+ and the volume of solvents played essential roles in the formation of ZIF-8.
1. These results were consistent with a previous report that a low ratio is beneficial to form ZIF-L, whereas a high ratio is conducive to the growth of the ZIF-8 product.22 Comparing the experimental conditions of ZIF-L-NT and ZIF-8-PD, it could be found that when fixing the molar ratio of 2-Hmim/Zn2+ and increasing the volume of mixed solvents, the product similarly changed from the ZIF-L to ZIF-8 structure. This should be caused by the promoted deprotonation of 2-Hmim and the generation of more mim− and H+.23 Based on the above analysis, it was evident that both the molar ratio of 2-Hmim/Zn2+ and the volume of solvents played essential roles in the formation of ZIF-8.
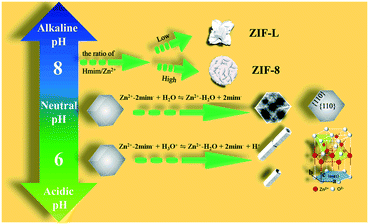 | ||
| Fig. 4 Schematic illustration of the growth mechanism and corresponding phase transitions of ZIFs and the derived oxides with different morphologies. | ||
Besides, the pH value of the reaction solution is also a crucial factor in the synthesis of MOF materials. As a result, the selected five reaction systems' pH values before and after crystallization were measured, and the results are summarized in Table 2. Compared to pH1, pH2 had a significant decrease because of the coordination of Zn2+ with mim− and the produced H+. As the reaction progressed, the pH value was reduced to pH3, which was mainly attributed to the further crystallization of amorphous compounds inside the particles.24 Comparing the pH1 values of ZIF-8-PD and ZIF-8-NS (or ZnO-DR and ZnO-HR), it could be found that when the same amount of 2-Hmim was added, the higher the volume of the mixed solution, the lower the pH value of the system (Tables 1 and 2). This means that increasing the volume of the mixed solution can indeed promote the Hmim to produce more mim− and H+.
| Systems | ZIF-L-NF | ZIF-8-NS | ZIF-8-PD | ZnO-DR | ZnO-HR |
|---|---|---|---|---|---|
| a pH1 are the pH values of the initial 2-Hmim solution in mixed solvent without Zn(NO3)2·6H2O and after stirring for 0.5 h. pH2 are the pH values of the Zn(NO3)2·6H2O added in the mixed solution and after stirring for 0.5 h. pH3 are the pH values of the resulting solution after heating at 100 °C for 12 h (or 9 h) and cooling down to room temperature. | |||||
| pH1 | 10.52 | 10.42 | 10.20 | 9.85 | 9.90 |
| pH2 | 7.81 | 8.10 | 7.30 | 6.93 | 6.82 |
| pH3 | 7.76 | 8.04 | 7.14 | 6.61 | 6.46 |
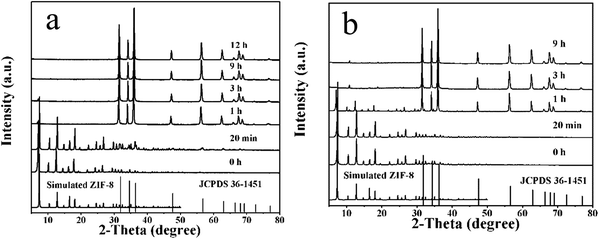
ZIF-8/ZIF-L had strong stability in alkaline solution but instability in water or acid solution. In the system of ZIF-8-PD, the metal-coordinated linkers were replaced by water molecules due to the pH2 and pH3 values being close to 7, resulting in the 12 (110) facets of ZIF-8 and formation of a corroded porous structure.12,25 The H3O+ has a strong affinity for mim− in the acid solution compared to the low-valency metal ions,25,26 so we guessed that the ZnO-DR and ZnO-HR were formed by the decomposition of ZIF-8. Further time-dependent experiments were carried out to confirm the formation process of the ZnO structure. As shown in Fig. 5, all the characteristic peaks of the samples matched well with the structure of ZIF-8 at the initial time, but gradually transformed into ZnO structure with increasing the reaction time (Fig. S5 and S6†). What's more, during the formation process of ZnO-HR, the XRD and the corresponding SEM results at 1 h obviously showed the coexistence of ZIF-8 and ZnO (Fig. 5b and S6†). Meanwhile, as with the wurtzite structure of ZnO, the preferable growth face was the (0001) facet, which tended to generate the nanorod-like shape.27,28 Also, the formation of the hollow structure (ZnO-HR) may be assigned to the lowest pH3 value, which would make it more corroded. That is, the different coordination processes of Zn2+ with 2-Hmim affected by the molar ratio of 2-Hmim/Zn2+, volume ratio of solvents, and pH value lead to the topological phase transition and morphological evolution of ZIF-8 ultimately.
3.3 Structural and morphological characteristics of the derived ZnO nanostructures
MOFs as self-sacrificial templates are considered to be an effective method to prepare porous metal oxides. As an n-type semiconductor, ZnO has broad applications in the gas-sensing field.29 The porous structure facilitates gas transmission and further improves its gas-sensing sensitivity. As a result, the ZIF-L-NF, ZIF-8-NS, and ZIF-8-PD samples with particular morphologies were selected as precursors to prepare porous ZnO products. After calcination, all the templates were completely transformed to the wurtzite structure of ZnO (Fig. S7†). Note that the obtained ZnO-NS and ZnO-PD basically maintained the morphologies of their precursors, but the sizes were slightly shrunk (Fig. 6). Specifically, after calcination, ZnO-NS became a spherical structure with an average size of 350 nm, and was formed by a large number of fine particles. ZnO-PD became a porous polyhedral structure with an average size of 800 nm. This phenomenon was mainly caused by the removal of C–N parts during the calcination process and the contraction of ZnO during the cooling process.30,31 However, ZnO-NF could not keep the flower framework because of the unstable structure of ZIF-L (Fig. S8†).32,33 Therefore, the derived ZnO-PD, ZnO-NS, and the previously synthesized ZnO-HR and ZnO-DR were used as gas-sensor materials in the gas-sensing experiments.3.4 Gas-sensing performance
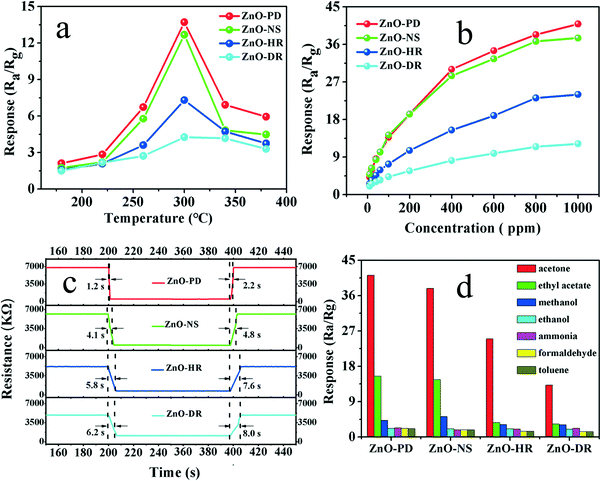
It is well known that the working temperature has a significant effect on semiconductor oxide gas sensors. To determine the optimal operating temperature, the response of the as-fabricated sensors toward 100 ppm acetone vapor was measured in the temperature range from 180 °C to 380 °C. The temperature-dependence behavior was plotted and displayed in Fig. 7a. Obviously, all the sensors' curves exhibited volcanic shapes, in which the responses increased rapidly and reached the maximum value at 300 °C and then gradually decreased with further raising the working temperature. This phenomenon can be attributed to the kinetics and thermodynamics of gas adsorption/desorption on the sensing material surface.34,35 Herein, the maximal responses occurred at 300 °C. Thus, 300 °C was the optimum temperature and used in the following measurements.Fig. S9† illustrates the time-dependent response curves of as-fabricated gas sensors to acetone vapor with various concentrations from 10 ppm to 1000 ppm at 300 °C, and the corresponding responses were calculated and displayed in Fig. 7b. The responses of the fabricated sensors based on ZnO-PD, ZnO-NS, ZnO-HR, and ZnO-DR nanomaterials increased sharply with the concentration of acetone vapor changing from 10 ppm to 800 ppm. When further increasing the concentration, the change tendency of the responses became slow, which could be interpreted as the surface adsorption tending to reach saturation (Fig. 7b).34,36 When 1000 ppm acetone vapor was injected, the response values of ZnO-PD, ZnO-NS, ZnO-HR, and ZnO-DR were 40.89, 37.53, 24.01, and 12.21, respectively. Meanwhile, it was noticed that when 10 ppm acetone vapor was injected, the four sensors mentioned above also exhibited good responses and the corresponding values were 4.20, 4.84, 2.61, and 2.02 (Fig. S10†). These results indicate that the sensors can offer the opportunity to detect a low concentration of acetone vapor.
The response time and recovery time are also important indicators for estimating the gas sensor in practical applications. In Fig. 7c, the response/recovery times of the ZnO-PD, ZnO-NS, ZnO-HR, and ZnO-DR sensors toward 100 ppm acetone vapor were 1.2 s/2.2 s, 4.1 s/4.8 s, 5.8 s/7.6 s and 6.2 s/8.0 s, respectively. Thereinto, the ZnO-PD gas sensor exhibited both the fastest response/recovery speed and the highest response value. This may be caused by its particular porous structure, which can provide a convenient path for gas adsorption and electron transportation.37–39 The response time of all gas sensors was shorter than its recovery time, which could be explained by noting that the backward reaction barrier heights were relatively high, indicating that the sensors needed a longer time to overcome higher barrier heights in the recovery process.40,41
Selectivity also plays a significant factor in the gas-sensing field. To investigate the selectivity of the four gas-sensor devices, their gas-sensing performance was measured in different volatile organic compounds (such as ethyl acetate, methanol, ethanol, ammonia, formaldehyde, and toluene) at 1000 ppm (Fig. 7d). Obviously, the four sensors expressed different responses toward various target gases and the discrepancy should be caused by the different LUMO (lowest unoccupied molecular orbit) energy of the target gases.42,43 All the devices exhibited excellent selectivity to acetone vapor among the seven gases, with the main reason being that the acetone molecule has a larger dipole moment, which is conducive to the interaction between acetone molecules and anionic oxygen species.44–46
Considering the importance of the stability of the sensors, the response–recovery curves of the gas sensors to 100 ppm acetone vapor were measured for six cycles at 300 °C (Fig. S11†). The responses of the four sensors maintained the initial values well after several cycles, which indicated their good reversibility and stability.
3.5 Gas-sensing mechanism
The most commonly accepted gas-sensing mechanism of metal oxide semiconductor sensors refers to the adsorption–desorption process of gas molecules on the surface of the materials, which then induces an electric resistance change.47 For n-type ZnO, when it was contacted with air, the oxygen molecules were adsorbed on its surface and translated into O2−, O−, and O2− by extracting electrons from the conductance band, resulting in the formation of an EDL (electron-depletion layer) and the increase in resistance (Fig. 8a). When it was exposed to reductive gas (such as acetone vapor), there was a chemical reaction between the ionic oxygen species and the acetone molecules on the surface of ZnO. The acetone molecules decomposed into CO2 and H2O and released electrons, and when the electrons came back to the ZnO conductance band, the EDL got thinned and the resistance was reduced (Fig. 8b). The reaction process can be described by the following eqn (1)–(5).48| O2(g) → O2(ads) | (1) |
| O2(ads) + e− → O2−(ads) | (2) |
| O2−(ads) + e− → 2O−(ads) | (3) |
| O−(ads) + e− → O2−(ads) | (4) |
| CH3COCH3 + 8O2−(ads) → 3CO2(g) + 3H2O + 16e− | (5) |
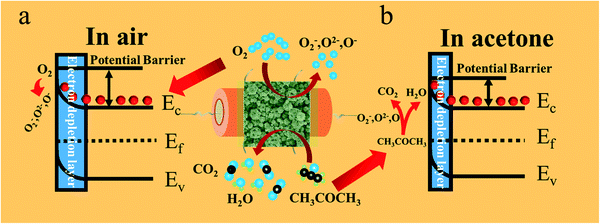 | ||
| Fig. 8 Schematic illustration of the depletion theory and the sensing mechanism of the ZnO samples in air (a) and acetone vapor (b). | ||
According to the previous reports, the sensors response relation with the concentration can be simply represented as log(S − 1) = b![[thin space (1/6-em)]](https://www.rsc.org/images/entities/char_2009.gif) log(C) + log(a). In Fig. S12,† all the gas sensors show a good linear logarithmic response with the change of acetone vapor concentration (R2 ≥ 0.995). The b values of all the devices were close to 0.5, suggesting that the main medium of the adsorbed oxygen species on the surface of ZnO nanomaterials was O2−.49
log(C) + log(a). In Fig. S12,† all the gas sensors show a good linear logarithmic response with the change of acetone vapor concentration (R2 ≥ 0.995). The b values of all the devices were close to 0.5, suggesting that the main medium of the adsorbed oxygen species on the surface of ZnO nanomaterials was O2−.49
To further investigate the discrepancy of the gas-sensing performances of the as-fabricated gas sensors, XPS analysis was used. Fig. 9a presents the XPS spectra containing Zn 2p and O 1s of the four samples. As shown in Fig. 9b, two major peaks at ca. 1022 and 1045 eV were observed and could be attributed to the binding energies of Zn 2p3/2 and Zn 2p1/2, which corresponded to the single form of Zn2+ in ZnO.50,51Fig. 9c–f show the three fitted symmetrical peaks of the O 1s peak of the four samples. The peaks at ca. 530 and 531 eV could be attributed to their respective lattice oxygen (OL) and the oxygen vacancies (OV), while the peaks at ca. 532 eV originated from the chemisorbed oxygen (OC).52 For the surface resistance-type semiconductor, OV can provide more active sites and enhance the gas-sensing performance.53,54 ZnO-PD had the significantly highest percentage of OV in the four samples and the outcomes could be well matched with the results from the gas-sensing experiments (Table 3). In addition, the hierarchical porous structures of ZnO-PD should also be beneficial to enable gas molecules and electronics to diffuse fast and to transfer rapidly in both the inner and outer surfaces, resulting in an excellent gas-sensing performance.
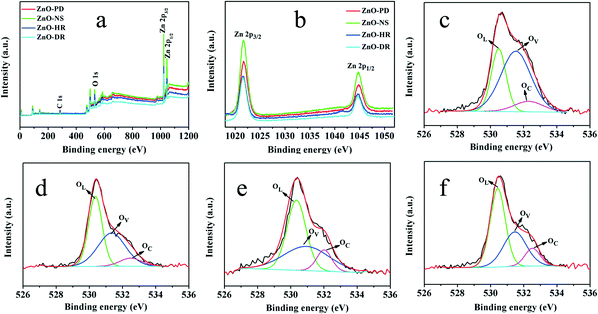 | ||
| Fig. 9 XPS spectra of the as-prepared ZnO samples. (a) Wide spectra, (b) Zn 2p, and O 1s of (c) ZnO-PD, (d) ZnO-NS, (e) ZnO-HR, and (f) ZnO-DR. | ||
| Oxygen species | ZnO-PD | ZnO-NS | ZnO-HR | ZnO-DR | |
|---|---|---|---|---|---|
| OL | Binding energy (eV) | 530.49 | 530.36 | 530.34 | 530.43 |
| Percentage (%) | 30.12 | 46.46 | 48.63 | 52.59 | |
| OV | Binding energy (eV) | 531.53 | 531.34 | 530.93 | 531.46 |
| Percentage (%) | 59.85 | 44.79 | 40.57 | 35.44 | |
| OC | Binding energy (eV) | 532.30 | 532.49 | 532.01 | 532.52 |
| Percentage (%) | 10.03 | 8.75 | 10.80 | 11.97 | |
4. Conclusions
In this work, a series of ZIFs and their derived metal oxides with different sizes and shapes were obtained via a facile surfactant-free solvothermal process. By simply changing the ratio of Zn2+ to 2-Hmim and the volume ratio of the solvents, the pH value of the reaction solution was adjusted, and the coordination of the metal and the organic ligand was changed, leading to a topological phase transition and morphological evolution of the ZIF-8, ZIF-L, and ZnO products. In the gas-sensing experiments, the sensor based on ZnO-PD exhibited excellent gas-sensing performance, with a rapid response/recovery time of 1.2 s/2.2 s and a high response of 40.89 to 1000 ppm acetone vapor, respectively. These results may be ascribed to using self-sacrificial MOFs as a template, which can provide a loose and porous interior structure for calcination products, thereby prompting the gas-sensing properties. Our research is helpful to further understand the crystallization process of ZIFs, and provides a straightforward way to synthesize and manipulate MOF-based nanostructures with a controlled topological phase transition and morphology.Conflicts of interest
There are no conflicts to declare.Acknowledgements
The work was financially supported by the Natural Science Foundation of Fujian Province (No. 2017J05021).References
- G. Xu, T. Yamada, K. Otsubo, S. Sakaida and H. Kitagawa, J. Am. Chem. Soc., 2012, 134, 16524–16527 CrossRef CAS PubMed.
- S. Jiang, Q. He, C. Li, K. Dang, L. Ye, W. Zhang and Y. Tian, Sci. China Mater., 2022, 65, 1112–1121 CrossRef CAS.
- L. Feng, K.-Y. Wang, J. Powell and H.-C. Zhou, Matter, 2019, 1, 801–824 CrossRef.
- X. Xiao, L. Zou, H. Pang and Q. Xu, Chem. Soc. Rev., 2020, 49, 301–331 RSC.
- C. R. Marshall, J. P. Dvorak, L. P. Twight, L. Chen, K. Kadota, A. B. Andreeva, A. E. Overland, T. Ericson, A. F. Cozzolino and C. K. Brozek, J. Am. Chem. Soc., 2022, 144, 5784–5794 CrossRef CAS PubMed.
- A. Kirchon, L. Feng, H. F. Drake, E. A. Joseph and H.-C. Zhou, Chem. Soc. Rev., 2018, 47, 8611–8638 RSC.
- Y. Niu, Y. Yuan, Q. Zhang, F. Chang, L. Yang, Z. Chen and Z. Bai, Nano Energy, 2021, 82, 105699 CrossRef CAS.
- M. Liu, J. Wang, P. Song, J. Ji and Q. Wang, Sens. Actuators, B, 2022, 361, 131755 CrossRef CAS.
- C. Sun, J. Yang, X. Rui, W. Zhang, Q. Yan, P. Chen, F. Huo, W. Huang and X. Dong, J. Mater. Chem. A, 2015, 3, 8483–8488 RSC.
- L. Zhong, X. Wang, Y. Guo, J. Ding, Q. Huang, T. T. Li, Y. Hu, J. Qian and S. Huang, ACS Appl. Mater. Interfaces, 2021, 13, 55454–55462 CrossRef CAS PubMed.
- Y. Pan, D. Heryadi, F. Zhou, L. Zhao, G. Lestari, H. Su and Z. Lai, CrystEngComm, 2011, 13, 6937–6940 RSC.
- C. Avci, J. Arinez-Soriano, A. Carne-Sanchez, V. Guillerm, C. Carbonell, I. Imaz and D. Maspoch, Angew. Chem., Int. Ed., 2015, 54, 14417–14421 CrossRef CAS PubMed.
- N. Pinna and M. Niederberger, Angew. Chem., Int. Ed., 2008, 47, 5292–5304 CrossRef CAS PubMed.
- P. Kukkar, K.-H. Kim, D. Kukkar and P. Singh, Coord. Chem. Rev., 2021, 446, 214109 CrossRef CAS.
- X. Zhou, J. Dong, Y. Zhu, L. Liu, Y. Jiao, H. Li, Y. Han, K. Davey, Q. Xu, Y. Zheng and S.-Z. Qiao, J. Am. Chem. Soc., 2021, 143, 6681–6690 CrossRef CAS PubMed.
- X.-L. Liu, W.-W. Fan, Z.-X. Lu, Y. Qin, S.-X. Yang, Y. Li, Y.-X. Liu, L.-Y. Zheng and Q.-E. Cao, Chem. – Eur. J., 2019, 25, 5787–5792 CrossRef CAS PubMed.
- J. Yang, F. Zhang, H. Lu, X. Hong, H. Jiang, Y. Wu and Y. Li, Angew. Chem., Int. Ed., 2015, 54, 10889–10893 CrossRef CAS PubMed.
- C. Yang, W. Zhang, J. Wang, S. Li, X. Liu, L. Dou, T. Yue, J. Sun and J. Wang, Inorg. Chem. Front., 2019, 6, 2667–2674 RSC.
- X. Li, Z. Li, L. Lu, L. Huang, L. Xiang, J. Shen, S. Liu and D.-R. Xiao, Chem. – Eur. J., 2017, 23, 10638–10643 CrossRef CAS PubMed.
- Z. Zhang, Y. Chen, X. Xu, J. Zhang, G. Xiang, W. He and X. Wang, Angew. Chem., Int. Ed., 2014, 53, 429–433 CrossRef CAS PubMed.
- M. Izadpanah Ostad, M. Niknam Shahrak and F. Galli, Microporous Mesoporous Mater., 2021, 326, 111363 CrossRef CAS.
- H. Fu, Z. Wang, X. Wang, P. Wang and C.-C. Wang, CrystEngComm, 2018, 20, 1473–1477 RSC.
- M. Jian, B. Liu, R. Liu, J. Qu, H. Wang and X. Zhang, RSC Adv., 2015, 5, 48433–48441 RSC.
- K. Kida, M. Okita, K. Fujita, S. Tanaka and Y. Miyake, CrystEngComm, 2013, 15, 1794–1801 RSC.
- J. Canivet, A. Fateeva, Y. Guo, B. Coasne and D. Farrusseng, Chem. Soc. Rev., 2014, 43, 5594–5617 RSC.
- S. Yuan, L. Feng, K. Wang, J. Pang, M. Bosch, C. Lollar, Y. Sun, J. Qin, X. Yang, P. Zhang, Q. Wang, L. Zou, Y. Zhang, L. Zhang, Y. Fang, J. Li and H.-C. Zhou, Adv. Mater., 2018, 30, 1704303 CrossRef PubMed.
- M. Yin, M. Liu and S. Liu, Sens. Actuators, B, 2013, 185, 735–742 CrossRef CAS.
- X. Yan, Z. Li, R. Chen and W. Gao, Cryst. Growth Des., 2008, 8, 2406–2410 CrossRef CAS.
- A. Saranya, T. Devasena, H. Sivaram and R. Jayavel, Mater. Sci. Semicond. Process., 2019, 92, 108–115 CrossRef CAS.
- L. Hu, P. Zhang, Y. Sun, S. Bao and Q. Chen, ChemPhysChem, 2013, 14, 3953–3959 CrossRef CAS PubMed.
- X. Cao, B. Zheng, X. Rui, W. Shi, Q. Yan and H. Zhang, Angew. Chem., Int. Ed., 2014, 53, 1404–1409 CrossRef CAS PubMed.
- K. S. Park, Z. Ni, A. P. Côté, J. Y. Choi, R. Huang, F. J. Uribe-Romo, H. K. Chae, M. O'Keeffe and O. M. Yaghi, Proc. Natl. Acad. Sci. U. S. A., 2006, 103, 10186–10191 CrossRef CAS PubMed.
- S. Gadipelli, W. Travis, W. Zhou and Z. Guo, Energy Environ. Sci., 2014, 7, 2232–2238 RSC.
- Q. Chen, S. Y. Ma, X. L. Xu, H. Y. Jiao, G. H. Zhang, L. W. Liu, P. Y. Wang, D. J. Gengzang and H. H. Yao, Sens. Actuators, B, 2018, 264, 263–278 CrossRef CAS.
- R. K. Chava, H.-Y. Cho, J.-M. Yoon and Y.-T. Yu, J. Alloys Compd., 2019, 772, 834–842 CrossRef CAS.
- W. Tan, J. Tan, L. Fan, Z. Yu, J. Qian and X. Huang, Sens. Actuators, B, 2018, 256, 282–293 CrossRef CAS.
- M. Yang, S. Zhang, F. Qu, S. Gong, C. Wang, L. Qiu, M. Yang and W. Cheng, J. Alloys Compd., 2019, 797, 246–252 CrossRef CAS.
- H. Du, W. Yang, W. Yi, Y. Sun, N. Yu and J. Wang, ACS Appl. Mater. Interfaces, 2020, 12, 23084–23093 CrossRef CAS PubMed.
- J. Liu, H. Huang, H. Zhao, X. Yan, S. Wu, Y. Li, M. Wu, L. Chen, X. Yang and B. L. Su, ACS Appl. Mater. Interfaces, 2016, 8, 8583–8590 CrossRef CAS PubMed.
- R. Xing, L. Xu, J. Song, C. Zhou, Q. Li, D. Liu and H. Wei Song, Sci. Rep., 2015, 5, 10717 CrossRef CAS PubMed.
- J. Hu, Y. Sun, Y. Xue, M. Zhang, P. Li, K. Lian, S. Zhuiykov, W. Zhang and Y. Chen, Sens. Actuators, B, 2018, 257, 124–135 CrossRef CAS.
- J. Tan, M. Dun, L. Li, J. Zhao, W. Tan, Z. Lin and X. Huang, Sens. Actuators, B, 2017, 249, 44–52 CrossRef CAS.
- D. Meng, D. Liu, G. Wang, Y. Shen, X. San, M. Li and F. Meng, Sens. Actuators, B, 2018, 273, 418–428 CrossRef CAS.
- Q. Jia, H. Ji, Y. Zhang, Y. Chen, X. Sun and Z. Jin, J. Hazard. Mater., 2014, 276, 262–270 CrossRef CAS PubMed.
- S. Tian, F. Yang, D. Zeng and C. Xie, J. Phys. Chem. C, 2012, 116, 10586–10591 CrossRef CAS.
- H. Ding, J. Ma, F. Yue, P. Gao and X. Jia, J. Solid State Chem., 2019, 276, 30–36 CrossRef CAS.
- D. R. Miller, S. A. Akbar and P. A. Morris, Sens. Actuators, B, 2014, 204, 250–272 CrossRef CAS.
- Y. Xiong, Z. Zhu, D. Ding, W. Lu and Q. Xue, Appl. Surf. Sci., 2018, 443, 114–121 CrossRef CAS.
- N. Hongsith, E. Wongrat, T. Kerdcharoen and S. Choopun, Sens. Actuators, B, 2010, 144, 67–72 CrossRef CAS.
- L. Hou, L. Lian, L. Zhang, G. Pang, C. Yuan and X. Zhang, Adv. Funct. Mater., 2015, 25, 238–246 CrossRef CAS.
- G. Li, X. Xu, R. Han and J. Ma, CrystEngComm, 2016, 18, 2949–2955 RSC.
- W. Kim, M. Choi and K. Yong, Sens. Actuators, B, 2015, 209, 989–996 CrossRef CAS.
- Z. Jing and S. Wu, Mater. Lett., 2006, 60, 952–956 CrossRef CAS.
- H. Song, Y. Sun and X. Jia, Ceram. Int., 2015, 41, 13224–13231 CrossRef CAS.
Footnote |
| † Electronic supplementary information (ESI) available. See DOI: https://doi.org/10.1039/d2ce00627h |
| This journal is © The Royal Society of Chemistry 2022 |

