
Ni-doped MoS2 nanoparticles as highly active hydrogen evolution electrocatalysts†
Dezhi Wangab,
Xiangyong Zhanga,
Yilin Shena and
Zhuangzhi Wu*ab
aSchool of Materials Science and Engineering, Central South University, Changsha 410083, China. E-mail: zwu2012@csu.edu.cn
bKey Laboratory of Ministry of Education for Non-ferrous Materials Science and Engineering, Changsha 410083, China
First published on 3rd February 2016
Abstract
The replacement of Pt with cheap metal electrocatalysts with high efficiency and superior stability for the hydrogen evolution reaction (HER) remains a great challenge. Furthermore, the optimization of MoS2 electrocatalysts has attracted much attention. In this work, we report a simple strategy to enhance the HER ability of MoS2 catalysts via the doping of nickel. With the doping of a small amount of nickel, the MoS2 catalyst shows more electrochemical active sites, higher turnover frequency over each active site and better conductivity, resulting in excellent HER activity with a small Tafel slope of 47 mV dec−1, making it a promising HER electrocatalyst for practical applications.
Introduction
The increasing global demand for energy and the environmental consequences of burning fossil fuels has stimulated considerable effort to explore renewable carbon-free energy alternatives.1 Hydrogen is the cleanest fuel and represents one of the most promising energy sources.2 The electrocatalytic hydrogen evolution reaction is considered as one of the most important pathways to produce hydrogen efficiently, since hydrogen has been discussed as an energy carrier for the future.3,4 Platinum is the most active and electrochemically stable catalyst.5 However, its high cost and low abundance have limited its utilization in the electrolysis of water. Thus, searching for alternative non-precious-metal electrocatalysts for the HER is a crucial task for hydrogen-based energy industry.6Recently, MoS2 nanoparticles and related metal sulfide nanoparticles have been identified as promising hydrogen evolution catalysts to replace Pt for their low cost, high chemical stability and excellent electrocatalytic properties.7–9 Generally, there are three strategies to improve the electrocatalytic ability of MoS2 catalysts: (i) increasing the number of exposed active sites, (ii) improving the electrical contact to active sites and (iii) enhancing the intrinsic activity of each active site. Following these strategies, a great number of efforts have been made for improving the final HER activity of MoS2. In our previous work,10 because the active sites of MoS2 are located at the edges sites and the basal plane is inert,11 we designed a novel structure of MoS2 nanosheets with a high active site density, providing more exposed active sites, leading to a great improvement of the final HER activity. Considering the large resistance between the lamellar structures of MoS2, many highly conductive supports have been adopted to improve the electron transfer ability, including carbon nanotubes,12 graphene,13 reduced grapheme oxide nanosheets,14 MoO3,15 Mo2C,16 etc. As to the last point, various promoters can be considered to enhance the intrinsic activity of each active site, such as Co, Ni, B, etc., which were widely investigated in the hydrotreating reactions.17–19 In HER, Chorkendorff et al. have also demonstrated that the addition of cobalt could greatly improve the activity of MoS2 by the density functional theory (DFT) calculations, and they found that the cobalt on the S-edge of MoS2 decreased the hydrogen bending energy from 0.18 to 0.1 eV, which is close to the 0.08 eV for the Mo-edge. As a result, the normally less active S-edges become more active in the presence of cobalt, increasing the total amount of active sites.20 Merki et al. further proved the promotion effects of Fe, Co and Ni ions on the catalytic activity of amorphous molybdenum sulfide films for HER.21 Different from the unstable amorphous molybdenum sulfide films, the MoS2 nanoparticles prepared by the hydrothermal method are more stable because of better crystallinity,22–24 which are helpful for the formation of highly active NiMoS phase. Therefore, in this work, Ni-doped MoS2 nanoparticles synthesized by the hydrothermal method have been reported as highly effective HER catalysts, and the effects of Ni on the amount of active sites, the intrinsic activity of each site and the conductivity have also been systematically investigated.
Results and discussion
XRD patterns of MoS2 and Ni–MoS2 are shown in Fig. 1. We can see that the XRD patterns present several broad and low diffraction peaks, indicating a relatively poor crystallinity. And the broad and weak peaks at about 32 and 58 degrees correspond to (100) and (110) positions of bulk MoS2 (JCPDS 37-1492), which demonstrate the existence of MoS2.22–24 With the addition of Ni, there are no remarkable changes in the XRD patterns and no typical peaks of Ni and its sulfides can be observed, which can be attributed to the low content and well dispersion of Ni. However, the existence of Ni will be confirmed by the XPS analysis later.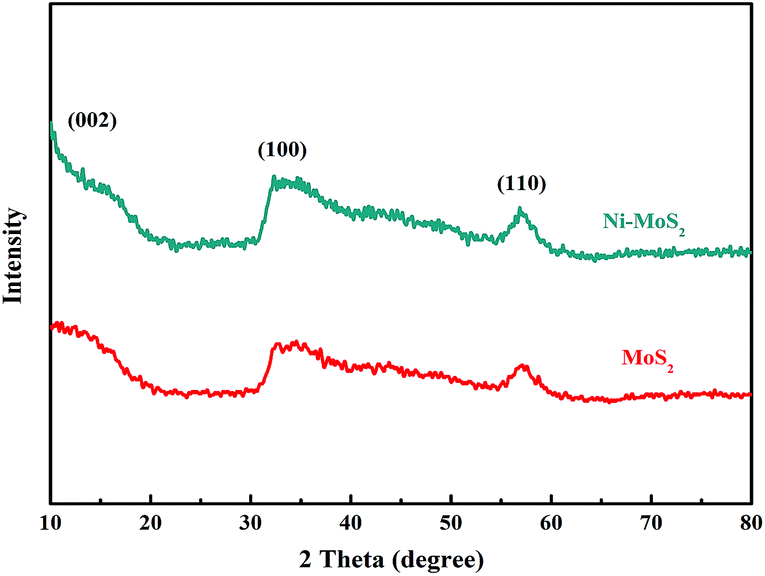 | ||
| Fig. 1 XRD patterns of Ni–MoS2 and pure MoS2. | ||
Raman spectroscopy was employed to further confirm the MoS2 phase, and the appearance of three peaks at 281.92, 376.09 and 403.36 cm−1 corresponds to the E1g, E12g and A1g vibrational modes of hexagonal MoS2, respectively, as shown in Fig. 2. As we know, the E12g and A1g correlate with atom displacements that are orthogonal to each other, in which A1g involves out-of-layer symmetric displacements of sulfur atoms along the c-axis while the E12g involves in-layer displacements of Mo and S atoms, and the E1g and E12g correlate with the relative vibration mode along the layer of the bond between Mo and S.25,26 Moreover, the appearance of the additional peak at 337.13 should be attributed to the existence of a super lattice, indicating a distorted octahedral structure of MoS2.27
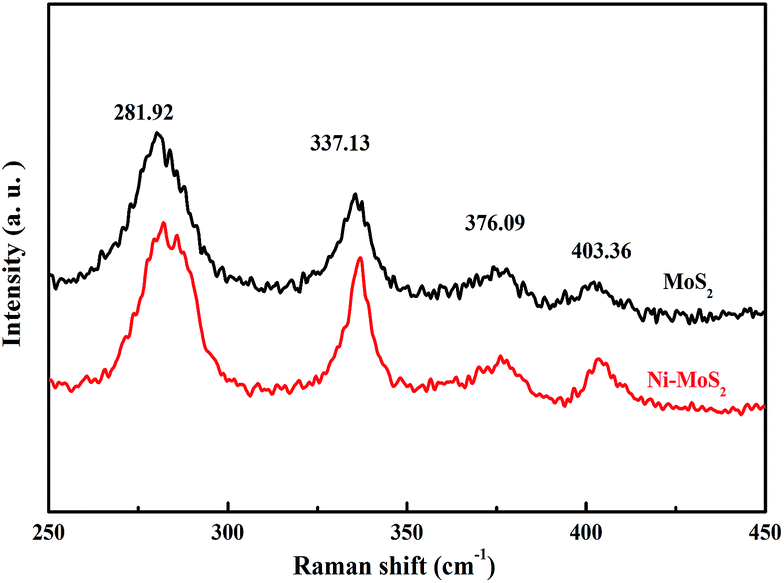 | ||
| Fig. 2 Raman spectra of MoS2 and Ni–MoS2. | ||
The SEM and TEM images of Ni–MoS2 were provided and shown in Fig. 3. We can see that the Ni–MoS2 catalysts are large aggregates, containing small particles with sizes of 100–300 nm, and the energy-dispersive spectrum (EDS) reveals the existence of Ni, Mo and S elements (Fig. 3a and b). The element distribution of Ni, Mo an S was revealed by the SEM-EDS elemental mapping, demonstrating that these elements are well dispersed without remarkable sintered aggregations, as shown in Fig. S1.† A further view was obtained by TEM. It can be observed that Ni–MoS2 particles are composed of stacking sheets of pristine MoS2, as shown in Fig. 3c. The high-resolution TEM (HRTEM) image clearly shows that the interlayer distance of (002) is about 0.63 nm (Fig. 3d), close to the standard value of 0.62 nm.
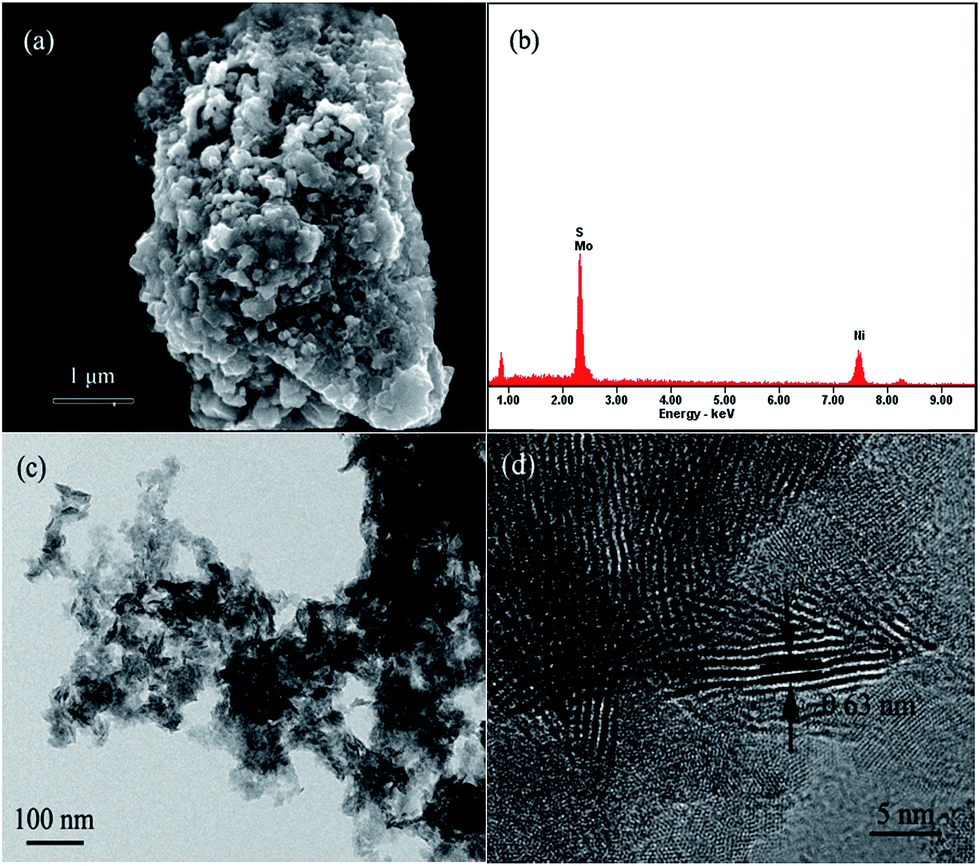 | ||
| Fig. 3 (a) SEM image, (b) EDS spectrum, (c) and (d) TEM images of Ni–MoS2. | ||
To give direct evidence, the chemical composition of Ni–MoS2 was further analyzed by XPS. As observed in Fig. 4a, the Ni–MoS2 is mainly composed of Mo, S and Ni elements. As shown in Fig. 4b, two characteristic peaks of Mo 3d3/2 and Mo 3d5/2 are located at 231.4 and 228.3 eV, respectively, indicating the dominance of Mo4+. The contribution from the peaks centered at 229.7 and 232.6 eV is assigned to Mo5+. And the doublets at 235.5 and 231.2 eV correspond to high oxygen state of Mo (Mo6+).28–30 According to the evolution of observed compositions shown in Fig. 4c, the S 2p spectrum is fitted into three components. The doublets at 162.2, 163.5, 163.7 and 164.8 eV are attributed to S2−. A peak at 169.1 eV proves the presence of S–O bonds, indicating that the surface of MoS2 has been partially oxidized in air.31 The Ni 2p doublets at around 855.0, 857.2, 871.9 and 874.9 eV verify the presence of Ni2+,32,33 as shown in Fig. 4d. Among these peaks, the main Ni 2p3/2 signal at 855.0 eV is characteristic to the presence of NiMoS structures,34,35 and the minor Ni 2p3/2 signal at 857.2 eV is associated to the presence of the NiSO4 phase.36 As we know, the promotion effect of Ni over the MoS2-based hydrotreating catalysts is generally revealed by the formation of NiMoS phase, which exhibits much higher intrinsic activity.34–36 Because of the similar location of active sites, much better HER performances are also expected in this work over the Ni–MoS2 catalyst. The content of Ni and Mo is 1.9% and 26.5% in the Ni-doped MoS2 catalyst by XPS, and the molar ratio of Ni![[thin space (1/6-em)]](https://www.rsc.org/images/entities/char_2009.gif) :Mo is 1:13.9, which is close to the theoretical value 1:15.
:Mo is 1:13.9, which is close to the theoretical value 1:15.
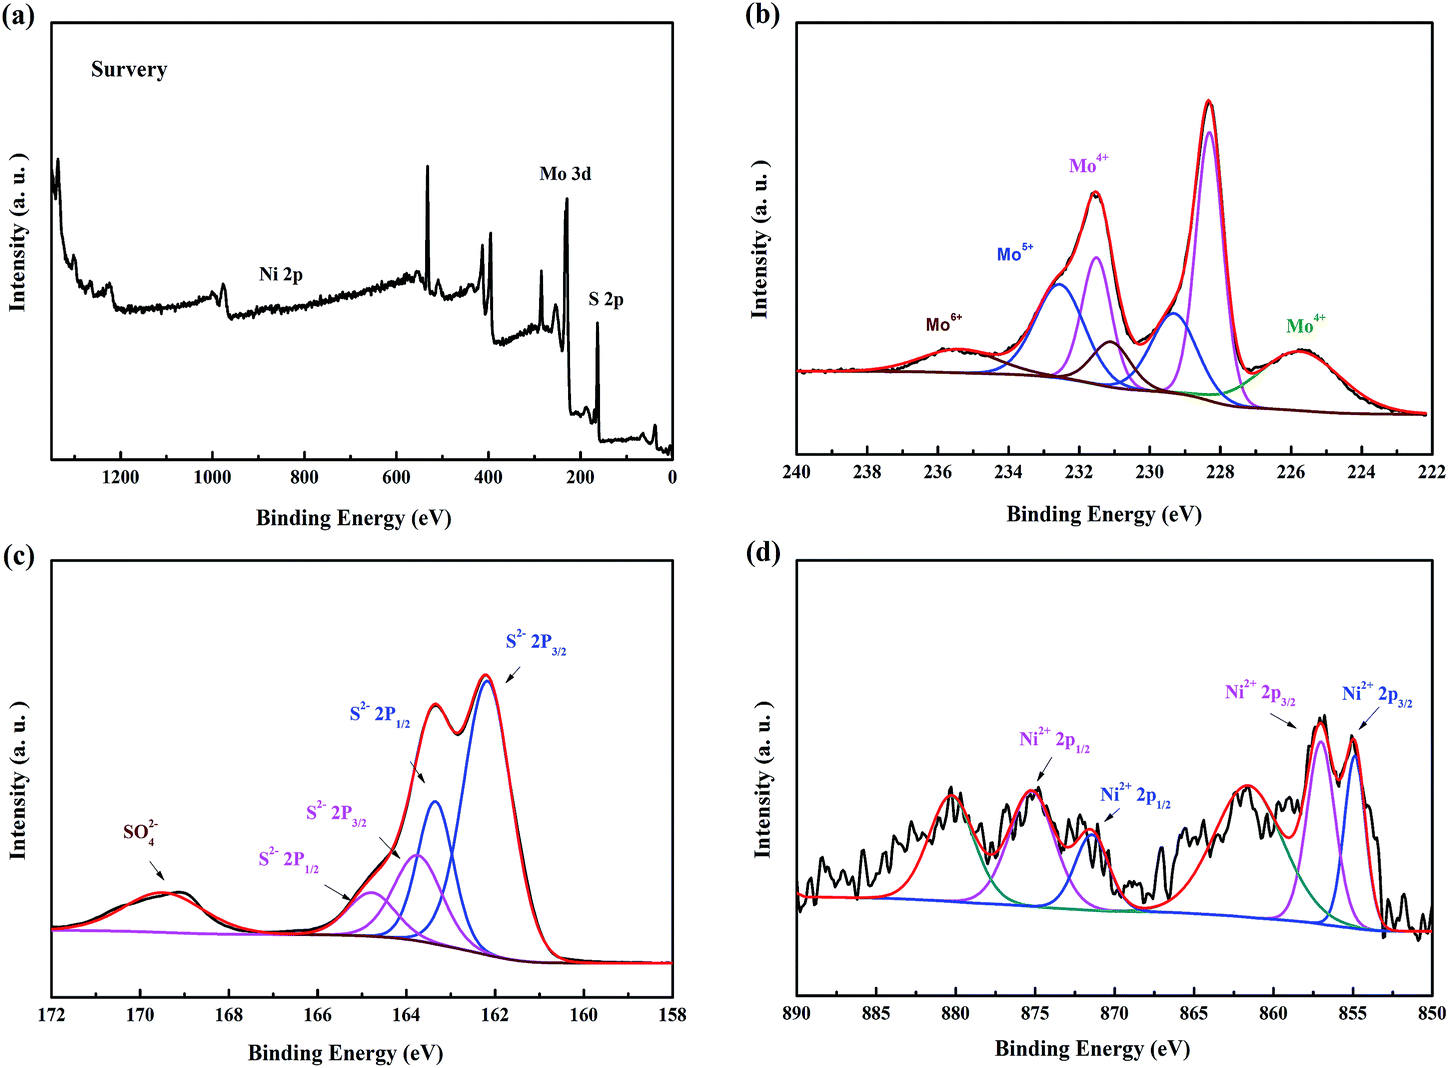 | ||
| Fig. 4 XPS spectra of Ni–MoS2: (a) survey; (b) Mo 3d; (c) S 2p; and (d) Ni 2p. | ||
The polarization curves were measured in 0.5 M H2SO4 with a scan rate of 2 mV s−1 at room temperature and shown in Fig. 5a. As a reference, the HER activity of the commercial Pt/C catalyst (Johnson Matthey, 20 wt%) was demonstrated exhibiting high HER catalytic performance with an extraordinary low overpotential and a high current density. To reach the current density of 20 mA cm−2, an overpotential of −390 mV is required for the pure MoS2, but a smaller one of −350 mV is needed for the Ni–MoS2. And the onset potential of Ni–MoS2 is about −200 mV, which is smaller than its counterpart without Ni doping (−270 mV).
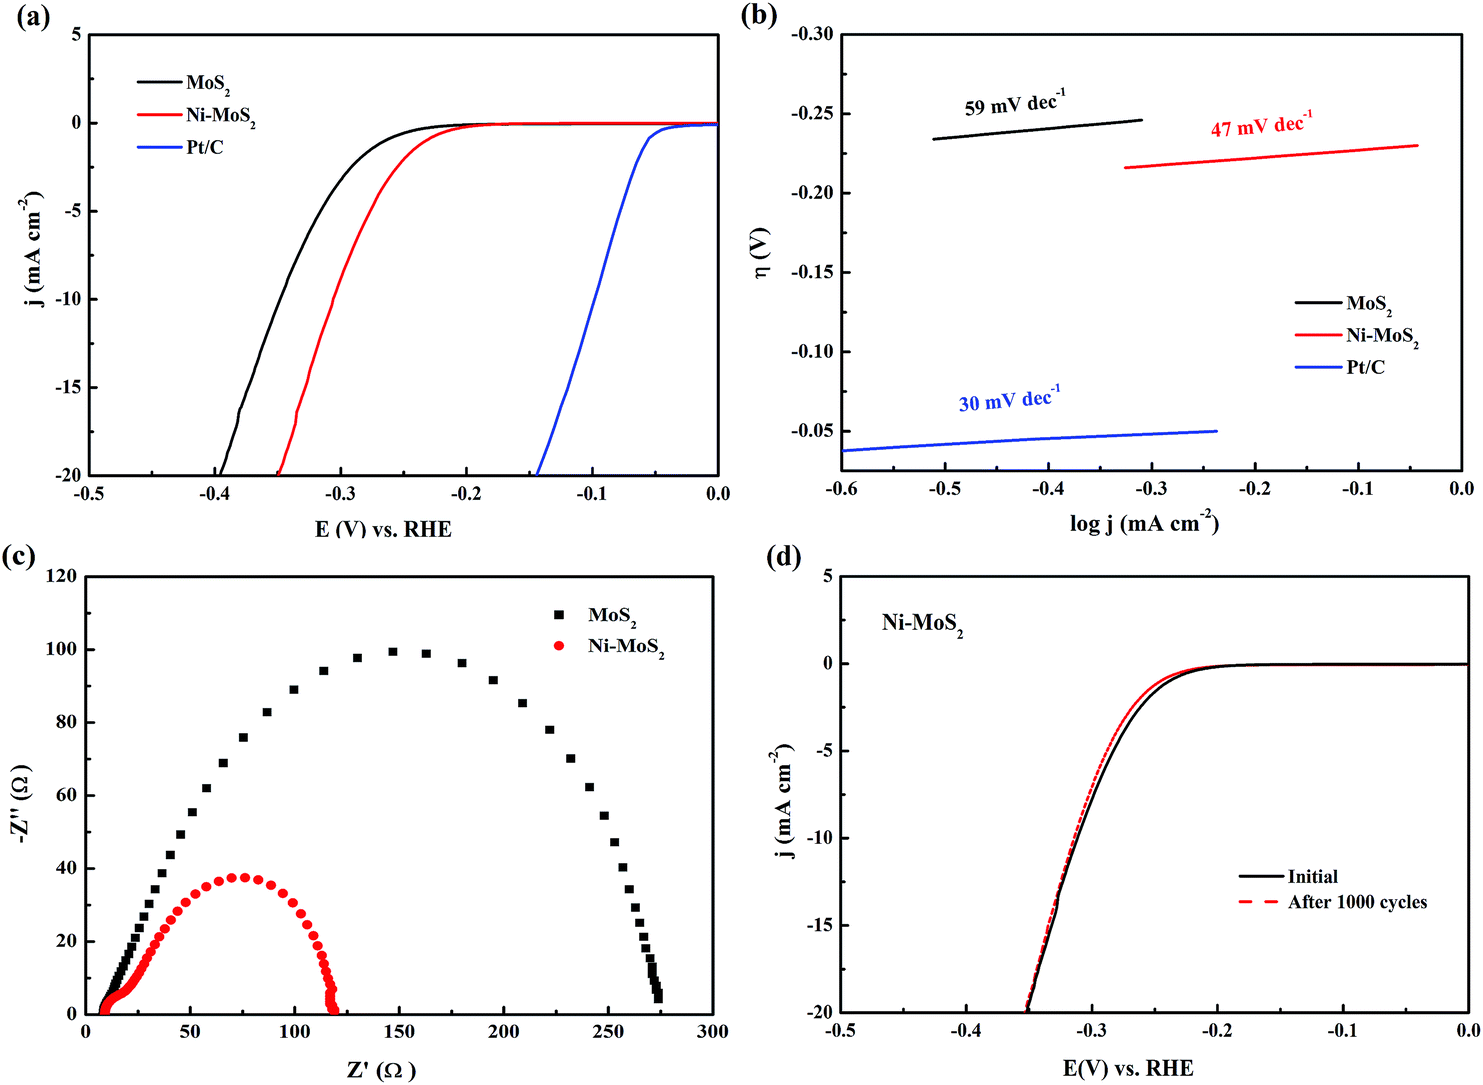 | ||
| Fig. 5 (a) Polarization curves; (b) the derived Tafel plots; (c) Nyquist plots of the pure MoS2 and Ni–MoS2 at −270 mV; (d) the durability test of Ni–MoS2 in 0.5 M H2SO4. | ||
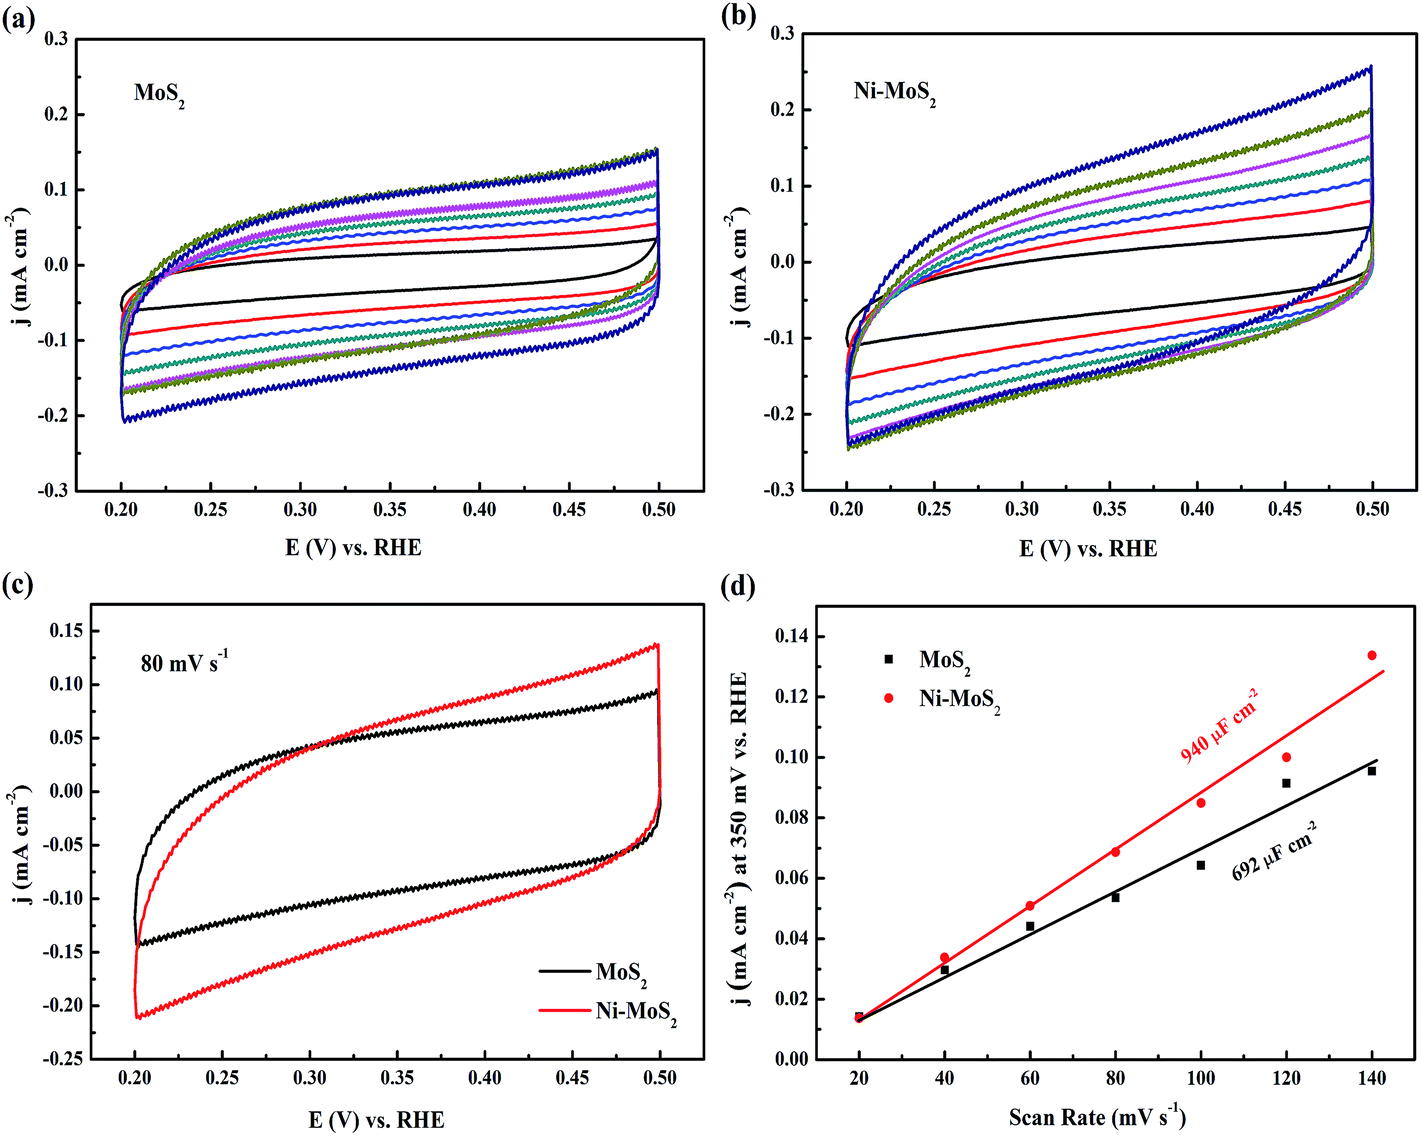
Tafel slope is often utilized to evaluate the efficiency of catalytic reaction and a smaller Tafel slope means a faster increase of the HER rate with the increased overpotentials. The Tafel slopes derived from the polarization curves are fitted into the Tafel equation (η = a + blogj, where b is the Tafel slope, and j is the current density). As shown in Fig. 5b, the commercial Pt/C catalyst still shows the smallest Tafel slope of 30 mV dec−1, close to the reported values.23,37 And the Ni–MoS2 also exhibits a very small Tafel slope of 47 mV dec−1, which is much smaller than that of the pure MoS2 (59 mV dec−1), indicating an excellent HER activity. In acidic solutions, there are three possible reaction steps: the first one is the discharge reaction (Volmer): H3O+ + e− → Hads + H2O. After that is the electrochemical desorption reaction (Heyrovsky): Hads + H+ + e− → H2, or the combination reaction (Tafel): Hads + Hads → H2, or both. It is obviously that the Hads plays an important role in the HER. It is widely accepted that the descriptor for a hydrogen-evolving material is the free energy of hydrogen adsorption (ΔGH). As the ΔGH is approximately zero for Pt, an optimal non-Pt HER catalyst should have a small ΔGH.38 Thus, the enhanced activity of Ni–MoS2 may be attributed to the decrease of ΔGH by Ni doping, which accelerates the recombination of two Hads atoms.
The effect of Ni content has also been discussed and the results are shown in Fig. S2.† As shown in the polarization curves and Tafel plots, with the increased Ni content, the HER activity of Ni-doped MoS2 samples is firstly increased and reaches the maximum value at Ni:Mo = 1:15, then drops down afterwards.
To get a better understanding of the optimization mechanism, the electrochemical impedance spectroscopy (EIS) measurements were performed. The representative Nyquist plots of the EIS response at −270 mV for the GCEs modified by Ni–MoS2 and pure MoS2 are shown in Fig. 5c. It can be seen that the charge transfer resistance (RCT) is decreased remarkably from 275 Ω (pure MoS2) to 120 Ω (Ni–MoS2). Obviously, the doping of Ni significantly improves the electron transport ability, which will greatly enhance the final HER activity.
Durability is another significant criterion to evaluate a catalyst. To study the durability in acidic environment, the long-term potential cycling stability of the Ni–MoS2 was conducted by taking a potential scan from 0.1 to −0.4 V at a scan rate of 2 mV s−1 after 1000 cycles at an accelerated scanning rate of 100 mV s−1. As shown in Fig. 5d, only a slight activity loss was observed after 1000 cycles, indicating a good durability, consistent with that reported for other MoS2-based catalysts.22,23
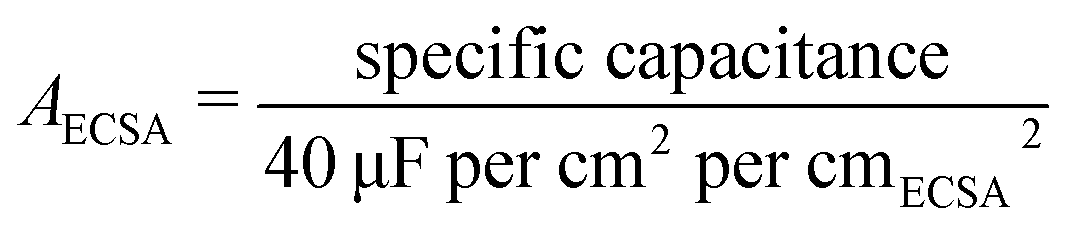
To evaluate the number of active sites and calculate the TOFs, the electrochemical capacitance surface area measurements were also performed. The electrochemical double layer charging for MoS2 and Ni–MoS2 were measured (Fig. 6a and b), and the potential was swept from 200 to 500 mV vs. RHE three times at each of seven different scan rates (20, 40, 60, 80, 100, 120, 140 mV s−1). As shown in Fig. 6c, the capacitive current of Ni–MoS2 is larger than that of pure MoS2 at the scan rate of 80 mV s−1. Fig. 6d exhibits the measured capacitive currents plotted as a function of scan rate at 350 mV vs. RHE, and it also reveals that the Ni–MoS2 (940 μF cm−2) shows a larger double-layer capacitance than that of pure MoS2 (692 μF cm−2), indicating more active sites. Moreover, at an overpotential of −350 mV, the TOF values of Ni–MoS2 and pure MoS2 were calculated to be 1.9 and 1.3 H2 s−1, respectively, which means that the former possesses a higher intrinsic activity of each active site. It can be speculated that the enhancement of the intrinsic activity should be attributed to the formation of NiMoS phases, similar to their behaviors in the hydrotreating reactions.34–36
 | ||
| Fig. 6 Electrochemical capacitance measurements of pure MoS2 (a) and Ni–MoS2 (b); (c) capacitive currents for MoS2 and Ni–MoS2 at 80 mV s−1; (d) the capacitive currents measured at 350 mV vs. RHE were plotted as a function of scan rate for the MoS2 and Ni–MoS2. | ||
Generally, the HER activity is determined by three factors, including the number of active sites, the intrinsic activity of each site and the electron transfer ability.10 Herein, similar to the Co doping of the MoP catalyst,39 the Ni-doped MoS2 catalyst exposes more active sites, and possesses higher intrinsic activity of each active site (TOF), contributed by the formation of new NiMoS phases. More importantly, the resistance is also reduced to improve the electron transfer ability, as revealed by the EIS data. As a result, the final Ni-doped MoS2 exhibits excellent HER activity because of these improvements with a small Tafel slope of 47 mV dec−1.
Experimental
Synthesis of catalysts
Typically, 0.02 g Ni powder (20–100 nm) was added into 50 mL distilled water. After ultrasonication for 30 min to form a black suspension, 0.88 g of (NH4)6Mo7O24·H2O and 0.94 g of thioacetamide (CH3CSNH2) were dissolved into the suspension and stirred for 30 min. Then, the solution was transferred into a 100 mL Teflon-lined stainless steel autoclave. The solution was heated up to 220 °C and maintained for 13 h. After cooled to room temperature naturally, the black powders were collected by centrifugation, washing with distilled water and ethanol for several times, and drying at 60 °C overnight. The pure MoS2 without Ni doping was also prepared following the same procedure without the addition of Ni powder.Preparation of catalyst electrode
Typically, 3 mg of catalyst and 80 μL Nafion solution (5 wt%) were dispersed in 1 mL of a solution composed of 200 μL ethanol and 800 μL distilled water to form a homogeneous slurry. After sonication for 30 min, 5 μL of the catalyst slurry was dropped onto the surface of a GCE (glassy carbon electrode, 3 mm in diameter). Subsequently, the obtained catalyst-coated glassy carbon was dried at room temperature to yield a catalyst loading of 213 μg cm−2.Surface and structural characterizations
X-ray powder diffraction (XRD) patterns for various electrocatalysts were recorded using a D/max-2500 system with Cu Kα radiation (λ = 0.154 nm). Raman spectroscopy was recorded using the instrument LabRAMHR-800 of French company HRIBA. The composites were further confirmed by X-ray photoelectron spectroscopy (XPS). Microstructures were observed by the scanning electron microscopy (SEM, FEI Sirion 200) and transmission electron microscopy (TEM, JEOL-2010).Electrochemical measurements
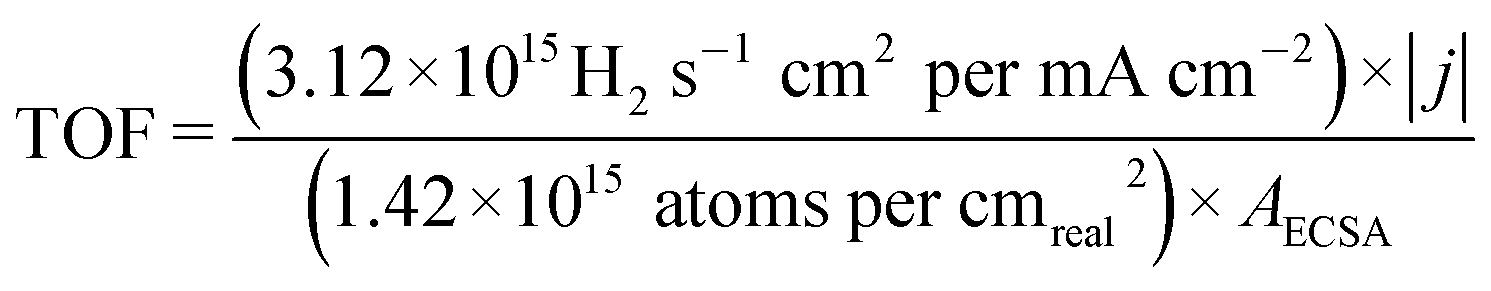
Electrochemical measurements were performed in a standard three-electrode setup on a CHI 660E electrochemical station. The electrocatalytic activity was examined through the linear sweep voltammetry (LSV) with a scan rate of 2 mV s−1 in 0.5 M H2SO4 at room temperature. A saturated calomel electrode (SCE) was employed as the reference electrode and a glassy carbon electrode as the counter electrode. Prior to any electrochemical measurement, the electrolyte solution was purged with N2 for 1 h to remove completely the oxygen, and stable polarization performance curves were recorded after 10 cycles. Electrode potentials were recorded vs. SCE reference electrode, which was calibrated with respect to reversible hydrogen electrode (RHE). All the potentials reported in our manuscript are against RHE. The turnover frequencies (TOFs) were calculated from the specific current density using the following relation:16Calculated electrochemical active surface area (ECSA):
Turnover frequency:
Conclusions
The Ni-doped MoS2 catalyst has been successfully prepared, exhibiting excellent HER activity superior to that of pure MoS2 with a small Tafel slope of 47 mV dec−1 and good stability. The doping of nickel not only increases the number of electrochemical active sites and the intrinsic activity of each active site, but also improves the conductivity, contributing to the great enhancement of the final HER activity. This work introduces a new strategy to improve the MoS2-based catalysts with the Ni doping and further improvements can also be achieved by the similar doping with Co and Fe.Acknowledgements
Financial support from the National Natural Science Foundation of China (Grants 51302326 and 51572301) and the Yu-Ying Program of Central South University are gratefully acknowledged.Notes and references
- P. D. Tran, M. Nguyen, S. S. Pramana, A. Bhattacharjee, S. Y. Chiam, J. Fize, M. J. Field, V. Artero, L. H. Wong, J. Loo and J. Barber, Energy Environ. Sci., 2012, 5, 8912 CAS
.
- G. W. Crabtree, M. S. Dresselhaus and M. V. Buchanan, Phys. Today, 2004, 57, 39 CrossRef CAS
- J. A. Turner, Science, 2004, 305, 972 CrossRef CAS PubMed
- D. Wang, X. Zhang, D. Zhang, Y. Shen and Z. Wu, Appl. Catal., A, 2016, 511, 11 CrossRef CAS
- D. Voiry, H. Yamaguchi, J. Li, R. Sliva, D. C. B. Alves, T. Fujita, M. Chen, T. Asefa, V. B. Shenoy, G. Eda and M. Chhowalla, Nat. Mater., 2013, 12, 850 CrossRef CAS PubMed
- Y. Xu, M. Gao, Y. Zheng, J. Jiang and S. Yu, Angew. Chem., Int. Ed., 2013, 52, 8546 CrossRef CAS PubMed
- J. Greeley, T. F. Jaramillo, J. Bonde, I. Chorkendorff and J. K. Norskov, Nat. Mater., 2006, 5, 909 CrossRef CAS PubMed
- D. Merki and X. Hu, Energy Environ. Sci., 2011, 4, 3878 CAS
- H. Vrubel, D. Merki and X. Hu, Energy Environ. Sci., 2012, 5, 6136 CAS
- Z. Wu, B. Fang, Z. Wang, C. Wang, Z. Liu, F. Liu, W. Wang, A. Alfantazi, D. Wang and D. P. Wilkinson, ACS Catal., 2013, 3, 2101 CrossRef CAS
- T. F. Jaramillo, K. P. Jorgensen, J. Bonde, J. H. Nielsen, S. Horch and I. Chorkendorff, Science, 2007, 317, 100 CrossRef CAS PubMed
- F. Li, J. Li, X. Lin, X. Li, Y. Fang, L. Jiao, X. An, Y. Fu, J. Jin and R. Li, J. Power Sources, 2015, 300, 301 CrossRef CAS
- J. Guo, F. Li, Y. Sun, X. Zhang and L. Tang, J. Power Sources, 2015, 291, 195 CrossRef CAS
- Y. Li, H. Wang, L. Xie, Y. Liang, G. Hong and H. Dai, J. Am. Chem. Soc., 2011, 133, 7296 CrossRef CAS PubMed
- Z. Chen, D. Cummins, B. N. Reinecke, E. Clark, M. K. Sunkara and T. F. Jaramillo, Nano Lett., 2011, 11, 4186 CrossRef
- C. Tang, W. Wang, A. Sun, C. Qi, D. Zhang, Z. Wu and D. Wang, ACS Catal., 2015, 5, 6956 CrossRef CAS
- Z. Wu, V. M. L. Whiffen, W. Zhu, D. Wang and K. J. Smith, Catal. Lett., 2014, 144, 261 CrossRef CAS
- C. Wang, D. Wang, Z. Wu, Z. Wang, C. Tang and P. Zhou, Appl. Catal., A, 2014, 476, 61 CrossRef CAS
- Usman, T. Kubota, Y. Araki, K. Ishida and Y. Okamoto, J. Catal., 2004, 227, 523 CrossRef CAS
- J. Bonde, P. G. Moses, T. F. Jaramillo, J. K. Nørskov and I. Chorkendoff, Faraday Discuss., 2009, 140, 219 RSC
- D. Merki, H. Vrubel, L. Rovelli, S. Fierro and X. Hu, Chem. Sci., 2012, 3, 2515 RSC
- J. Xie, H. Zhang, S. Li, R. Wang, X. Sun, M. Zhou, J. Zhou, X. Lou and Y. Xie, Adv. Mater., 2013, 25, 5807 CrossRef CAS PubMed
- D. Wang, Z. Pan, Z. Wu, Z. Wang and Z. Liu, J. Power Sources, 2014, 264, 229 CrossRef CAS
- D. Chung, S. Park, Y. Chung, S. Yu, D. Lim, N. Jung, H. Ham, H. Park, Y. Piao, S. Yoo and Y. Sung, Nanoscale, 2014, 6, 2131 RSC
- Q. Li, E. C. Walter, W. E. van der Veer, B. J. Murray, J. T. Newberg, E. W. Bohannan, J. A. Switzer, J. C. Hemminger and R. M. Penner, J. Phys. Chem. B, 2005, 109, 3169 CrossRef CAS PubMed
- B. C. Windom, W. G. Sawyer and D. W. Hahn, Tribol. Lett., 2011, 42, 301 CrossRef CAS
- S. J. Sandoval, D. Yang, R. F. Frindt and J. C. Irwin, Phys. Rev. B: Condens. Matter Mater. Phys., 1991, 44, 3955 CrossRef
- Z. Wu, C. Tang, P. Zhou, Z. Liu, Y. Xu, D. Wang and B. Fang, J. Mater. Chem. A, 2015, 3, 13050 CAS
- M. A. Baker, R. Gilmore, C. Lenardi and W. Gissler, Appl. Surf. Sci., 1999, 150, 255 CrossRef CAS
- J. Xie, J. Zhang, S. Li, F. Grote, X. Zhang, H. Zhang, R. Wang, Y. Lei, B. Pan and Y. Xie, J. Am. Chem. Soc., 2013, 135, 17881 CrossRef CAS PubMed
- J. D. Benck, Z. Chen, L. Y. Kuritzky, A. J. Forman and T. F. Jaramillo, ACS Catal., 2012, 2, 1916 CrossRef CAS
- X. J. Lv, G. W. She, S. X. Zhou and Y. M. Li, RSC Adv., 2013, 3, 21231 RSC
- I. I. Abu and K. J. Smith, J. Catal., 2006, 241, 356 CrossRef CAS
- L. Zhang, G. Karakas and Y. S. Ozkan, J. Catal., 1998, 178, 457 CrossRef CAS
- S. Houssenbay, S. Kasztelan, H. Toulhoat, J. P. Bonnelle and J. Grimblot, J. Phys. Chem., 1989, 93, 7176 CrossRef CAS
- B. Guichard, M. Roy-Auberger, E. Devers and C. Pichon, Catal. Today, 2010, 149, 2 CrossRef CAS
- Z. Wu, B. Fang, A. Bonakarpour, A. Sun, D. Wilkinson and D. Wang, Appl. Catal., B, 2012, 125, 59 CrossRef CAS
- X. X. Zou and Y. Zhang, Chem. Soc. Rev., 2015, 44, 5148 RSC
- D. Wang, D. Zhang, C. Tang, P. Zhou, Z. Wu and B. Fang, Catal. Sci. Technol., 2015 10.1039/c5cy01457c
Footnote |
| † Electronic supplementary information (ESI) available. See DOI: 10.1039/c6ra02610a |
| This journal is © The Royal Society of Chemistry 2016 |