A broad spectrum photon responsive, paramagnetic β-NaGdF4:Yb3+,Er3+ – mesoporous anatase titania nanocomposite†
Preeti Padhyeab,
Subha Sadhuab,
Monika Malikab and
Pankaj Poddar*ab
aPhysical & Materials Chemistry Division, CSIR-National Chemical Laboratory, Pune – 411008, India. E-mail: p.poddar@ncl.res.in
bAcademy of Scientific and Innovative Research, Anusandhan Bhawan, Rafi Marg, New Delhi – 110001, India
First published on 24th May 2016
Abstract
Herein, we report a novel single multifunctional platform based on broad-spectrum photoactive β-NaGdF4:18% Yb3+, 2% Er3+ and mesoporous anatase TiO2 for enhanced energy and simultaneous biomedical applications. Currently, the photoactive materials for solar energy harvesting applications have limitations in their efficiency due to their narrow photon absorption spectrum. The upconversion phosphor β-NaGdF4:18% Yb3+, 2% Er3+ nanorods collect and harvest the NIR photons (∼980 nm) of sunlight and transform them into visible light via anti-Stokes emission (λem ∼521 and ∼540 nm), and the photoactive mesoporous anatase TiO2 (mTiO2) utilizes UV and weak visible photons, thus the composite forms a broad spectrum photon-capture system and improved power conversion efficiency for enhanced applications in photocatalysis, and dye sensitized solar cells (DSSCs). The photocatalytic activity of the nanocomposite showed an improvement in comparison to the mTiO2 for the degradation of various dyes. In addition, the photocurrent density and solar cell efficiency of the nanocomposites showed an improvement by ∼24% and ∼17% respectively, over mTiO2. The β-NaGdF4:Yb3+,Er3+/mTiO2 nanocomposite exhibits a strong paramagnetic signal (χ ∼ 6.45 × 10⁻⁵ emu g−1 Oe−1). The nuclear magnetic resonance (NMR) measurements showed large longitudinal T1 relaxivity (r1 = 7.09 s−1 mM−1) and magnetic resonance imaging showed enhanced T1-weighted MRI images with increased concentrations of β-NaGdF4:Yb3+,Er3+/mTiO2 nanocomposite making them suitable for simultaneous magnetoresonance imaging. In addition, this composite system can also be used as a NIR triggered drug delivery system and in biomedical applications. Moreover, mesoporous TiO2 is expected to increase the photocatalytic active sites, dye, and absorption, and drug loading capacity. The as-designed multifunctional β-NaGdF4:Yb3+,Er3+/mTiO2 nanocomposite possessed simultaneous multiple discrete functionalities with excellent luminescence properties, intrinsic paramagnetism, biocompatibility, improved photocatalytic activity, and solar cell efficiency. This work provides a promising system to utilize NIR light, which will contribute to efficient photon harvesting and biological applications.
1. Introduction
For applications such as water splitting, solar cells, and dye-degradation based on photocatalytic processes, it is challenging to design materials for broadband photon absorption leading to increased efficiency. Usually, the photon absorbing species such as dye-molecules, semiconductors (e.g. titania, perovskite materials, quantum dots, etc.) work in a specific spectral range. The increase in the industrial waste water effluence into rivers, containing highly toxic organic compounds generated by the untreated dyes from the textile, leather, and paint industries cause severe environmental issues worldwide.1 The photocatalysis is an effective and environment-friendly technique for the degradation of these toxic pollutants.2 On the other hand, a considerable attention is also emerging towards enhancing the solar energy harvesting for the photovoltaic technologies such as the dye-sensitized solar cell (DSSC).3 In both of these important applications (and several others light based applications such as water splitting etc.) the TiO2 is undoubtedly the most widely utilized semiconductor due to favorable electronic properties, availability and stability etc.4–6 Among the four polymorphs of TiO2 (rutile, anatase, brookite and TiO2 (B)), anatase TiO2 shows the highest photocatalytic activity.7 However, unfortunately the wide bandgap of TiO2 (∼3.2 eV) has limited its widespread applications.8,9 The UV light occupies only ∼5% of solar-spectrum, whereas the percentages of visible light and near-infrared (NIR) light are about ∼45% and ∼50%, respectively which allows only ∼5% of the solar energy impinging on the Earth's surface to be utilized which limits the efficiency of pure TiO2.10 Methods such as doping with metallic/non-metallic elements, surface modification, coupling with other semiconductors, dye-sensitizing, inclusion of graphitic carbon etc., have been used which essentially modify the electronic structure of TiO2 thus extend and enhance the light absorption of TiO2 in visible and NIR regions.11–15 Although, the TiO2 absorption in visible and NIR range is adjusted by employing above-mentioned strategies, but the overall catalytic activity was found to decrease due to an increased recombination of photogenerated electrons and holes.9In addition to the conventional materials such as titania, the focus is shifted to other optically active materials to develop the composite with higher efficiency. Many new catalysts are also developed in an attempt to enhance the photocatalytic activity.16,17 Some of them include NaYF4:5% Tb microprisms, microrods and spindle-like structures,18 {001}-faceted BiOCl single crystals,19 and DyCrO3 nanoplatelets.20 On the other hand, to achieve the NIR photon harvesting of the solar spectrum in DSSCs, novel dyes (e.g., thienothiophene and thiophene based dyes, changing of thiocyanate or bipyridyl ligands in Ru dyes, substituting osmium for ruthenium, using squarine dye and indoline based organic dyes), quantum dots (QDs) (e.g., CdSe, PbS, InP), and co-sensitizers have been reported.21–23 However, the organic dyes decompose relatively easily and QDs are quite sensitive to water and ions. Our group reported the template-free fabrication of highly oriented, single crystalline 1D-rutile TiO2-multiwalled carbon nanotube (MWCNT) composite film directly grown on a fluorine dope conducting oxide (FTO) substrate, which improved the transport of the electrons and resulted into the enhancement in the DSSC efficiency due to reduced grain boundary and exciton recombination.24
Here, we investigate an alternative and effective way to harvest the larger part of the solar spectrum in photocatalysis and the photocurrent density in DSSCs by utilizing the upconverting phosphors in combination with the conventional materials such as titania and dye-molecules. These materials can transform the longer wavelength NIR photons to shorter wavelength UV and visible photons.25 Recently these optically active hybrid materials have found increasing interest also in the biomedical applications. Thus, this composite material can be used in drug delivery and cancer theranostics applications owing to high penetration depth of the NIR radiation. Here, titania gives an edge in drug delivery and cancer therapy by reactive oxygen species (ROS) production due to its high activity, stability, non-toxicity, however, low tissue penetration and UV photodamage limits its use. To overcome these issues, the composites of TiO2 with upconverting phosphor, N–TiO2/NaYF4:Yb, Tm have been developed for NIR-triggered drug release and targeted cancer cell ablation.26 Since, under NIR light excitation, UCNPs are capable of emitting high-energy UV/visible light, UCNPs can activate surrounding photosensitizer (PS) molecules to produce singlet oxygen to kill cancer cells. Owing to the high tissue penetration depth of NIR light, NIR-excited UCNPs can be used to activate PS molecules in much deeper tissues compared to traditional PDT induced by visible or ultraviolet (UV) light.27,28 Thus, in our proposed composite system, anatase mTiO2 act as a photosensitizer molecule which can trigger the production of ROS by formation of electron–hole pair, upon activation by safe and deeper NIR excitation for PDT, as a future application.
The development of multifunctional platforms for broad range of applications have geared tremendous progress towards the design and engineering of various functional materials with multiple discrete functions judiciously integrated in to form nanostructured composites.29,30 Here, it worth mentioning that the lanthanide-ion (Ln3+) doped up/downconverting nanomaterials have received considerable attention due to their unique tunable electronic and magnetic properties that enable wide applications in optoelectronics, solid state lasers, security printing, biomedical diagnostics, sensors, catalysis and biological imaging.31–34 However, their applications in the energy conversion is not frequently reported. The unique electronic/optical properties of the rare earth phosphors arise from the parity forbidden f–f transitions shielded by filled 5s and 5p orbitals and the phonon energy of the host lattice. Lanthanide-ion doped luminescent materials exhibit sharp emission, long luminescence-lifetime (in ms), large and tunable Stokes and anti-Stokes shift, low autofluorescence and background noise, non-blinking feature and low toxicity.35,36 In particular, the upconversion is a unique photoluminescence process that involves the conversion of lower energy (e.g. near-infra red (NIR)) photons into higher energy (e.g. visible or ultraviolet (UV)) photons.37 The lattice structure (and its effect on the phonon energy, electronic levels) and morphology of the host matrix is quite important for the efficient electronic transition between rare earth energy levels. An appropriate host–lattice combination with low phonon-energy is desirable to minimize the non-radiative losses.38 Among various classes of rare-earth compounds (e.g. oxides, fluorides, phosphates, vanadates etc.), the rare earth fluorides, as host matrices, possess lowest phonon-energy (ca. 350 cm−1) of crystal lattice and wide band gap.37,39 Among the rare earth fluorides investigated so far, NaYF4 possesses lower phonon-energy (∼360 cm−1), wider band-gap (∼8 eV) and high refractive index.40,41 Thermodynamically stable hexagonal phase β-NaGdF4 is another efficient host matrix for the down-conversion (DC) and up-conversion (UC) luminescence processes due to half filled 4f orbital resulting in minimal non-radiative electronic transition.42,43 Moreover, the Gd3+ ion substitution renders paramagnetic properties, thus the Ln3+ doped β-NaGdF4 phosphors result in multifunctional luminescent-magnetic probes.42,43
In this contribution, we designed and fabricated a novel, multifunctional NIR active β-NaGdF4:18% Yb3+, 2% Er3+ mesoporous TiO2 (mTiO2) nanocomposite. We explored its applications in photocatalysis, photovoltaics and biomedical sciences. This composite is designed to significantly improve the photon absorption in broader area of the solar spectrum. The upconversion phosphor β-NaGdF4:18% Yb3+, 2% Er3+ harvest NIR photons and induce anti-Stokes visible emission and the mTiO2 absorbs in the UV and weak visible spectrum, thereby improving broad photon capture and photon conversion efficiency (PCE). Moreover, the mesoporous TiO2 is expected to increase the photocatalytic activity by increasing the active sites and enhancing the dye-adsorption in the DSSCs. Moreover, the mesoporous TiO2 can also enhance the drug loading for PDT and enhanced chemotherapy as combined therapy for the treatment of cancer. Simultaneously, the β-NaGdF4:Yb, Er UCNPs can endow luminescence-magnetic resonance imaging guided cancer therapy. In this article, the β-NaGdF4:Yb3+,Er3+/mTiO2 nanocomposite was characterized for various physical properties and its photoluminescence and magnetic properties were also investigated. The photocatalytic and photovoltaic properties of the β-NaGdF4:Yb3+,Er3+/mTiO2 nanocomposite were also studied. To the best of our knowledge, for the first time we have proposed and designed a multifunctional β-NaGdF4:Yb3+,Er3+/mTiO2 nanocomposite as a single platform with simultaneous multiple discrete functionalities.
2. Materials and method
2.1. Materials
All the chemicals were of analytical grade and were used as-received without any further purification. Gadolinium(III) nitrate hexahydrate (Gd (NO3)3·6H2O), ytterbium(III) nitrate hexahydrate (Yb (NO3)3·6H2O), and erbium(III) nitrate hexahydrate (Yb (NO3)3·6H2O) (purity ≥ 99.89%), polyethyleneimine branched polymer (average MW ∼ 25![[thin space (1/6-em)]](https://www.rsc.org/images/entities/char_2009.gif) 000), and titanium butoxide were purchased from Sigma Aldrich Inc. Ammonium fluoride (NH4F) and sodium chloride (NaCl) were received from Thomas Baker Chemicals Pvt. Ltd. Absolute ethanol (purity ≥ 99.9%) was obtained from Cympran Gludt BV, Belgium. Deionized water was used throughout the experiment.
000), and titanium butoxide were purchased from Sigma Aldrich Inc. Ammonium fluoride (NH4F) and sodium chloride (NaCl) were received from Thomas Baker Chemicals Pvt. Ltd. Absolute ethanol (purity ≥ 99.9%) was obtained from Cympran Gludt BV, Belgium. Deionized water was used throughout the experiment.
2.2. Synthesis
![[thin space (1/6-em)]](https://www.rsc.org/images/entities/char_2009.gif) :
:![[thin space (1/6-em)]](https://www.rsc.org/images/entities/char_2009.gif) 1) β-NaGdF4:18% Yb3+, 2% Er3+/TiO2 nanocomposite, 0.45 g of NaGdF4:18% Yb3+, 2% Er3+ nanoparticles were dispersed in 15 mL ethanol with continuous stirring for 30 min. After that, 0.45 mL titanium tetra-n-butoxide was introduced dropwise to the suspension followed by another 30 min of magnetic stirring. Subsequently, ethanol/water (7.5 mL
1) β-NaGdF4:18% Yb3+, 2% Er3+/TiO2 nanocomposite, 0.45 g of NaGdF4:18% Yb3+, 2% Er3+ nanoparticles were dispersed in 15 mL ethanol with continuous stirring for 30 min. After that, 0.45 mL titanium tetra-n-butoxide was introduced dropwise to the suspension followed by another 30 min of magnetic stirring. Subsequently, ethanol/water (7.5 mL![[thin space (1/6-em)]](https://www.rsc.org/images/entities/char_2009.gif) :
:![[thin space (1/6-em)]](https://www.rsc.org/images/entities/char_2009.gif) 0.375 mL) solution was added dropwise to the suspension and which was stirred for 60 min. The resulting suspension was then transferred into a 25 mL capacity Teflon-lined stainless steel autoclave, sealed and heated at 190 °C for 24 h. After that, the autoclave was cooled down to the room temperature, and the resulting product was separated centrifugally and was washed with distilled water and absolute ethanol. Then, the product was calcined at 250 °C for 1 h in ambient condition.
0.375 mL) solution was added dropwise to the suspension and which was stirred for 60 min. The resulting suspension was then transferred into a 25 mL capacity Teflon-lined stainless steel autoclave, sealed and heated at 190 °C for 24 h. After that, the autoclave was cooled down to the room temperature, and the resulting product was separated centrifugally and was washed with distilled water and absolute ethanol. Then, the product was calcined at 250 °C for 1 h in ambient condition.| (1/T1)obs = (1/T1)d + r1[M] |
To investigate the contrast enhancement effect, the T1-weighted magnetic resonance images were acquired at RT using a 3 T Philips MR scanner using Standard Spin-Echo (SE) sequence. Various concentrations of samples (0, 0.05, 0.25, 0.5, 0.8 mM) in water were placed in a series of 2 mL tubes for T1-weighted MRI images. The following parameters were adopted: repetition time (TR) = 500 ms, echo time (TE) = 9.4 ms, matrix size = 128 pixels × 128 pixels, field of view (FOV) = 90, number of signal averages = 2, and slice thickness = 3 mm.
3. Characterization techniques
The phase purity and crystallinity of the as-prepared samples were characterized by X-ray diffraction (XRD) using a PANalytical X’PERT PRO instrument and the iron-filtered Cu-Kα radiation (λ = 1.5406 Å) in the 2θ range of 10–80° with a step size of 0.02°. To further confirm the crystalline phase and formation of composite material, Raman spectroscopy measurements were recorded at room temperature on an HR 800 Raman spectrophotometer (Jobin Yvon, Horiba, France) equipped with achromatic Czerny–Turner type monochromator (800 mm focal-length) with silver treated mirrors. Monochromatic radiation emitted by a He–Ne laser (633 nm) and 325 nm laser, operating at 20 mW was used. A detector with accuracy in the range between 450 and 850 nm of ±1 cm−1, equipped with thermoelectrically cooled (with Peltier junctions), multi-channel, spectroscopic grade charge coupled detector (1024 × 256 pixels of 26 μm) with dark current lower than 0.002 electrons per pixel per s was used. To analyze the morphology of the samples, field emission scanning electron microscopy (FESEM: Hitachi S-4200) was done. Energy-dispersive X-ray analysis (EDXA) of the samples was performed during field emission scanning electron microscopy measurements to obtain the elemental composition of the samples. The specific structure details, morphology, and size were obtained by using FEI Tecnai F30 high resolution transmission electron microscope (HRTEM) equipped with a super-twin lens (s-twin) operated at 300 keV accelerating voltage with Schottky field emitter source with maximum beam current (>100 nA) and small energy spread (0.8 eV or less). The point-to-point resolution of the microscope is 0.20 nm and line resolution of 0.102 nm with a spherical aberration of 1.2 mm and chromatic aberration of 1.4 mm with 70 μm objective aperture size. The powder samples obtained were dispersed in ethanol and then drop-casted on carbon-coated copper TEM grids with 200 mesh and loaded to a single tilt sample holder.The optical properties of the as-synthesized samples were investigated by a Jasco UV-vis-NIR (Model V570) dual beam spectrometer operated at a resolution of 2 nm. The upconversion emission spectra were obtained using an ACTON SP2300 spectrometer attached to a PMT under 980 nm CW diode laser excitations. Lifetime measurements were carried by using an Edinburgh Instruments FLSP 920 system, having a 60 W microsecond flash lamp as the excitation source under 980 nm pulse laser excitation. Brunauer–Emmett–Teller (BET) surface area and porosity analysis were measured by using Quantachrome surface area analyzer under N2 atmosphere. Fourier transform infrared spectrum (FTIR) was recorded by FTIR – 8300 Fourier transform infrared spectrophotometer (SHIMADZU). Magnetic property measurements of samples were performed using VSM (Vibrating Sample Magnetometer) attachment physical property measurement system (PPMS) from Quantum Design Inc., San Diego, CA, equipped with a 9 T superconducting magnet For dc magnetic measurements, the samples were precisely weighed and packed inside a plastic sample holder which fit into a brass sample holder with negligible contribution in the overall magnetic signal. The M–H loops were collected at a rate of 75 Oe s−1 in a field sweep from −40 to 40 kOe at the vibrating frequency of 40 Hz. Current–voltage characteristics were calculated by irradiating the cell with 100 mW cm−2 (450 W xenon lamp, Oriel instrument); 1 sun AM 1.5 G filter was used to simulate the solar spectrum. The active area of the cell was 0.5 cm2. The photocurrent was measured by using a Series 2400 Source Measure Unit from Keithley Instruments, Inc., Cleveland, Ohio.
4. Result and discussion
4.1. Phase and morphology characterization
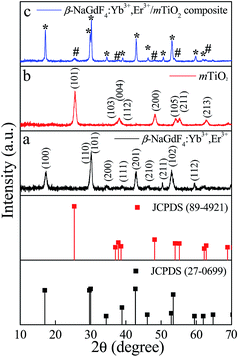
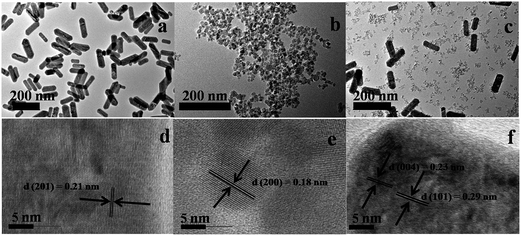
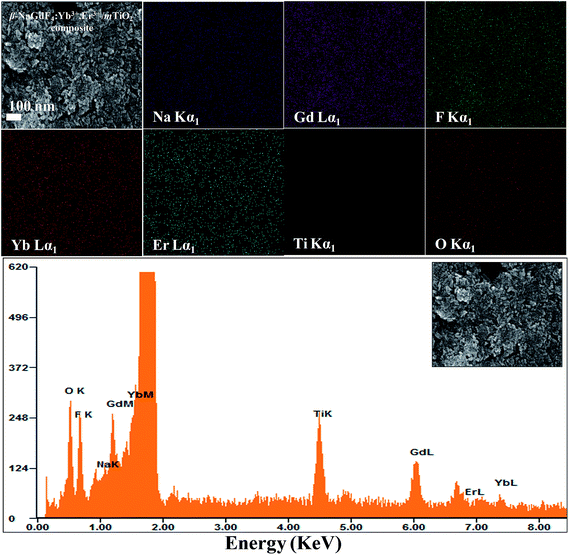
The composition, crystallinity and phase purity of the as-prepared samples were first examined by XRD. The Fig. 1 compares, typical XRD patterns of the as-synthesized (1) NaGdF4:18% Yb3+, 2% Er3+, (2) TiO2, and (3) NaGdF4:18% Yb3+, 2% Er3+/TiO2 nanocomposite. The sharp diffraction peaks of the NaGdF4:18% Yb3+, 2% Er3+ (Fig. 1(a)) can be indexed to the pure hexagonal phase β-NaGdF4 (space group: P63/m). The calculated lattice parameters are a = 6.0 Å, c = 3.6 Å, which is in good agreement with the reported data (JCPDS no. 27-0699). The absence of any secondary phase in the XRD patterns indicates the high purity of as-prepared samples. This also reveals that, the Yb3+and Er3+ ions have been effectively doped into the β-NaGdF4 host lattice. The diffraction peaks of the TiO2 (Fig. 1(b)) can be indexed to pure anatase phase (space group: I41). The calculated lattice parameters are a = 3.7 Å, c = 9.5 Å, which are consistent with reported data (JCPDS no. 89-4921). As shown in the XRD pattern of β-NaGdF4:18% Yb3+, 2% Er3+/TiO2 nanocomposite (Fig. 1(c)), the characteristic diffraction peaks of anatase phase TiO2 are observed, and also the β-NaGdF4:18% Yb3+, 2% Er3+ still maintains the pure hexagonal phase structure.The size, shape and structure of the as-prepared samples were characterized by FESEM and TEM (Fig. 2 and 3). As shown in Fig. 2(a) and 3(a), β-NaGdF4:18% Yb3+, 2% Er3+ crystals possess highly monodispersed rod-shape structure with an average diameter ∼ 100 nm and length of ∼300 nm. The TiO2 particles have quasi-spherical structure with average size of ∼40 nm (Fig. 2(b) and 3(b)). The images of β-NaGdF4:18% Yb3+, 2% Er3+/mTiO2 nanocomposite (Fig. 2(c) and 3(c)) possesses TiO2 nanoparticles dispersed around the β-NaGdF4:18% Yb3+, 2% Er3+ nanorods. The high resolution TEM (HRTEM) images of β-NaGdF4:18% Yb3+, 2% Er3+ (Fig. 3(d)), TiO2 (Fig. 3(e)) and β-NaGdF4:18% Yb3+, 2% Er3+/TiO2 nanocomposite (Fig. 3(f)) reveal highly crystalline nature of the as-prepared products which is consequent with the XRD patterns. The lattice fringes with interplanar spacing of 0.18 nm and 0.21 nm were ascribed to (200) and (201) planes of anatase TiO2 nanoparticles and hexagonal phase β-NaGdF4:18% Yb3+, 2% Er3+ nanorods, respectively. The HRTEM image of β-NaGdF4:18% Yb3+, 2% Er3+/mTiO2 nanocomposite shows lattice fringes from both mTiO2 nanoparticles (d(004) = 0.23 nm) and β-NaGdF4:18% Yb3+, 2% Er3+ nanorods (d(101) = 0.29 nm). The EDX elemental analysis of the β-NaGdF4:18% Yb3+, 2% Er3+/mTiO2 nanocomposite (Fig. 4) shows that the Na, Gd, F, Yb, Er, Ti and O were detected in the nanocomposite.
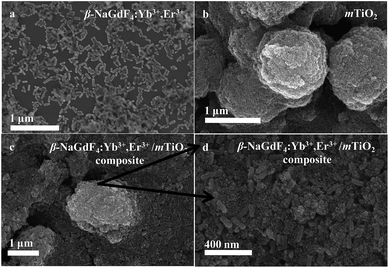 | ||
| Fig. 2 The FESEM images of (a) β-NaGdF4:Yb3+,Er3+ (b) mTiO2, (c) β-NaGdF4:Yb3+,Er3+/mTiO2 nanocomposite, and (d) zoom view of the image (c) shown by arrows. | ||
4.2. Surface properties
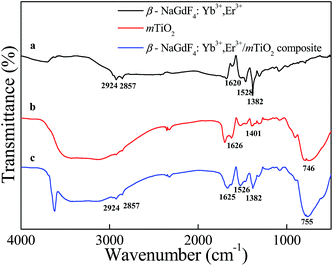
The surfaces-capping of upconverting β-NaGdF4:Yb3+,Er3+ nanorods was done in situ (during the synthesis itself) by using a cationic polymer, polyethyleneimine (PEI). The polyethyleneimine is a stable, water dispersible and biocompatible polymer and thus considered as a versatile effective polymer for drug delivery applications.46,47 The surface properties of PEI-coated β-NaGdF4:Yb3+,Er3+ samples were studied by Zeta potential and FTIR. The ζ-potential of β-NaGdF4:Yb3+,Er3+ nanorods in the aqueous medium (pH = 7) was measured to be +45 mV, indicating the successful capping of PEI. Owing to the presence of free amino group at the surface, the nanorods were readily dispersed in water to form a stable and visibly transparent suspension. The ζ-potentials of as-prepared mTiO2 and PEI-capped β-NaGdF4:Yb3+,Er3+/mTiO2 nanocomposite were determined to be +31 mV and +24 mV respectively.Fig. 5 shows the FTIR spectrum of amine functionalized β-NaGdF4:Yb3+,Er3+, pristine mTiO2 and PEI-capped β-NaGdF4:Yb3+,Er3+/mTiO2 nanocomposite. The PEI capped β-NaGdF4:Yb3+,Er3+ nanorods exhibited two weak absorption bands (Fig. 5(a)) at 2924 cm−1 and 2857 cm−1 corresponding to asymmetric and symmetric stretching vibrations of C–H bond respectively. The IR-bands centered at 1630 cm−1 and 1382 cm−1 were observed, which can be attributed to the N–H bending mode of amino group (–NH2) and N–H stretching vibration of amide bonds, thereby revealing the capping of PEI on the surface of nanorods.48,49 Meanwhile, the sharp absorption bands centered at 1528 cm−1 were attributed to the free amine groups present on the surface of nanorods.50 The band located at 746 cm−1 is due to titanium oxide (Fig. 5(b)) and is assigned to Ti–O–Ti stretching vibration. The absorption band at 1401 cm−1 is attributed to the lattice vibrations of TiO2. The sharp absorption band centered at 1626 cm−1 is due to bending vibration of Ti–OH.51 Fig. 5(c), shows FTIR spectrum of β-NaGdF4:Yb3+,Er3+/mTiO2 nanocomposite, which clearly exhibits the absorption band at 1382 cm−1 for amide bond vibrations characteristic of amine functionalized β-NaGdF4 and also the absorption band centered at 755 cm−1 for Ti–O–Ti vibration characteristic of pristine TiO2.
The Brunauer–Emmett–Teller (BET) specific surface area and porosity of TiO2 was investigated by using the N2 adsorption–desorption isotherm analysis. As shown in Fig. S1,† the as-prepared TiO2 exhibited a typical IV isotherm with H2 type hysteresis loop and indicating the presence of mesoporous structure according to the IUPAC classification, generated from the capillary condensation in mesopores.52,53 Using multipoint BET method, the measured BET specific surface area values of TiO2 was found to be ∼100 m2 g−1, and pore size ∼3.8 nm. Herein, we can therefore conclude that, the as-prepared TiO2 is mesoporous in nature (mTiO2). The mesoporous materials are advantageous due to their distinctive properties such as high surface area and uniform pore size distribution, which is beneficial for applications in photocatalysis and solar cells.
To further explore the local structure of β-NaGdF4:Yb3+,Er3+/mTiO2 nanocomposite, Raman spectroscopy was used to analyze the vibrational properties of the sample. Fig. 6, shows the comparative Raman spectra of β-NaGdF4:Yb3+,Er3+, mTiO2 and β-NaGdF4:Yb3+,Er3+/mTiO2 nanocomposite. The Raman spectra of these samples have been recorded under two laser excitation lines; 633 nm and 325 nm. For pristine TiO2, 633 nm and for pristine β-NaGdF4:Yb3+,Er3+ 325 nm excitation is used. Raman spectra of β-NaGdF4:Yb3+,Er3+/mTiO2 nanocomposite was studied under both 633 nm and 325 nm excitations. The Raman spectra of TiO2 clearly exhibit six Raman bands at 144 cm−1 (Eg), 197 cm−1 (Eg), 396 cm−1 (B1g), 514 cm−1 (A1g), 519 cm−1 (B1g), and 638 cm−1 (Eg) characteristics of pure anatase phase TiO2.13 The Raman spectra of β-NaGdF4:Yb3+,Er3+ revealed phonon bands of NaGdF4. The strongest phonon modes were observed at ∼308, ∼319, ∼359, ∼400 cm−1, which are in fair agreement with the reported values for NaLnF4.43,54 These Raman bands are attributed to the host lattice vibrations of Gd–F and Na–F distances, bond strength and vibration features.55 The average weighted position of the band system was observed to be ∼347 cm−1. This is corresponding to the phonon energy, which is low as compare to other fluoride host lattices such as LiYF4 (570 cm−1),56 suggesting the fact that NaGdF4 is an efficient host lattice for enhanced upconversion luminescence. The Raman spectra of β-NaGdF4:Yb3+,Er3+/mTiO2 nanocomposite at excitation wavelength line 633 nm, also exhibit characteristic Raman bands of anatase TiO2. At excitation wavelength line 325 nm as shown in Fig. S2,† the characteristic Raman bands of NaGdF4 and anatase TiO2 overlapped rendering a broad band between 150 and 450 cm−1. The 519 cm−1 (B1g), and 638 cm−1 (Eg) Raman bands of TiO2 are slightly shifted to higher wavenumbers.
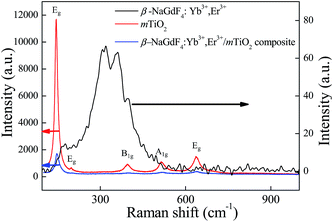 | ||
| Fig. 6 The comparative Raman spectra of β-NaGdF4:Yb3+,Er3+, mTiO2 and β-NaGdF4:Yb3+,Er3+/mTiO2 nanocomposite. | ||
4.3. UV-vis-NIR absorption spectra analysis
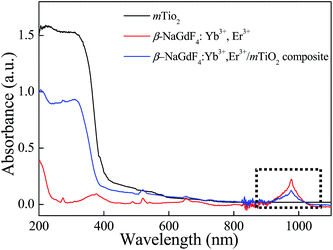
The typical UV-vis-NIR absorption spectra of β-NaGdF4:Yb3+,Er3+, mTiO2 and β-NaGdF4:Yb3+,Er3+/mTiO2 nanocomposite are compared in Fig. 7. The absorption spectra of β-NaGdF4:Yb3+,Er3+ show the relatively wide absorption range of ∼100 nm at the NIR region ∼980 nm, corresponds to the absorption of Yb3+.This large absorption cross section from about 900 to 1100 nm, overlaps one of the maximum NIR energy distribution ranges of sunlight. The pure mTiO2 exhibits an absorption edge at ∼400 nm corresponding to its bandgap and also exhibits weak absorption in visible region upto about 600 nm. This visible light absorption is due to the carbon doping into the TiO2 lattice during calcinations; wherein the titanium butoxide precursor serves as a carbon source, which contributes to the mid-band gap electronic states in TiO2.57,58 When mTiO2 was combined with β-NaGdF4:Yb3+,Er3+, the β-NaGdF4:Yb3+,Er3+/mTiO2 nanocomposite represented a combination of strong UV absorption and weak visible absorption (due to TiO2) alongwith the NIR light absorption band (due to β-NaGdF4:Yb3+,Er3+) at ∼980 nm. Therefore, from the UV-vis-NIR absorption spectra it can be speculated that after absorbing the NIR photons, β-NaGdF4:Yb3+,Er3+ can emit UV and visible light via upconversion process that can be absorbed by anatase TiO2 which are dispersed around β-NaGdF4:Yb3+,Er3+ via an energy transfer between them. These characters indicate that the material can definitely enhance the utilization rate of solar energy in photocatalysis as well as in solar cells.4.4. Upconversion luminescence properties of the nanocomposite
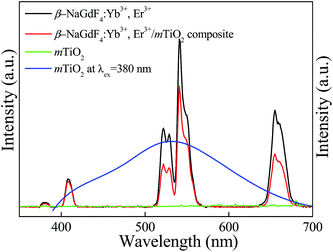
The Yb3+,Er3+ co-doped phosphors based on hexagonal phase fluoride host matrix show most efficient green and red upconversion luminescence.37 The upconversion process involves conversion of low energy photons to higher energy photon through sequential absorption of two or more photons and energy transfer. The energy separation of the 2F7/2 ground state of Yb3+ and its 2F5/2 excited state matches well the transition energy between the 4I11/2 and 4I15/2 states and also the 4F7/2 and 4I11/2 states of Er3+, thus allowing for efficient (quasi-) resonant energy transfer between the two ions.37 The Fig. 8 compares the upconversion photoluminescence (PL) spectra of β-NaGdF4:18% Yb3+, 2% Er3+, mTiO2, and β-NaGdF4:18% Yb3+, 2% Er3+/mTiO2 nanocomposite under 980 nm laser excitation and fluorescence spectrum of mTiO2 at 380 nm excitation. It can be evidently seen that, in β-NaGdF4:18% Yb3+, 2% Er3+ and NaGdF4:18% Yb3+, 2% Er3+/mTiO2 nanocomposite samples, the peak-positions in the emission spectra remain similar, and the bands differ only in their relative intensities. The emission spectrum monitored under the excitation of 980 nm NIR laser, β-NaGdF4:18% Yb3+, 2% Er3+ emits intense green upconversion luminescence. The spectra display four distinct Er3+ emission bands. The weak violet emission peak at ∼408 nm is assigned to electronic transition from 2H9/2 → 4I15/2. The emission peaks at ∼521 and ∼540 nm in the green region are assigned to transitions from 2H11/2 and 4S3/2 to 4I15/2. The red emission peak at ∼655 nm, results from 4F9/2 → 4I15/2 transition.59 Furthermore, both the samples exhibit a strong green-to-red emission ratio. The mTiO2 rendered fluorescence emission band at ∼532 nm and a small shoulder at ∼445 nm respectively under 380 nm excitation, and when the emission spectrum of mTiO2 was monitored under the excitation of 980 nm NIR laser, no emission band is observed. This means that, the upconversion luminescence in β-NaGdF4:Yb3+,Er3+/mTiO2 nanocomposite under 980 nm excitation is truly from β-NaGdF4:Yb3+,Er3+ component.The emission intensities of the β-NaGdF4:18% Yb3+, 2% Er3+/mTiO2 nanocomposite decrease to certain degree in comparison with the pristine upconversion spectrum of β-NaGdF4:18% Yb3+, 2% Er3+. The calculated light emission intensity ratios of the emission peak at 521 nm, 540 nm, and 655 nm of pure β-NaGdF4:18% Yb3+, 2% Er3+ and β-NaGdF4:18% Yb3+, 2% Er3+/mTiO2 nanocomposite are ∼1.80, ∼1.38, and ∼1.83, respectively. This spectral change should be due to the introduction of mTiO2 nanoparticles which may absorb the emitted light to some extent resulting in the diminution of emission light intensity.
This conclusion is further supported by time-resolved dynamic curves of Er3+ ions. The luminescence decay curves of Er3+ ions for the 4S3/2 → 4I15/2 (λex = 980 nm, λem = 540 nm; green) and 4F9/2 → 4I15/2 (λex = 980 nm, λem = 654 nm; red) emission transition in β-NaGdF4:Yb3+,Er3+ and β-NaGdF4:Yb3+,Er3+/mTiO2 nanocomposite were recorded at 980 nm laser excitation, as shown in Fig. S3.† As can be seen from Table 1, the luminescence lifetime time of nanocomposite is decreased as compared to β-NaGdF4:Yb3+,Er3+. The decay times of the 4S3/2 → 4I15/2 (λex = 980 nm, λem = 540 nm; green) and 4F9/2 → 4I15/2 (λex = 980 nm, λem = 654 nm; red) emission transition decreased from 0.15, and 0.36 ms in pure β-NaGdF4:Yb3+,Er3+ to 0.10, and 0.29 ms, respectively, in β-NaGdF4:Yb3+,Er3+/mTiO2 nanocomposite. This occurs because, the lifetime of excited state, τ depends of the radiative transition rate (WR), non-radiative transition rate (WNR) and energy transfer rate, which can be expressed as τ = 1/(WR + WNR + WET). Thus, the presence of anatase mTiO2 around β-NaGdF4:Yb3+,Er3+, creates non-radiative energy transfer from the excited state of Er3+ ions to mTiO2. Such an additional energy transfer process accelerated the relaxation of the excited state of Er3+, leading to the reduction of the luminescence lifetime.60
| Sample (λex = 980 nm) | Lifetime (ms) | |
|---|---|---|
| 4S3/2 → 4I15/2 (λem = 540 nm) | 4F9/2 → 4I15/2 (λem = 654 nm) | |
| β-NaGdF4:Yb3+,Er3+ | 0.15 | 0.36 |
| β-NaGdF4:Yb3+,Er3+/mTiO2 nanocomposite | 0.10 | 0.29 |
4.5. Large increase in the photocatalytic degradation of dyes by the composites
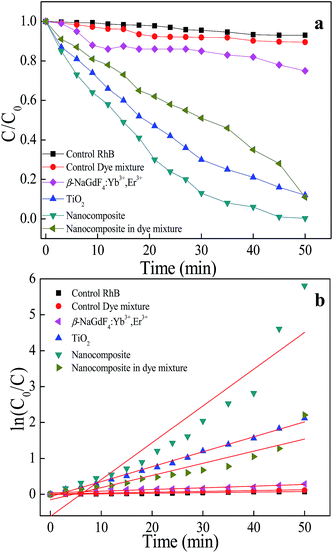
The photocatalytic measurements were performed by exposing the β-NaGdF4:18% Yb3+/2% Er3+ nanorods, mTiO2 and β-NaGdF4:18% Yb3+, 2% Er3+/mTiO2 nanocomposite to the direct sunlight irradiation to test the material in actual working conditions which can not be truly simulated in the lab environment. For this purpose, we studied the degradation behavior of rhodamine B (RhB) and dye mixture containing equivalent rhodamine B (RhB), methylene blue (MB), methyl orange (MO), and malachite green (MG). The study of degradation behavior of dye-mixture is significant because the industrial and textile wastewater consist of mixture of various dyes. The sample suspensions were kept in dark overnight for adsorption-desorption to reach the equilibrium. The photocatalytic experiments were performed on 14 April 2015 in Pune, India (latitude: 18°32′25.3′′N & longitude: 73°48′42.3′′E) from 11:00 AM (Sun's altitude: 51°, heading 149° SSE) to 12:00 PM (Sun's altitude: 55°, heading 172° S). The temperature was ∼30 °C. The UV-visible absorbance spectra for the degradation of rhodamine B (RhB) and dye-mixture, catalyzed by β-NaGdF4:18% Yb3+, 2% Er3+/mTiO2 nanocomposite, are compared in the Fig. S4.† The degradation of dyes was observed through the reduction in the absorbance peak intensity with an increase in the irradiation time. The kinetics of the reaction was plotted as (C/C0) against time (t), where C0 is the initial concentration and C is the final concentration of different dyes (Fig. 9(a)). The characteristic absorbance peaks of RhB (λ ∼ 554 nm) and dye mixture (∼617 nm and ∼554 nm) were used as references for the photocatalytic degradation for respective dyes. The photocatalytic efficiency of the nanocomposite can be evaluated by calculating the time-dependent (C/C0) ratio of the dye and compared with the blank sample (as control), mTiO2, and β-NaGdF4:18% Yb3+, 2% Er3+ nanorods. It can be seen from Fig. 9(a) that the photocatalytic activity of the β-NaGdF4:18% Yb3+, 2% Er3+/mTiO2 nanocomposite is higher than that of the other samples. The blank test confirms that RhB and dye mixture is quite stable. In the absence of the catalyst, no obvious change in the concentration of RhB and dye mixture concentration is observed after the irradiation for 50 min. The chromophore of the RhB gets almost completely degraded (∼99%) in presence of the β-NaGdF4:18% Yb3+, 2% Er3+/mTiO2 nanocomposite under the sunlight irradiation for 50 min whereas, β-NaGdF4:18% Yb3+, 2% Er3+ and mTiO2 degraded ∼25% and ∼88% respectively under similar condition. The nanocomposite also efficiently degraded dye-mixture down to ∼89% in 50 min. In comparison with the carbon doped mesoporous TiO2, which is a well-known benchmark catalyst, the photocatalytic activity of the β-NaGdF4:18% Yb3+, 2% Er3+/mTiO2 nanocomposite is higher (∼20%). It is worth noting that the photocatalytic efficiency of this nanocomposite is comparable and higher than the reported values for similar composites system.2,61,62The photocatalytic degradation kinetics was studied; the degradation of dyes follows apparent first order kinetics according to Langmuir–Hinshelwood (L–H) model, which is well-established for heterogeneous photocatalyst at low dye concentration.63 The relevant equation is
As shown in the Fig. 9(b), the photocatalytic degradation of RhB catalyzed by the as-prepared samples fits well a first order reaction kinetics. A plot of ln(C0/C) vs. t provides a slope value, which is the rate constant (k) of the dye degradation by the samples. The k-value of RhB degradation by β-NaGdF4:18% Yb3+, 2% Er3+, mTiO2, and β-NaGdF4:18% Yb3+, 2% Er3+/mTiO2 nanocomposite was ∼4.66 × 10⁻³ min−1, ∼4.16 × 10⁻² min−1 and ∼1.02 × 10⁻¹ min−1 respectively. The k value for the degradation of dye mixture by the nanocomposite was ∼3.38 × 10⁻² min−2. The high rate constant of the β-NaGdF4:18% Yb3+, 2% Er3+/mTiO2 nanocomposite further suggest its high photocatalytic activity.
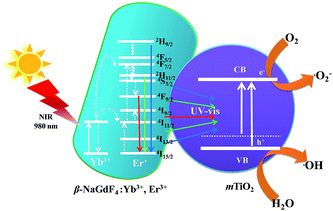
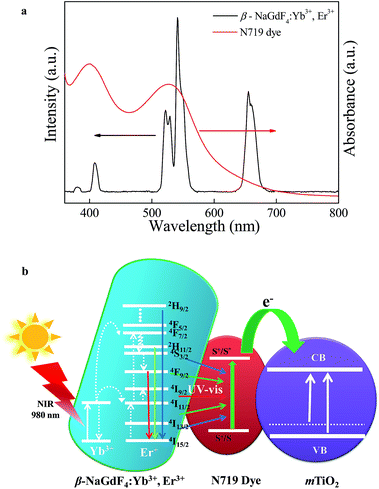
The mechanism of NIR driven photocatalysis of the β-NaGdF4:18% Yb3+, 2% Er3+/mTiO2 nanocomposite is described in the Fig. 10. The upconversion phosphor β-NaGdF4:18% Yb3+, 2% Er3+ absorbs photons in NIR and upconverts to UV and visible photons, which are reabsorbed by mTiO2. The Yb3+ acts as a sensitizer in the β-NaGdF4:Yb3+,Er3+ phosphor and it could absorb 980 nm NIR radiations, which results in populating the 2F5/2 level. After that, the excited electron would transfer back to the 2F7/2 ground state and the released energy is nonradiatively transferred to activator ions Er3+, resulting in the population of the higher 4F9/2, 4S3/2, 2H11/2 and 2H9/2 energy levels of Er3+ via successive energy transfer process from Yb3+ ions. Finally, these excited electrons would transfer to the 4I15/2 ground state of Er3+ and radiatively emit in the UV and visible region.37 The as-emitted photons could be reabsorbed by the mTiO2 nanoparticles, which have photon absorption bands in the UV and visible regions due to small amount of carbon doping in mTiO2 during the synthesis. The mTiO2 nanoparticles are excited by the energy transfer from upconversion phosphors and generate high energy electrons (e−) and holes (h+) in the conduction band (CB) and valence band (VB). The photogenerated holes oxidize water molecules present on the surface of the catalyst and produce hydroxyl ˙OH radicals. The electrons in the conduction band react with O2 molecules to form reactive ˙O2− radicals. The reactive radical species ˙OH and ˙O2− degrade the dye molecules by forming by-products such as CO2, ammonia etc.64
4.6. The enhanced photovoltaic characteristics and performance
The photovoltaic properties of DSSCs fabricated with the mTiO2 and β-NaGdF4:18% Yb3+, 2% Er3+/mTiO2 nanocomposite were measured and compared in the Fig. 11. The light harvesting property of the as-synthesized β-NaGdF4:18% Yb3+, 2% Er3+/mTiO2 nanocomposite was investigated by preparing a film of the material (sensitized with the N719 dye) on FTO substrate, followed by the photoelectric conversion measurements by fabricating a DSSC. Due to the incorporation of the upconversion phosphor material into the mTiO2, there will be an increase in the photon scattering as well as their absorption as, in addition to the visible region photons, the photons in the IR-region of the spectrum are also utilized. In this system, the upconverting nanorods harvest NIR sunlight and transform into visible via anti-Stokes emission, which is directly reabsorbed by photoactive TiO2, thereby improving power conversion efficiency (PCE) in DSSC's. The Fig. 11 shows the current density–voltage curves of the assembled solar cell under 100 mW cm−2 illumination using dye-adsorbed mTiO2 and β-NaGdF4:18% Yb3+, 2% Er3+/mTiO2 nanocomposite as photoanode and their photovoltaic parameters are summarized in Table 2. The overall performance of the above described solar cell can be evaluated in terms of cell efficiency (η) and fill factor (FF) expressed as: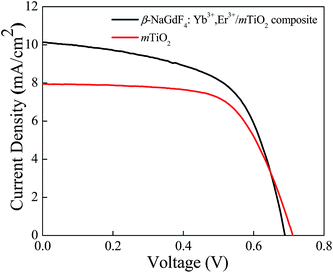 | ||
| Fig. 11 Current density vs. potential curves for dye-sensitized solar cell fabricated from mTiO2, and β-NaGdF4:Yb3+,Er3+/mTiO2 nanocomposite. | ||
| Samples | Jsc (mAcm−2) | Voc (V) | FF (%) | η (%) |
|---|---|---|---|---|
| mTiO2 | 7.9 | 0.71 | 64 | 3.6 |
| β-NaGdF4:Yb3+,Er3+/mTiO2 composite | 10.5 | 0.68 | 59 | 4.3 |
It was found that in the composite material, the photocurrent density (Jsc) increased from 7.9 to 10.5 mA cm−2, and the open-circuit voltage (Voc), decreased from 0.71 to 0.68 V. The fill-factor of nanocomposite decreased from 64 to 59% and the photon to electron conversion efficiency of the nanocomposite increased from 3.6 to 4.3%. The β-NaGdF4:18% Yb3+, 2% Er3+/mTiO2 nanocomposite film effectively pass and scatter the incident photons through the backside of the photoelectrode and thus, able to generate more photoelectrons to enhance the power conversion efficiency of the cell. Moreover, it should be noted that, in comparison to the DSSC made with mTiO2 film, the β-NaGdF4:18% Yb3+, 2% Er3+/mTiO2 nanocomposite film DSSC system resulted in increased photocurrent density by ∼24%. This enhancement is attributed to the enhanced light harvesting of dye molecule, which is due to presence of upconversion phosphor that enhances harvesting by utilizing NIR photons as well. The overall efficiency of the DSSC increased by 17% in the composite material compared to only mTiO2 which support the advantageous effect of the synthesis of β-NaGdF4:18% Yb3+, 2% Er3+/mTiO2 nanocomposite material and benefit of employ it as photoanode in liquid junction solar cell.
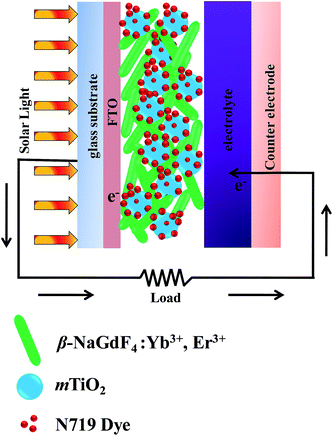
The Fig. 12 and 13 illustrate the configuration and the response mechanism of the DSSC based on the β-NaGdF4:Yb3+,Er3+/mTiO2 nanocomposite. A typical DSSC consists of a dye-sensitized nanocrystalline TiO2 semiconductor film on a conductive glass, an electrolyte solution containing an I−/I3 redox couple, and a platinum film as a counter electrode.65 Upon excitation, the dye molecules absorb photons and inject electrons into the conduction band of TiO2 from the excited state of the dye.65 A major factor limiting the performance of DSSCs is the inability of utilizing near-infrared (NIR) photons. The most commonly used photosensitizers such as N3, N719, and N749 dyes can absorb UV and visible light.66 Here, in this system with the aid of upconversion β-NaGdF4:Yb3+,Er3+ phosphor, the NIR light is utilized from broad solar spectrum. The β-NaGdF4:Yb3+,Er3+ phosphor is excited by NIR energy and emits intense green visible light, which is reabsorbed by photosensitizer N719 dye. Fig. 13(a) shows the absorption spectrum of the N719 dye and the UC emission spectrum of β-NaGdF4:Yb3+,Er3+ nanorods. It can be clearly seen that the absorption band of the N719 dye is resonant with the green emission (540 nm) of the β-NaGdF4:Yb3+,Er3+ phosphor, thus the N719 dye is able to efficiently absorb the green emitted light. Consequently, the NIR light absorbed by the upconversion phosphor can be effectively used to excite the dye molecules, which further injects electrons to mTiO2, finally which in turn will help increase the performance of DSSCs in the NIR region. Similar kind of systems have been studied, where the semiconductor (TiO2) based DSSC's are modified with upconverting nanoparticles and thus, upconversion phosphors are utilized to improve the photovoltaic performance.67–69
4.7. Magnetic properties of the nanocomposite and its potential application as MRI contrast enhancer
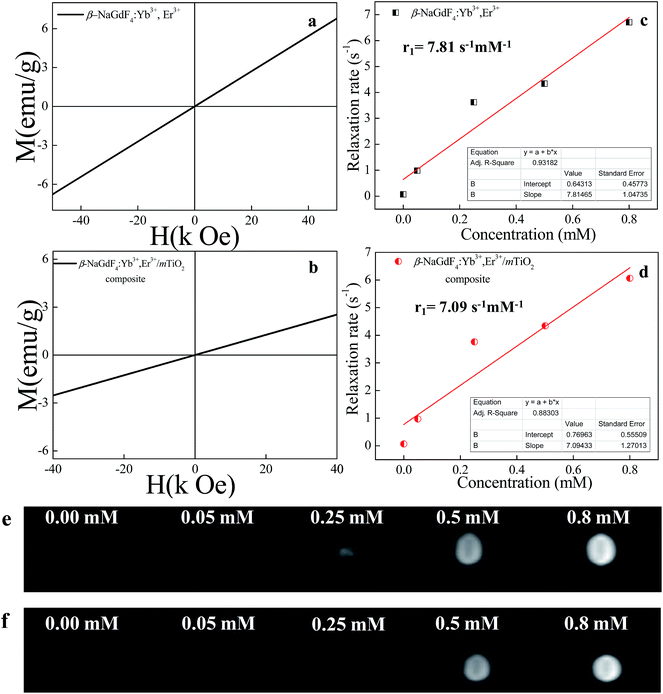
In addition to the excellent upconversion luminescence property, the amine functionalized β-NaGdF4:18% Yb3+/2% Er3+ nanorods as well as β-NaGdF4:18% Yb3+, 2% Er3+/mTiO2 nanocomposite exhibited paramagnetism (Fig. 14), which makes these nanorods suitable as a MRI contrast agent. The Fig. 14(a) and (b), show the room temperature (RT) magnetization (M) as a function of the applied magnetic field (H) for the amine functionalized β-NaGdF4:18% Yb3+/2% Er3+ nanorods and the β-NaGdF4:18% Yb3+, 2% Er3+/mTiO2 nanocomposite respectively. These nanorods exhibit typical paramagnetic behavior at 300 K and applied field in range from −40 to +40 kOe. The paramagnetic properties of the Gd3+ ions arise from seven unpaired inner 4f electrons, which are closely bound to the nucleus and effectively shielded from crystal field by the outer filled 5s2 5p6 shell electrons. Thus, it prohibits sufficient overlap of the orbitals associated with the partially filled 4f electrons shells of the Gd3+ ions necessary for ferromagnetism. It turns out that the magnetic moments associated with the Gd3+ ions are all localized and non-interacting thereby giving rise to paramagnetism.70 The magnetic mass susceptibility of β-NaGdF4:18% Yb3+/2% Er3+ nanorods and β-NaGdF4:18% Yb3+, 2% Er3+/mTiO2 nanocomposite are ∼1.36 × 10⁻⁴ emu g−1 Oe−1 and ∼6.45 × 10⁻⁵ emu g−1 Oe−1 respectively. Furthermore, the magnetization of β-NaGdF4:18% Yb3+/2% Er3+ nanorods and β-NaGdF4:18% Yb3+, 2% Er3+/mTiO2 nanocomposite is ∼2.75 emu g−1 and ∼1.30 emu g−1 respectively at 20 kOe. These values are close to the reported values of nanoparticles, which are used very frequently for bioseparation and are also successfully used as T1-MRI contrast agent.71 To further demonstrate the potential application of the β-NaGdF4:18% Yb3+/2% Er3+ nanorods as a MRI contrast agent, a series of β-NaGdF4:18% Yb3+/2% Er3+ nanorods and β-NaGdF4:18% Yb3+, 2% Er3+/mTiO2 nanocomposites with different molar concentrations were used for the ionic longitudinal relaxivity (r1) study using the NMR spectrometer. From the slope of plot of 1/T1 verses Gd3+ ion concentration (Fig. 14(c) and (d)), the relaxation rate 1/T1 (r1) value for the of β-NaGdF4:18% Yb3+/2% Er3+ nanorods and β-NaGdF4:18% Yb3+, 2% Er3+/mTiO2 nanocomposites were determined to be 7.81 s−1 mM−1 and 7.09 s−1 mM−1 respectively. The obtained longitudinal relaxivity values are higher than that of the commercially clinically used Gd-based MRI contrast agent such as Gd-DTPA/Magnevist (r1 = ∼3.8 s−1 mM−1), Gd-DOTA/Dotarem (r1 = ∼3.2 s−1 mM−1)72,73 and other reported potential inorganic nanoparticles as KGdF4 (r1 = ∼5.8 s−1 mM−1),45 GdF3 (r1 = ∼1.4 s−1 mM−1),74 Gd2O3 (r1 = ∼5.1 s−1 mM−1),75 NaGdF4 (r1 = ∼7.2 s−1 mM−1),76 NaGdF4:Yb/Er (20/2)@NaGdF4 (r1 = ∼1.05 s−1 mM−1)77 etc. Thus, we believe the as prepared β-NaGdF4:Yb,Er (UCNPs) can be a potential MRI contrast agent.In general, the longitudinal T1 relaxivity value increases for smaller size nanoparticles, due to larger surface to volume (S/V) ratio, consequently large number of surface Gd3+ ion interacting with water protons. This results due to 1/r6 dependence of water proton relaxation on distance between Gd3+ ions and water protons.78 The high S/V ratio wherein the distance between Gd3+ ions and water protons decreases, results in higher relaxivity. However, various number of anomalies of this inference has been reported so far in different literature which can be seen from the table below:
According to the given examples, many larger particles possess larger longitudinal relaxivity (r1) value as compare to the smaller particles. Thus, inverse relation of size and r1 values is not always true. There are many other factors influencing longitudinal relaxivity (r1) value, such as Gd3+ concentration, distribution of Gd3+ ions in crystal in outer and inner sphere,76,83 molecular tumbling time effect,84 presence of ligands affecting interaction with water protons84,85 etc.
Considering Gd3+ ion concentration constant and gradient distribution of Gd3+ ion unknown, we believe in this paper the higher relaxivity of as-prepared PEI capped β-NaGdF4:Yb/Er, in spite of its quite larger size is evidently due to longer tumbling time owing to larger size and large coordinated number of water molecule due to increased water dispersibility by PEI capping of β-NaGdF4:Yb/Er nanorods. It is reported that, the bigger nanoparticles (NPs) have longer tumbling times (τR), i.e., surface ions on bigger NPs tumble more slowly than on the smaller NPs. This fact accounts for the increase in r1/SA values with increase in NP size, which is in counteract to the effect of the S/V ratio and making the surface Gd3+ ions on a larger NP affect the relaxivity more strongly than the ions on a smaller NPs.76
Similar was reported by Hou et al., where relaxivity of large size (20 nm) NaGdF4 was greater (r1 = 8.78 s−1 mM−1) than smaller NaGdF4 (15 nm size; r1 = 5.7 s−1 mM−1).85 Similarly, relaxivity of Gd2O3@MSN composite (size = 25 nm; r1 = 45.08 s−1 mM−1) was greater than pure Gd2O3 nanoparticles (size = 2.5 nm; r1 = 14.93 s−1 mM−1).84
Fig. 14(e) and (f) shows typical T1-weighted MRI images of β-NaGdF4:18% Yb3+/2% Er3+ nanorods and β-NaGdF4:18% Yb3+, 2% Er3+/mTiO2 nanocomposite. The T1-weighted imaging for the samples was performed for 4 different concentrations varying from 0.05 to 0.8 mM (water for the reference signal) on a 3T MR scanner. With the increasing concentration, the T1-weighted MRI signal intensity was clearly enhanced, thus showed positive enhancement effect, demonstrating that the of β-NaGdF4:18% Yb3+/2% Er3+ nanorods and β-NaGdF4:18% Yb3+, 2% Er3+/mTiO2 nanocomposite might be an effective T1-MRI contrast agent.
5. Conclusion
In summary, the multifunctional NIR light active β-NaGdF4:18% Yb3+, 2% Er3+/mTiO2 nanocomposites were designed for its applications in photocatalysis, photovoltaics and biomedical sciences etc. The upconversion phosphor β-NaGdF4:18% Yb3+, 2% Er3+ utilizes the NIR light and the mesoporous TiO2 (mTiO2) utilizes the UV and weak visible which improves the photon harvesting across the solar spectrum (UV, visible and NIR region). Moreover, the mesoporosity of TiO2 is expected to increase the active sites for an efficient photocatalysis and enhance the dye adsorption in the DSSCs. The photocatalytic activity of the nanocomposite was investigated via the decoloration of RhB and dye mixture (RhB, MB, MO and MG) under the direct solar light irradiation. In comparison to pure-mTiO2, the photocatalytic activity of nanocomposite is fairly improved, which presents a unified approach to enhance the solar energy harvesting ability of TiO2 based catalytic materials. The efficiency of the DSSC increased by 17% in the nanocomposite as compared to only mTiO2, by an increment in the photocurrent density which indicates that the improvement in the light harvesting capability of dye-molecules is achieved by the presence of phosphor particles. The longitudinal relaxivity (r1) value of β-NaGdF4:18% Yb3+, 2% Er3+/mTiO2 nanocomposite were close to those of materials reported for MRI and bio-separation. To the best of our knowledge, for the first time we have proposed and designed a multifunctional β-NaGdF4:18% Yb3+, 2% Er3+/mTiO2 nanocomposite as a single platform with simultaneous multiple discrete functionalities of excellent luminescence properties, intrinsic paramagnetism and relaxivity, biocompatibility, photocatalytic activity, and solar cell efficiency, thus these may find other promising applications in bio-imaging, magnetic resonance imaging, water-splitting, photodynamic therapy, NIR triggered anticancer drug delivery and cancer therapy.Acknowledgements
Pankaj Poddar acknowledges the Centre for Excellence in Surface Science at the CSIR-National Chemical Laboratory, and network project Nano-Safety, Health & Environment (SHE) funded by the Council of Scientific and Industrial Research (CSIR), India, and the Department of Science & Technology (DST), India through and Indo-Israel grant to develop materials for solar-voltaic energy devices (DST/INT/ISR/P-8/2011). Authors also acknowledge Dr P. R. Rajmohanan and Ms Kavya, NMR group, CSIR-National Chemical Laboratory, Pune, for the help with NMR measurements. Preeti Padhye acknowledges the support from the University Grant Commission (UGC), India for providing the Senior Research Fellowship (SRF).References
- I. K. Konstantinou and T. A. Albanis, Appl. Catal., B, 2004, 49, 1–14 CrossRef CAS
.
- C. Wang, K. Song, Y. Feng, D. Yin, J. Ouyang, B. Liu, X. Cao, L. Zhang, Y. Han and M. Wu, RSC Adv., 2014, 4, 39118–39125 RSC
.
- B. O'Regan and M. Grätzel, Nature, 1991, 353, 737–740 CrossRef
.
- X. Guo, W. Di, C. Chen, C. Liu, X. Wang and W. Qin, Dalton Trans., 2014, 43, 1048–1054 RSC
.
- I.-C. Kang, Q. Zhang, S. Yin, T. Sato and F. Saito, Environ. Sci. Technol., 2008, 42, 3622–3626 CrossRef CAS PubMed
.
- P. Roy, S. Berger and P. Schmuki, Angew. Chem., Int. Ed., 2011, 50, 2904–2939 CrossRef CAS PubMed
.
- J. Liu, Q. Zhang, J. Yang, H. Ma, M. O. Tade, S. Wang and J. Liu, Chem. Commun., 2014, 50, 13971–13974 RSC
.
- Y. Zhang and Z. Hong, Nanoscale, 2013, 5, 8930–8933 RSC
.
- W. Wang, M. Ding, C. Lu, Y. Ni and Z. Xu, Appl. Catal., B, 2014, 144, 379–385 CrossRef CAS
.
- W. Qin, D. Zhang, D. Zhao, L. Wang and K. Zheng, Chem. Commun., 2010, 46, 2304–2306 RSC
.
- P. Goswami and J. N. Ganguli, Dalton Trans., 2013, 42, 14480–14490 RSC
.
- G. Liu, Y. Zhao, C. Sun, F. Li, G. Q. Lu and H.-M. Cheng, Angew. Chem., Int. Ed., 2008, 47, 4516–4520 CrossRef CAS PubMed
.
- G. Yang, Z. Jiang, H. Shi, T. Xiao and Z. Yan, J. Mater. Chem., 2010, 20, 5301–5309 RSC
.
- X. Wu, S. Yin, Q. Dong, C. Guo, T. Kimura, J. Matsushita and T. Sato, J. Phys. Chem. C, 2013, 117, 8345–8352 CAS
.
- J. Yu, T. Ma and S. Liu, Phys. Chem. Chem. Phys., 2011, 13, 3491–3501 RSC
.
- J. Tang, Z. Zou and J. Ye, Angew. Chem., Int. Ed., 2004, 43, 4463–4466 CrossRef CAS PubMed
.
- M. C. Pereira, E. M. Garcia, A. Cândido da Silva, E. Lorençon, J. D. Ardisson, E. Murad, J. D. Fabris, T. Matencio, T. de Castro Ramalho and M. V. J. Rocha, J. Mater. Chem., 2011, 21, 10280–10282 RSC
.
- P. Padhye and P. Poddar, J. Mater. Chem. A, 2014, 2, 19189–19200 CAS
.
- A. Biswas, R. Das, C. Dey, R. Banerjee and P. Poddar, Cryst. Growth Des., 2014, 14, 236–239 CAS
.
- P. Gupta and P. Poddar, RSC Adv., 2015, 5, 10094–10101 RSC
.
- S.-L. Li, K.-J. Jiang, K.-F. Shao and L.-M. Yang, Chem. Commun., 2006, 2, 2792–2794 RSC
.
- A. Burke, L. Schmidt-Mende, S. Ito and M. Grätzel, Chem. Commun., 2007, 234–236 RSC
.
- G. B. Shan and G. P. Demopoulos, Adv. Mater., 2010, 22, 4373–4377 CrossRef CAS PubMed
.
- S. Sadhu and P. Poddar, J. Phys. Chem. C, 2014, 118, 19363–19373 CAS
.
- H. Q. Wang, M. Batentschuk, A. Osvet, L. Pinna and C. J. Brabec, Adv. Mater., 2011, 23, 2675–2680 CrossRef CAS PubMed
.
- Q. C. Xu, Y. Zhang, M. J. Tan, Y. Liu, S. Yuan, C. Choong, N. S. Tan and T. T. Y. Tan, Adv. Healthcare Mater., 2012, 1, 470–474 CrossRef CAS PubMed
.
- C. Wang, L. Cheng and Z. Liu, Theranostics, 2013, 3, 317–330 CrossRef PubMed
.
- L. Zeng, Y. Pan, Y. Tian, X. Wang, W. Ren, S. Wang, G. Lu and A. Wu, Biomaterials, 2015, 57, 93–106 CrossRef CAS PubMed
.
- L. Cheng, K. Yang, Y. Li, J. Chen, C. Wang, M. Shao, S. T. Lee and Z. Liu, Angew. Chem., Int. Ed., 2011, 50, 7385–7390 CrossRef CAS PubMed
.
- J. Kim, Y. Piao and T. Hyeon, Chem. Soc. Rev., 2009, 38, 372–390 RSC
.
- T. V. Gavrilović, D. J. Jovanović, V. Lojpur and M. D. Dramićanin, Sci. Rep., 2014, 4, 1–9 Search PubMed
.
- C. Li and J. Lin, J. Mater. Chem., 2010, 20, 6831–6847 RSC
.
- J.-C. G. Bünzli and C. Piguet, Chem. Soc. Rev., 2005, 34, 1048–1077 RSC
.
- Z. Cheng and J. Lin, Macromol. Rapid Commun., 2015, 36, 790–827 CrossRef CAS PubMed
.
- W. Zheng, D. Tu, P. Huang, S. Zhou, Z. Chen and X. Chen, Chem. Commun., 2015, 51, 4129–4143 RSC
.
- L. D. Carlos, R. A. S. Ferreira, V. de Zea Bermudez, B. Julián-López and P. Escribano, Chem. Soc. Rev., 2011, 40, 536–549 RSC
.
- M. Haase and H. Schäfer, Angew. Chem., Int. Ed., 2011, 50, 5808–5829 CrossRef CAS PubMed
.
- F. Wang and X. Liu, Chem. Soc. Rev., 2009, 38, 976–989 RSC
.
- R. X. Yan and Y. D. Li, Adv. Funct. Mater., 2005, 15, 763–770 CrossRef CAS
.
- C. Li, C. Zhang, Z. Hou, L. Wang, Z. Quan, H. Lian and J. Lin, J. Phys. Chem. C, 2009, 113, 2332–2339 CAS
.
- M. Banski, M. Afzaal, A. Podhorodecki, J. Misiewicz, A. L. Abdelhady and P. O'Brien, J. Nanopart. Res., 2012, 14, 1228 CrossRef PubMed
.
- Y. Liu, D. Tu, H. Zhu, R. Li, W. Luo and X. Chen, Adv. Mater., 2010, 22, 3266–3271 CrossRef CAS PubMed
.
- M. Banski, A. Podhorodecki, J. Misiewicz, M. Afzaal, A. L. Abdelhady and P. O'Brien, J. Mater. Chem. C, 2013, 1, 801–807 RSC
.
- S. Ito, P. Chen, P. Comte, M. K. Nazeeruddin, P. Liska, P. Péchy and M. Grätzel, Prog. Photovoltaics, 2007, 15, 603–612 CAS
.
- Q. Ju, D. Tu, Y. Liu, R. Li, H. Zhu, J. Chen, Z. Chen, M. Huang and X. Chen, J. Am. Chem. Soc., 2012, 134, 1323–1330 CrossRef CAS PubMed
.
- T. Xia, M. Kovochich, M. Liong, H. Meng, S. Kabehie, S. George, J. I. Zink and A. E. Nel, ACS Nano, 2009, 3, 3273–3286 CrossRef CAS PubMed
.
- O. Boussif, F. Lezoualc'h, M. A. Zanta, M. D. Mergny, D. Scherman, B. Demeneix and J. P. Behr, Proc. Natl. Acad. Sci. U. S. A., 1995, 92, 7297–7301 CrossRef CAS
.
- L. Q. Xiong, Z. G. Chen, M. X. Yu, F. Y. Li, C. Liu and C. H. Huang, Biomaterials, 2009, 30, 5592–5600 CrossRef CAS PubMed
.
- Z. Yi, S. Zeng, W. Lu, H. Wang, L. Rao, H. Liu and J. Hao, ACS Appl. Mater. Interfaces, 2014, 6, 3839–3846 CAS
.
- F. Wang, D. K. Chatterjee, Z. Li, Y. Zhang, X. Fan and M. Wang, Nanotechnology, 2006, 17, 5786–5791 CrossRef CAS
.
- S. S. Mali, C. A. Betty, P. N. Bhosale and P. S. Patil, ECS J. Solid State Sci. Technol., 2012, 1, M15–M23 CrossRef CAS
.
- X. W. Lou and L. A. Archer, Adv. Mater., 2008, 20, 1853–1858 CrossRef CAS
.
- J. Chen, Z. Hua, Y. Yan, A. A. Zakhidov, R. H. Baughman and L. Xu, Chem. Commun., 2010, 46, 1872–1874 RSC
.
- M. M. Lage, R. L. Moreira, F. M. Matinaga and J. Gesland, Chem. Mater., 2005, 17, 4523–4529 CrossRef CAS
.
- D. Yuan, M. C. Tan, R. E. Riman and G. M. Chow, J. Phys. Chem. C, 2013, 117, 13297–13304 CAS
.
- J. F. Suyver, J. Grimm, M. K. van Veen, D. Biner, K. W. Krämer and H. U. Güdel, J. Lumin., 2006, 117, 1–12 CrossRef CAS
.
- Y. Park, W. Kim, H. Park, T. Tachikawa, T. Majima and W. Choi, Appl. Catal., B, 2009, 91, 355–361 CrossRef CAS
.
- X. Wu, S. Yin, Q. Dong, B. Liu, Y. Wang, T. Sekino, S. W. Lee and T. Sato, Sci. Rep., 2013, 3, 1–8 Search PubMed
.
- C. Li, Z. Quan, J. Yang, P. Yang and J. Lin, Inorg. Chem., 2007, 46, 6329–6337 CrossRef CAS PubMed
.
- X. Guo, W. Song, C. Chen, W. Di and W. Qin, Phys. Chem. Chem. Phys., 2013, 15, 14681–14688 RSC
.
- K. Zhou, Y. Zhu, X. Yang, X. Jiang and C. Li, New J. Chem., 2011, 35, 353–359 RSC
.
- L. Ren, X. Qi, Y. Liu, Z. Huang, X. Wei, J. Li, L. Yang and J. Zhong, J. Mater. Chem., 2012, 22, 11765–11771 RSC
.
- K. Lee and S. Hamid, Materials, 2015, 8, 339–354 CrossRef
.
- A. S. Bhadwal, R. M. Tripathi, R. K. Gupta, N. Kumar, R. P. Singh and A. Shrivastav, RSC Adv., 2014, 4, 9484–9490 RSC
.
- J. Gong, J. Liang and K. Sumathy, Renewable Sustainable Energy Rev., 2012, 16, 5848–5860 CrossRef CAS
.
- C. Yuan, G. Chen, L. Li, J. A. Damasco, Z. Ning, H. Xing, T. Zhang, L. Sun, H. Zeng, A. N. Cartwright, P. N. Prasad and H. Ågren, ACS Appl. Mater. Interfaces, 2014, 6, 18018–18025 CAS
.
- L. Liang, Y. Liu and X.-Z. Zhao, Chem. Commun., 2013, 49, 3958–3960 RSC
.
- C. H. Han, H. S. Lee, K. Won Lee, S. Do Han and I. Singh, Bull. Korean Chem. Soc., 2009, 30, 219–223 CrossRef CAS
.
- G.-B. Shan, H. Assaaoudi and G. P. Demopoulos, ACS Appl. Mater. Interfaces, 2011, 3, 3239–3243 CAS
.
- H.-T. Wong, H. L. W. Chan and J. H. Hao, Appl. Phys. Lett., 2009, 95, 022512 CrossRef
.
- S. Zeng, M.-K. Tsang, C.-F. Chan, K.-L. Wong, B. Fei and J. Hao, Nanoscale, 2012, 4, 5118–5124 RSC
.
- M. Rohrer, H. Bauer, J. Mintorovitch, M. Requardt and H.-J. Weinmann, Invest. Radiol., 2005, 40, 715–724 CrossRef PubMed
.
- C. Dong, A. Korinek, B. Blasiak, B. Tomanek and F. C. J. M. van Veggel, Chem. Mater., 2012, 24, 1297–1305 CrossRef CAS
.
- Q. Ju, Y. Liu, D. Tu, H. Zhu, R. Li and X. Chen, Chem.–Eur. J., 2011, 17, 8549–8554 CrossRef CAS PubMed
.
- S. Majeed and S. A. Shivashankar, J. Mater. Chem. B, 2014, 2, 5585–5593 RSC
.
- N. J. J. Johnson, W. Oakden, G. J. Stanisz, R. Scott Prosser and F. C. J. M. van Veggel, Chem. Mater., 2011, 23, 3714–3722 CrossRef CAS
.
- Y. I. Park, J. H. Kim, K. T. Lee, K. Jeon, H. Bin Na, J. H. Yu, H. M. Kim, N. Lee, S. H. Choi, S. Baik, H. Kim, S. P. Park, B. Park, Y. W. Kim, S. H. Lee, S. Yoon, I. C. Song, W. K. Moon, Y. D. Suh and T. Hyeon, Adv. Mater., 2009, 21, 4467–4471 CrossRef CAS
.
- N. Luo, C. Yang, X. Tian, J. Xiao, J. Liu, F. Chen, D. Zhang, D. Xu, Y. Zhang, G. Yang, D. Chen and L. Li, J. Mater. Chem. B, 2014, 2, 5891–5897 RSC
.
- G. K. Das, B. C. Heng, S. Ng, T. White, J. S. C. Loo, L. D'Silva, P. Padmanabhan, K. K. Bhakoo, S. T. Selvan and T. T. Y. Tan, Langmuir, 2010, 26, 8959–8965 CrossRef CAS PubMed
.
- I.-F. Li, C. Su, H. Sheu, H. Chiu, Y. Lo, W. Lin, J. Chen and C. Yeh, Adv. Funct. Mater., 2008, 18, 766–776 CrossRef CAS
.
- X. Zhang, Z. Zhao, X. Zhang, D. B. Cordes, B. Weeks, B. Qiu, K. Madanan, D. Sardar and J. Chaudhuri, Nano Res., 2015, 8, 636–648 CrossRef CAS
.
- J. Zhou, Y. Sun, X. Du, L. Xiong, H. Hu and F. Li, Biomaterials, 2010, 31, 3287–3295 CrossRef CAS PubMed
.
- C. Dong, J. Pichaandi, T. Regier and F. C. J. M. van Veggel, J. Phys. Chem. C, 2011, 115, 15950–15958 CAS
.
- K. Ni, Z. Zhao, Z. Zhang, Z. Zhou, L. Yang, L. Wang, H. Ai and J. Gao, Nanoscale, 2016, 8, 3768–3774 RSC
.
- Y. Hou, R. Qiao, F. Fang, X. Wang, C. Dong, K. Liu, C. Liu, Z. Liu, H. Lei, F. Wang and M. Gao, ACS Nano, 2013, 7, 330–338 CrossRef CAS PubMed
.
Footnote |
| † Electronic supplementary information (ESI) available. See DOI: 10.1039/c6ra06813h |
| This journal is © The Royal Society of Chemistry 2016 |

