Sisal-derived activated carbons for cost-effective lithium–sulfur batteries
M. Raja,
N. Angulakshmi†
and
A. Manuel Stephan*
Electrochemical Power Sources Division, CSIR – Central Electrochemical Research Institute, Karaikudi, 630 006, India. E-mail: arulmanuel@gmail.com; amstephan@cecri.res.in
First published on 26th January 2016
Abstract
Elemental sulfur was successfully impregnated in an activated carbon (AC) matrix obtained from sisal fibers. The impregnation of sulfur in the activated carbon (S-AC) matrix was confirmed by XRD, SEM and Raman analyses. The sulfurized activated carbon (S-AC) composite electrode was employed as a cathode material for lithium–sulfur (Li–S) cell. The Li–S cell delivered a discharge capacity of 950 mA h g−1 at 0.1C-rate. The electrochemical impedance spectroscopy measurements were carried out for the Li–S cell before and after cycling and also at different depth of discharge and depth of charge. A stable cycling was achieved at 1C-rate.
Introduction
Although lithium-ion batteries have been identified as a potential power source for portable electronic gadgets such as laptop computers, mobile phones, digital cameras etc., they cannot meet the demands for hybrid electric vehicles and power grid applications.1,2 Among the cathode materials for rechargeable lithium batteries explored so far, the elemental sulfur offers a highest theoretical capacity of 1672 mA h g−1 which is approximately ten times higher than that of lithium transition metal oxides or phosphates.3 The unique properties such as low cost, widespread availability, better safety, wide operating temperature and long cycle life make lithium–sulfur batteries more attractive.4,5 However, commercialization of lithium–sulfur batteries is hampered due to the poor electrical conductivity of sulfur (5 × 10⁻³⁰ S cm−1 at 25 °C), formation, shuttling of higher-order polysulfides during charging and poor interfacial properties of lithium metal anode. Numerous review articles describe the working principle of Li–S batteries, the-state-of-art, advantages and their limitations.6–9 Basically, sulfur cathode hosts two lithium-ions by dissimilation (non-topotactic) process and supports for the electrochemical redox reaction 16Li + S8 → 8Li2S6.Although, Li–S battery system was introduced by Herbert and Ulam10 in 1962, its technological importance was realized only in the beginning of year 2000. Different strategies have been made to enhance the electrical contact of sulfur by wrapping/impregnating it with electrically conducting carbonaceous materials. The change in the volume of sulfur during cycling can be effectively controlled by cavities and porous structure. This pores/cavities can also be used to absorb the polysulfides formed in situ during the cycling process.9
Several methods were employed to prevent the formation and shuttling of polysulfides; for e.g. incorporation of electrolyte additives,11,12 metal oxide absorbents.13,14 However, the performance of Li–S cells was not appreciable. In order to enhance electrical conductivity, sulfur particles were either coated with carbon precursor or wrapped by templates. Although macroporous carbons can store 60 wt% of sulfur with its large pore volume, the electrochemical reactivity with Li+ was found to be lower due to the poor electronic conductivity of composite cathode.15 It is therefore, suggested that carbon with a combination mesoporous and microporous will be suitable for the applications in sulfur–carbon composite cathodes.
Manthiram and co-workers reported the cycling profile of sulfur–carbon nanocomposite cathode material comprising high surface area-black pearls. A stable cycling profile was achieved for a Pluronic block co-polymer laden electrode material than the un-laden.16 In a different approach, a flexible composite cathode films composed of CNT and sulfur was successfully employed by Jin et al.,17 in a Li–S cell. The cell retained a discharge capacity of 740 mA h g−1 even after 100 cycles at 0.1C. Attempts have also been made to improve the performance of Li–S batteries by coating conducting polymer over carbon surface.18 Very recently, Bruckner and co-workers demonstrated that the performance of Li–S cathode depends mainly on the amount of electrolyte, sulfur loading and C-rate. According to the authors excess of electrolyte, high rate and low loading of sulfur (approximately 40%) can significantly enhance the cycle life and capacity retention of Li–S batteries.19 This work was further supported by Ye et al.20 Also of importance, the electrolyte for Li–S cells plays a vital role in its performance. The formation of polysulfide reduction and their migration in subsequent cycling remains a problem area.21
Although, the use of carbon as a matrix to wrap/encapsulate sulfur in order to increase its conductivity has been very exotic, the performance of Li–S cells is mainly influenced by nature of carbon, current density, amount of sulfur loaded and nature of the electrolyte.
In the recent past, activated carbons from biomass precursors have been introduced as electrode material for lithium-ion batteries due to their advantages such as inexpensive and waste management. The activated carbons obtained from biomass precursors such as sugar22 peanut shells23 cherry stones24 were used as anode for lithium-ion batteries. One of the authors has employed coffee shells and banana fibers as biomass precursors as active materials for lithium-ion batteries and supercapacitors.25,26 However, the reports on sulfur impregnated activated carbons for applications in lithium–sulfur batteries are very scanty. Very recently, Moreno et al.,27 employed activated carbons derived from olive stones activated with KOH for lithium–sulfur batteries. In the recent years, several attempts have been made to address the issues of lithium batteries by identifying suitable cathodes and electrolytes.28–31
In the present study, sisal fiber (botanical name Agave sisalane) was used as a carbon source for the first time due to its wide availability and low cost. It is widely cultivated in Brazil, Mexico and India. Although, the importance of sisal fiber is diminished (with competition from polypropylene), traditionally, sisal fiber was used as agricultural twine. In the recent years, sisal has been extensively used as a strengthening agent to replace asbestos and fiberglass and also in automobile industries. In the present work the activated carbon obtained from sisal carbon was used to encapsulate sulfur in order to prevent the pulverization of sulfur particles and to enhance their conductivity. Also of importance the electrochemical properties with a focus on electrochemical impedance spectroscopy (EIS) are discussed in order to produce cost-effective lithium–sulfur batteries.
Experimental
Pyrolysis of sisal fibre
High-quality sisal fibers were obtained from fields in Tamilnadu, India and were washed and dried. Finally whitish fibers were treated with concentrated solution of phosphoric acid (H3PO4) as porogen for 5 days at 35 °C. The fiber![[thin space (1/6-em)]](https://www.rsc.org/images/entities/char_2009.gif) :
:![[thin space (1/6-em)]](https://www.rsc.org/images/entities/char_2009.gif) porogen ratio was 1
porogen ratio was 1![[thin space (1/6-em)]](https://www.rsc.org/images/entities/char_2009.gif) :
:![[thin space (1/6-em)]](https://www.rsc.org/images/entities/char_2009.gif) 10 by weight. Pyrolysis was carried out under nitrogen atmosphere at 800 °C at a heating ramp of 5 °C min−1 for a period of 3 h. The obtained activated carbon was washed several times with de-ionized water until it reaches a pH value of 7.
10 by weight. Pyrolysis was carried out under nitrogen atmosphere at 800 °C at a heating ramp of 5 °C min−1 for a period of 3 h. The obtained activated carbon was washed several times with de-ionized water until it reaches a pH value of 7.
Sulfurization of activated carbon
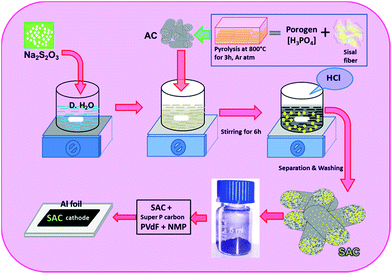
The sulfurized activated carbon (S-AC) was prepared by in situ deposition from aqueous solution of sodium thiosulfate (Na2S2O3·5H2O) with the addition of hydrochloric acid as illustrated in Scheme 1. 10 g of Na2S2O3·5H2O was dissolved in 100 ml of de-ionized water and the solution was allowed for magnetic stirring for more than 12 h along with the activated carbon. The hydrochloric acid (0.5 M) was slowly added to the solution in order to get sulfur precipitate according to the following reaction.| S2O32−(Aq) → S(s) + SO32−(Aq) | (1) |
The sulfur was deposited in/and or on the surface of the activated carbon matrices. The solution was filtered and obtained sulfurized activated carbon (S-AC) was dried and kept at 80 °C in an air oven for 12 h.
Elemental analysis for the S-AC was done by an (Perkin-Elmer CHN 2000) elemental analyzer and the content of sulfur in the carbon matrix was around 60%. Powder X-ray diffraction patterns were recorded between 10° and 80° (Jeol X-ray diffractometer, model, D/Max 2500) fitted with a nickel-filtered Cu-Kα radiation source. The morphologies of the pyrolytic carbons were examined by a (FESEM S-4700, Hitachi, Japan) scanning electron microscope. The histogram on the pore diameter of the activated carbon was measured using a software (Image J) as described by us earlier.32 Thermo gravimetric analysis was conducted in the temperature range between 20–1000 °C at a heating rate of 10 °C min−1 in a N2 atmosphere. The morphology and microstructure of the synthesized products were analyzed using high-resolution transmission electron microscopy (HR-TEM) of JEM-2100 at an acceleration voltage of 200 kV. Brunauer–Emmett–Teller (BET) surface area measurements were carried out using (Micrometrics ASAP2010) surface area analyzer. CHN analysis (ElementerVario EL III-Germany) was performed for the activated and sulfurized activated carbons. Raman spectra were recorded on a (RenishawinVia) spectrometer with He–Ne Laser at a wave length of 633 nm.
Electrochemical characterizations
Sulfur-activated carbon composite (S-AC) electrodes for charge–discharge studies were prepared by doctor blade-coating a slurry of 70 wt% of the S–C, 10 wt% of poly(vinylidene fluoride) and 20 wt% Super P carbon dispersed in N-methyl-2-pyrrolydone on an aluminum foil, followed by drying at 100 °C in an air oven, roller-pressing the dried sheets, and punching out circular sheets. The cyclic voltammetry (CV) curves were recorded (Solartron, UK) at a scan rate of 0.1 mV s−1 between 3 and 1.6 V.A 2032-type coin cell was assembled with S-AC electrode and lithium metal foil (Foote Minerals) with an electrolyte comprising 1 M LiN(CF3SO2)2 in a 1![[thin space (1/6-em)]](https://www.rsc.org/images/entities/char_2009.gif) :
:![[thin space (1/6-em)]](https://www.rsc.org/images/entities/char_2009.gif) 1 (v/v) mixture of 1,3-dioxalane (1,3-DIOX) and tetraethylene glycol dimethylether (TEGDME) in an argon-filled glove box (M Braun, Germany). Galvanostatic charge–discharge profiles were made between 3 V and 1.5 V by a computer-controlled battery testing unit (Arbin, USA). The electrochemical impedance spectroscopy (EIS) measurements were carried out (Biologic, France) before and after cycling and also for different depth of discharge (DOD) and depth of charge (DOC) of the Li–S cell. The values of Rct, Rf and Re were calculated by employing Z view software.
1 (v/v) mixture of 1,3-dioxalane (1,3-DIOX) and tetraethylene glycol dimethylether (TEGDME) in an argon-filled glove box (M Braun, Germany). Galvanostatic charge–discharge profiles were made between 3 V and 1.5 V by a computer-controlled battery testing unit (Arbin, USA). The electrochemical impedance spectroscopy (EIS) measurements were carried out (Biologic, France) before and after cycling and also for different depth of discharge (DOD) and depth of charge (DOC) of the Li–S cell. The values of Rct, Rf and Re were calculated by employing Z view software.
Results and discussions
Carbonization of sisal and their properties
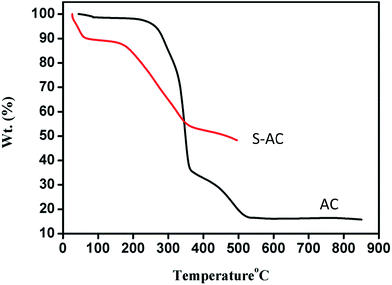
Fig. 1 shows the thermo gravimetric traces of sisal fibers. The observed weight loss of about 2% around 90 °C is attributed to the removal of moisture and further reduction in weight up to 200 °C is due to the release of volatile.33 At 205 °C, hemi-cellulose starts to decompose with a corresponding weight loss of about 70%. Around 330 °C the decomposed hemi-cellulose produce abundant organic compounds such as wood tar, methanol and ketone and were vaporized due to the absorbed heat. Finally, the carbonization starts around 515 °C.34Generally, the heat generated during the decomposition of the porogen or any chemical reaction of the products of decomposition of the porogen with the fibers may alter the chemical composition of the carbonaceous products.35,36 Porosity in carbonaceous materials can be generated by use of several chemical activation agents such as H3PO4, AlCl3, MgCl2, LiCl, Na2CO3, K2CO3, NaOH, KOH, and ZnCl2. Although, numerous attempts have been made on chemical activation, the mechanism of the process is yet to be fully elucidated.37–41
In the present study, the oxygen from the added-H3PO4 acid removes the cross-linking and stabilizes the carbon atoms in crystallites. During the pyrolysis process phosphate may intercalate and force apart the lamellae of the crystallites.42 Removal of phosphate by, say, washing creates microporosity in the new structure.26,42 Further, the surface area of the activated carbon is greatly varied due to the action of the porogens. For example, the BET surface area of AC is 234 m2 g−1 which is approximately six times (43 m2 g−1) higher than that of un-treated. The microstructural evolutions can significantly influence the electrochemical behavior of the carbons.
The nitrogen adsorption/desorption isotherm is depicted in Fig. 2 which clearly indicates the type I nature of the activated carbon spheres of well-developed mesopores. Also it is evident from Fig. 2(b) the peak pore width of the activated carbon lies around 12 Å. The BET surface area and content of carbon, sulfur, nitrogen and hydrogen for the activated and un-activated carbonaceous materials are depicted in Table 1.
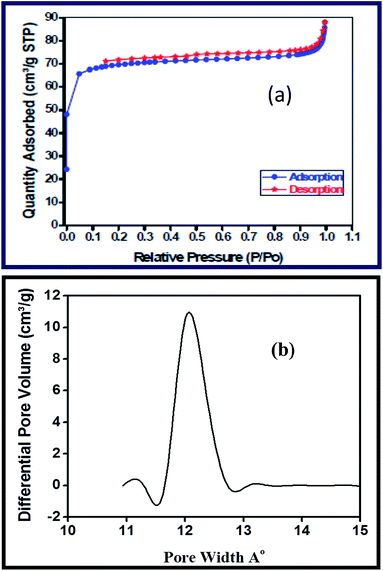 | ||
| Fig. 2 (a) Adsorption/desorption curves of activated carbon. (b) Pore size distribution of activated carbon. | ||
| Type of carbon | BET surface area (m2 g−1) | C (%) | H (%) | N (%) | Pore volume cm3 g−1 |
|---|---|---|---|---|---|
| Untreated | 43 | 64 | 2.1 | 0.16 | 16 |
| Treated | 818 | 40 | 1.4 | 0.07 | 24.5 |
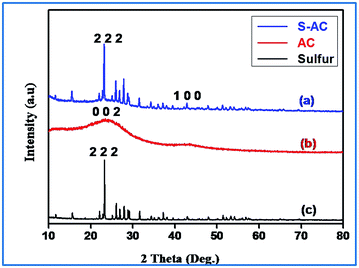
Fig. 3(a) shows the XRD pattern of the sulfur impregnated activated carbon sample. The two peaks that appear at 24° and 43° (2θ) degrees are assigned to the (0 0 2) and (1 0 0) reflections respectively, which represents the crystallographic planes of the graphite. The peak around 43° represents honeycomb structures formed by sp2 hybridized carbons, while the broad (1 0 0) reflection at 24° (0 0 2) indicates small domains of coherent and parallel stacking of the graphene sheets.25,42 Interestingly, the sulfurized activated carbon (S-AC) exhibits (Fig. 3(a)) well-defined sulfur peaks and are assigned to the orthorhombic sulfur polymorph (JCPDS 00-008-0247).
The high intensity peaks indicate that the activated carbon particles obtained from sisal fibers provide deposition sites for elemental sulfur, favoring an environment for precipitation.43 These results are consistent with those reported earlier on carbon–sulfur composites irrespective of the carbon matrix employed.27
Raman spectroscopy has been widely employed to identify carbonaceous materials and also to assess their graphitic content.44
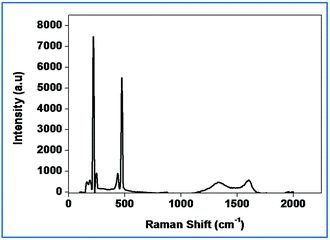
It is clear from Fig. 4 that the intensity of the D and G-Raman scattering peaks of activated carbon at 1350 and 1580 cm−1 represents respectively. The presence of sulfur peaks implies the impregnation of sulfur in the activated carbon matrix. The SEM images (Fig. 5(a) and (b)) reveal the morphology of the activated carbon and sulfurized activated carbon. The S-AC shows a bundle like structure with pores of various diameters that varies from 25–125 micrometers. The white feather like structure which appears on the surface of the carbon is attributed to the presence of ash and was easily removed by washing several times with de-ionized water.34 The sulfurized activated carbon, on the other hand, shows a similar morphology partially filled with sulfur on the surface as well as into the pores. During the preparation process elemental sulfur is partially infiltrated into the carbon due to its adsorption properties and high surface area.27 The TEM and elemental mapping of sulfur images (Fig. 5(c) and (d)) respectively confirms the coating and impregnation of sulfur in the carbon matrix.
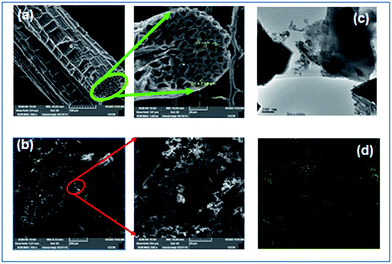 | ||
| Fig. 5 SEM images of (a) activated carbon (b) S-AC and (c) TEM image of S-AC (d) elemental mapping of sulfur. | ||
It is well known that electronic conductivity of carbonaceous materials is influenced by their graphitic structures. In the present study the carbon precursor![[thin space (1/6-em)]](https://www.rsc.org/images/entities/char_2009.gif) :
:![[thin space (1/6-em)]](https://www.rsc.org/images/entities/char_2009.gif) porogen ratio was fixed at 1
porogen ratio was fixed at 1![[thin space (1/6-em)]](https://www.rsc.org/images/entities/char_2009.gif) :
:![[thin space (1/6-em)]](https://www.rsc.org/images/entities/char_2009.gif) 10 be wt% as large amount of H3PO4 could result in serious destruction and rearranging of the layer alignments and reduce the amount of ordered structures, which in turn lower the electronic conductivity of the activated carbon bundles.
10 be wt% as large amount of H3PO4 could result in serious destruction and rearranging of the layer alignments and reduce the amount of ordered structures, which in turn lower the electronic conductivity of the activated carbon bundles.
Moreover, the oxygen groups from the porogen, H3PO4, perhaps intrude into the activated carbon bundles inevitably and reduce the electronic conductivity also. Very recently, it has also been demonstrated that 40% of sulfur loading into the carbon matrix was found to be optimal for achieving better electrochemical properties in terms of cycling stability, high-rate capability and specific discharge capacity.45
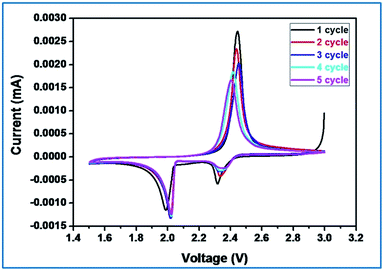
In order to understand the electrochemical properties of sulfurized activated carbon (S-AC) electrode, cyclic voltammetry (CV) was first performed at a scan speed of 0.1 mV s−1 in the potential range of 1.5 V to 3 V as shown in Fig. 6. Typical characteristics of oxidation and reduction curves show the charge–discharge process. The reduction peak that appears around 2.3 V can be assigned to the reduction of open ring of S8 to long chain lithium polysulfides (Li2Sx, 4 ≤ x ≤ 8). The strong cathodic peak at 2.1 V represents the strong reduction of soluble polysulfide anions to Li2S2/Li2S.27,46 In the subsequent cycles, (totally 5 cycles) the redox peak currents and potentials under cathodic current, two reductive peaks are observed at 2.0 and 1.80 V that respectively corresponds to redox reaction of high-order polysulfides and Li2S2/Li2S respectively.
On the other hand, only one oxidation peak was observed at about 2.5 V and is attributed to the oxidation of Li2S and Li2S2 to Li2S8. Further no discernible changes could be seen in the redox peak currents and potentials. After two cycles the anodic oxidation of lithium sulfides to polysulfides, the oxidation peak is stabilized which reveals good reactive reversibility and cycling stability of the S-AC cathode.
Fig. 7(a) shows the typical charge–discharge profile of Li–S cell for different current regimes at 25 °C. It can be seen from the figure that the charge–discharge patterns remain same even at high current regime. The charge–discharge plateaus at different voltages are already explained elsewhere.5,9 The two well defined voltage plateaus at 2.1 and 2.4 V observed in the discharge curve and are in accordance with the two peaks appeared in the CV curves. It is also quite obvious that the activated carbon in the composite electrode is electrochemically inert to the potential region studied and the observed redox curves are attributed only the sulfur present in the composite electrode. The small difference in voltage between the two peaks reflects the asymmetry observed in the oxidation peak in the CV curves.
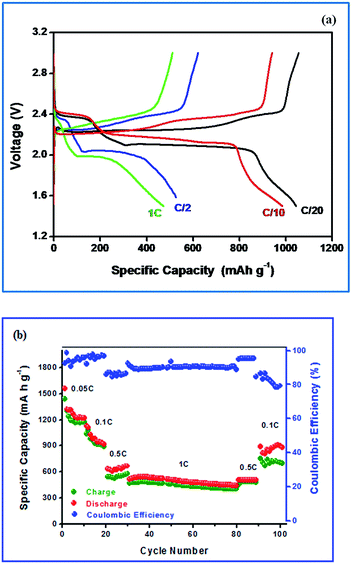 | ||
| Fig. 7 (a) Cycling profile of Li–S cell with S-AC electrode (b) discharge capacity as a function of cycle number. | ||
The cell delivered a discharge capacity of 1050 mA h g−1 during its first discharge at 0.05C-rate which was calculated on the basis of sulfur mass. Generally, pristine sulfur exhibits rapid decrease in discharge capacity with a corresponding coulombic efficiency of sulfur electrode would be 75% and is attributed to the low utilization and insulating nature of sulfur and volume expansion that arises to the pulverization of sulfur and the high solubility of lithium polysulfides.47 The reversible Li–S redox reaction occurs through dissimilation process, non-topotactically, in the present study, the volume expansion during charge–discharge cycling is hampered due to the incorporation of sulfur into the AC matrix.
As seen in Fig. 7(b) the discharge capacity of Li–S cell with S-AC electrode at lower current rates (0.05 and 0.1C) is seen to decrease very rapidly. It is attributed to the dissolution of polysulfides in the electrolyte and their diffusion and reaction with the lithium metal anode. Surprisingly, at 1C-rate (with short charging and discharging time) the capacity fading was significantly reduced and a stable cycleability was achieved with 99% coulombic efficiency. The better cycleability with appreciable coulombic efficiency is attributed to the slower diffusion of polysulfides to the anode than the total electrochemical reaction time.19,48 Generally, measurement of coulombic efficiency is widely employed to quantify the shuttle process. According to Moy and co-workers,49 the measured values of coulombic efficiency may vary due to the rate of charge and discharge with a corresponding duration in the shuttle process. For example, the impact on the shuttle process is high for a Li–S cell at low rates. On the other hand, at high rates of charge and discharge, a high value of coulombic efficiency is observed and thus comparison between the high and low rates becomes highly complicated.50–52
It is also noteworthy to mention that most of the Li–S cells cycled at lower C-rate (0.1C) undergo for a capacity fading rapidly.54–56 The Li–S cell is able to deliver a discharge capacity of 475 mA h g−1 with a stable cycling. The cells were again cycled at 0.1C-rate. However, the cell suffers from low coulombic efficiency.
We are not able to elucidate the mechanism for this undesirable property which is yet to be understood.
The electrochemical impedance spectroscopy, a non-destructive tool, has always been recognized as one of the most powerful techniques for analyzing the various stages of the complicated mechanism of batteries during the electrochemical reaction. It has been widely employed to characterize Li–S batteries as a whole,53 electrolyte compositions54 and their influence in the performance.55
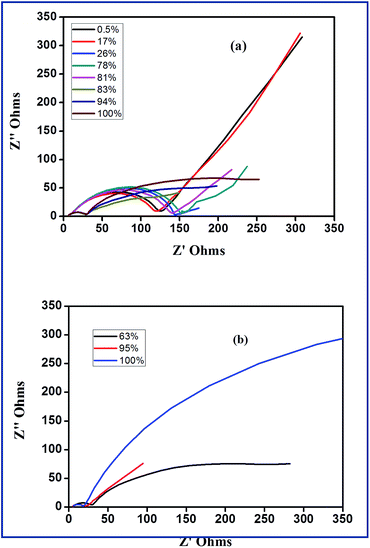
According to Yuan and co-workers,56 EIS can be effectively employed to understand reactions of sulfur cathodes during charge–discharge process. In the frequency domain of EIS, the role of charge transfer resistance, ion diffusion impedance and the influence of Li2S film in terms of its formation, growth and dissolution can be understood. Fig. 8(a) and (b) show the Nyquist plots of S-AC/Li cells at different depth of discharge (DOD) and different depth of charge (DOC). Fig. 9(a) depicts the first discharge–charge profiles of Li–S cell with S-AC electrode at 0.1C-rate and the points where EIS spectra were recorded. The DOD is calculated from the capacity delivered by the cell. According to the shapes, impedance spectra can be broadly classified into two types. Normally the first type appears with a semicircle in the high frequency region followed by a straight line in the low frequency region. The second type shows two depressed semicircles with a long straight line. The semicircle in the middle frequency region shed information on the formation of polysulfides, Li2S (Li2S2) on the S-AC matrix in the cathode. The values of electrolyte resistance, (Re), charge-transfer resistance (Rct) and film resistance of polysulfides (Rf) obtained from the Nyquist plots for different DOD are displayed in Fig. 9(b).
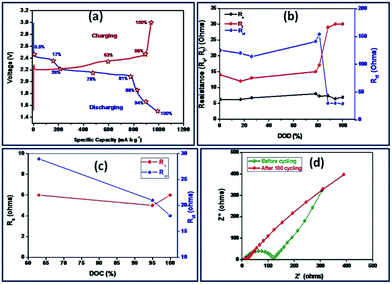 | ||
| Fig. 9 (a) The cycling profile with various DOD and DOC (b) the variation of Re, Rf and Rct for various DOD and (c) DOC (d) the EIS spectra of Li–S cell before and after cycling. | ||
The value of Re which represents the ohmic resistance arises due to the contribution from current collector, cell connections and electrolyte resistance.56 However, the value of Re is influenced by the electrolyte properties such as chemical composition or viscosity.57 In the case of Li–S batteries the properties of electrolytes are significantly affected during cycling due to the dissolution of solid products such as sulfur and polysulfides (Li2Sx with x = 3–8) and are accumulated during cycling which results in increase of electrolyte viscosity and resistance. In the present study, there is small variation in the value of Re during discharge process and was attributed to the dissolution of polysulfides in the electrolyte.58 This implies that the concentration of electrolyte is mainly dependent on the state-of-the charge of sulfur electrode at any time which is unfavourable for the formation of solid electrolyte interface (SEI) layer on the anode. Obviously, this affects the cycling efficiency of Li–S cells. It can be seen from Fig. 9(b) that value of Re was found to be higher for 17% DOD which indicates the presence of maximum amount of polysulfides (concentrations) at the end of first plateau of the discharge. Upon the complete reduction of the polysulfides to Li2S2, the value of Re is reduced and almost reaches its initial value. The value of Rf also varies with the level of DOD and finally reaches a maximum when the DOD was 100%. The formed Li2S2 or Li2S film causes Warburg impedance due to their diffusion within the cathode. The angle of Warburg impedance is close to 45° which implies that the surface of the sulfur cathode at 0.5% and 21% of DOD. At higher DOD and cycles the angle of the Warburg diffusion decreases due to the slow ion diffusion into the sulfur cathode due to increase in concentration of lithium polysulfides at the cathode–electrolyte interface.59
On the other hand, during discharge a dramatic reduction in the value of Rct has been observed. This causes due to the changes in composition and morphology occurring in the cathode. The dissolution and reaction of sulfur, subsequently reduces the sulfur content in the cathode and this makes a porous structure with high surface area. This in turn increases the conductivity. In a similar way, the variations of Re, Rf and Rct for difference depth of charge (DOC) are displayed in Fig. 9(c). Contrary to the first discharge process, maximum concentration of polysulfides is seen when DOC was 63% i.e. during the second plateau region indicating the complete reaction of Li2S to S8.59 The EIS of Li–S cell before and after 100 cycles is shown in Fig. 9(d). After 100 cycles, the resistance of the Li–S cell with S-AC electrode is greatly reduced (approximately 25 ohm). Unlike the usual increase of those with conventional sulfur electrodes, the sulfurized activated carbon electrode exhibits lower resistance value which is attributed to the prevention of aggregation of Li2S on the cathode.60,61 Thus sulfurized activated carbon electrode exhibits a low resistance value and this appreciable performance qualifies it as a promising electrode material for Li–S batteries.
Conclusions
Activated carbon was derived by the pyrolysis of sisal fiber with phosphoric acid as porogen. The elemental sulfur was successfully impregnated in to the AC matrix in order to prevent the pulverization of sulfur particles and to enhance their conductivity. The Li–S cells with S-AC electrode delivered although a discharge capacity of 1050 and 1000 mA h g−1 at 0.05 and 0.1C-rate respectively. However, the cycleability and coulombic efficiency of the Li–S cell were found to be inferior to 1C-rate. This better cycleability at 1C-rate was attributed to the slower diffusion of polysulfides to the anode than the total electrochemical reaction time. The study demonstrates that the S-AC electrode with appreciable electrochemical properties may be suitable for cost-effective lithium–sulfur batteries.Acknowledgements
One of the authors M. Raja gratefully acknowledges AcSIR, CSIR-CECRI, Karaikudi, 630 006.References
- P. G. Bruce, S. A. Freunberger, L. J. Hardwick and J. M. Tarascon, Nat. Mater., 2012, 11, 19–30 CrossRef CAS PubMed.
- S. Evers and L. F. Nazar, Acc. Chem. Res., 2013, 46, 1135–1143 CrossRef CAS PubMed.
- M. Armand and J.-M. Tarascon, Nature, 2008, 451, 652–657 CrossRef CAS PubMed.
- J. Hassoun and B. Scrosati, Angew. Chem., Int. Ed., 2010, 49, 2371–2374 CrossRef CAS PubMed.
- X. Ji, K. T. Lee and L. F. Nazar, Nat. Mater., 2009, 8, 500–506 CrossRef CAS PubMed.
- A. Manthiram, Y. Fu and Y. S. Su, Acc. Chem. Res., 2013, 46, 1125–1134 CrossRef CAS PubMed.
- M. K. Song, E. J. Cairns and Y. Zhang, Nanoscale, 2013, 5, 2186–2204 RSC.
- Y. Yang, G. Y. Zheng and N. Cui, Chem. Soc. Rev., 2013, 42, 3018–3032 RSC.
- Y. X. Yin, S. Xin, Y. G. Guo and L. J. Wan, Angew. Chem., Int. Ed., 2013, 52, 13186–13200 CrossRef CAS PubMed.
- D. Herbert and J. Ulam, US Patent, 3, 043,896, 1962.
- D. Aurbach, E. Pollak, R. Elazari, G. Salitra, C. S. Kelley and J. Affinito, J. Electrochem. Soc., 2009, 156, A694–A702 CrossRef CAS.
- Z. Lin, Z. Liu, W. Fu, N. J. Dudney and C. Liang, Adv. Funct. Mater., 2013, 23, 1064–1069 CrossRef CAS.
- A. Gorkovento, US Patent, No. 6, 210, 831, B1, 2001.
- M. S. Song, S. C. Han, H. S. Kim, J. H. Kim, K. T. Kim, Y. M. Kang, H. J. Ahn, S. X. Dou and J. Y. Lee, J. Electrochem. Soc., 2004, 51, A791–A795 CrossRef.
- N. Tachikawa, Y. Yamauchi, E. Takashima, J. W. Park, K. Dokko and M. Watanabe, Chem. Commun., 2011, 47, 8157–8159 RSC.
- Y. Fu, Y. Su and A. Manthiram, ACS Appl. Mater. Interfaces, 2012, 4, 6046–6052 CAS.
- K. Jin, X. Zhou, L. Zhang, X. Xin, G. Wang and Z. Lin, J. Phys. Chem. C, 2013, 117, 21112–21119 CAS.
- Y. Yang, G. Yu, J. J. Cha, H. Wu, M. Vosguentchian, Y. Yao, Z. Bao and Y. Cui, ACS Nano, 2011, 5, 9187–9193 CrossRef CAS PubMed.
- J. Bruckner, S. Thieme, H. T. Grossmann, S. Dorfler, H. Althues and S. Kaskel, J. Power Sources, 2014, 268, 82–87 CrossRef.
- H. Ye, Y. X. Yin, S. Xin and Y. G. Guo, J. Mater. Chem. A, 2013, 1, 6602–6608 CAS.
- M. Barghamadi, A. S. Best, A. I. Bhatt, A. F. Hollenkamp, M. Musameh, R. J. Rees and T. Ruther, Energy Environ. Sci., 2014, 7, 3902–3920 CAS.
- W. Xing, J. S. Xue and J. R. Dahn, J. Electrochem. Soc., 1996, 143, 3046–3052 CrossRef CAS.
- G. T. K. Fey, D. C. Lee, Y. Y. Lin and T. Prem Kumar, Synth. Met., 2003, 139, 71–80 CrossRef CAS.
- J. C. Arrebola, A. Caballero, L. Hernan and J. Morales, J. Electrochem. Soc., 2001, 157, A791–A797 CrossRef.
- A. Manuel Stephan, T. Prem Kumar, R. Ramesh, S. Thomas, J. K. Jeong and K. S. Nahm, Mater. Sci. Eng., A, 2006, 430, 132–137 CrossRef.
- V. Subramanian, A. Manuel Stephan, S. Thomas, K. S. Nahm and W. Bei, J. Phys. Chem. C, 2007, 111, 7527–7531 CAS.
- N. Moreno, A. Caballero, L. Hernan and J. Morales, Carbon, 2014, 70, 241–248 CrossRef CAS.
- Q. Wang, J. Jin, X. Wu, G. Ma, J. Yang and Z. Wen, Phys. Chem. Chem. Phys., 2014, 16, 21225 RSC.
- G. Ma, Z. Wen, M. N. Wu, C. Shen, Q. Wang, J. Jin and X. Wu, Chem. Commun., 2014, 50, 14209 RSC.
- G. Ma, Z. Wen, Q. Wang, C. Shen, J. Jin and X. Wu, J. Mater. Chem. A, 2014, 2, 19355 CAS.
- Q. Wang, Z. Wen, J. Jin, J. Guo, X. Huang, J. Yanga and C. Chen, Chem. Commun., 2016, 52, 1637 RSC.
- N. Angulakhsmi and A. Manuel Stephan, Electrochim. Acta, 2014, 67, 167–172 CrossRef.
- A. Ahmadpour and D. D. Do, Carbon, 1997, 35, 1723–1732 CrossRef CAS.
- X. Lu, J. Jiang, K. Sun and X. Xie, Bull. Korean Chem. Soc., 2014, 35, 103–110 CrossRef CAS.
- Y. J. Hwang, S. K. Jeong, K. S. Nahm, J. S. Shin and A. Manuel Stephan, J. Phys. Chem. Solids, 2007, 68, 182–188 CrossRef CAS.
- F. Caturla, M. Molina-Sabio and F. Rodriguez- Reinoso, Carbon, 1991, 29, 999–1007 CrossRef CAS.
- M. Molina-Sabio, F. Rodriguez-Reinoso, F. Caturla and M. J. Selles, Carbon, 1995, 33, 1105–1113 CrossRef CAS.
- A. Ahmadpour and D. D. Do, Carbon, 1996, 34, 471–479 CrossRef CAS.
- Z. Hu, M. P. Srinivasan and Y. Ni, Carbon, 2001, 39, 877–886 CrossRef CAS.
- C. Moreno-Castilla, F. Carrasco-Marin, M. V. Lopez-Ramon and M. A. Alvarez-Merino, Carbon, 2001, 39, 1415–1420 CrossRef CAS.
- H. Marsh and D. S. Yan, Carbon, 1984, 22, 603–611 CrossRef CAS.
- Y. Li, J. S. Xue and J. R. Dahn, Carbon, 1996, 34, 193–200 CrossRef.
- Y. S. Su and A. Manthiram, Electrochim. Acta, 2012, 77, 272–278 CrossRef CAS.
- G. Katagiri, H. Ishida and A. Ishitani, Carbon, 1998, 26, 565–571 CrossRef.
- H. Ye, Y. X. Yin, S. Xin and Y. G. Guo, J. Mater. Chem. A, 2013, 1, 6602–6608 CAS.
- G. Xu, B. Ding, L. Shen, P. Nie, J. Han and X. Zhang, J. Mater. Chem. A, 2013, 1, 4490–4496 CAS.
- N. Jayaprakash, J. Shen, S. S. Moganty, A. Corona and L. A. Archer, Angew. Chem., Int. Ed., 2011, 50, 5904–5908 CrossRef CAS PubMed.
- Y. V. Mikhaylik and J. R. Akridge, J. Electrochem. Soc., 2004, 11, A1969–A1976 CrossRef.
- D. Moy, A. Manthiram and S. R. Narayanan, J. Electrochem. Soc., 2015, 162, A1–A7 CrossRef CAS.
- I. Bauer, S. Thieme, J. Brucker, H. Althus and S. Kaskel, J. Power Sources, 2014, 251, 417–422 CrossRef CAS.
- Z. Ma, X. Huang, Q. Jiang, J. Huo and S. Wang, Electrochim. Acta, 2015, 182, 884–890 CrossRef CAS.
- J. Guo, J. Zhang, F. Jiang, S. Zhao, Q. Su and G. Du, Electrochim. Acta, 2015, 176, 853–860 CrossRef CAS.
- H. Yamin and E. Peled, J. Power Sources, 1983, 9, 281–287 CrossRef CAS.
- H. S. Rya, H. J. Ahn, K. W. Kim, T. H. Nam, J. V. Kim and G. B. Cho, J. Power Sources, 2006, 163, 201–206 CrossRef.
- S. S. Zhang and D. T. Tran, Electrochim. Acta, 2013, 114, 296 CrossRef CAS.
- L. Yuan, X. Qui and W. Zhu, J. Power Sources, 2009, 189, 27 Search PubMed.
- V. S. Kolosnitsyn, E. V. Kuzmina, E. V. Karaseva and S. E. Mochalov, Russ. J. Electrochem., 2011, 47, 793–798 CrossRef CAS.
- C. Barchasz, J. C. Lepretre, F. Alloin and S. Patoux, J. Power Sources, 2012, 199, 322–330 CrossRef CAS.
- N. A. Cans, S. Wolf, N. Wanger and K. A. Friedrich, J. Power Sources, 2013, 226, 313–319 CrossRef.
- N. A. Cans, K. Hirose, B. Pascucci, N. Wanger, K. A. Friedrich and R. Hiesgen, Electrochim. Acta, 2013, 97, 42–51 CrossRef.
- Y. J. Choi, Y. D. Chung, C. Y. Baek, K. W. Kim and H. J. Ahn, J. Power Sources, 2008, 184, 548–552 CrossRef CAS.
Footnote |
| † Present address; M G. University, Kottayam 686 560, E-mail: E-mail: anguluxmi@gmail.com, Fax: +91 4565 227779, Phone: +91 4565 241426. |
| This journal is © The Royal Society of Chemistry 2016 |

