 Open Access Article
Creative Commons Attribution 3.0 Unported Licence
Development of discrete interaction models for ultra-fine nanoparticle plasmonics
Lasse K. Sørensen *ab,
Valeriy S. Gerasimov
 cd,
Sergey V. Karpov
 ec and
Hans Ågren
 *f
*f
aDepartment of Physics, Chemistry and Pharmacy, University of Southern Denmark, Odense M DK-5230, Denmark. E-mail: lasse.kragh.soerensen@gmail.com
bUniversity Library, University of Southern Denmark, DK-5230 Odense M, Denmark. E-mail: laks@bib.sdu.dk
cInternational Research Center of Spectroscopy and Quantum Chemistry, Siberian Federal University, Krasnoyarsk, 660041, Russia. E-mail: valkrsk@gmail.com
dInstitute of Computational Modelling, Federal Research Center KSC SB RAS, Krasnoyarsk, 660036, Russia
eL. V. Kirensky Institute of Physics, Federal Research Center KSC SB RAS, Krasnoyarsk, 660036, Russia. E-mail: sergei.v.karpov@gmail.com
fDepartment of Physics and Astronomy, Uppsala University, Box 516, SE-751 20 Uppsala, Sweden. E-mail: hans.agren@physics.uu.se
First published on 27th August 2024
Abstract
Plasmonics serves as a most outstanding feature of nanoparticle technology and is nowadays used in numerous applications within imaging, sensing and energy harvesting, like plasmonically enhanced solar cells, nanoparticle bioimaging, plasmon-controlled fluorescence for molecular tracking in living cells, plasmon-controlled electronic molecular devices and surface enhanced Raman spectroscopy for single molecular detection. Although plasmonics has been utilized since ancient times, the understanding of its basic interactions has not been fully achieved even under the emergence of modern nanoscience. In particular, it has been difficult to address the “ultra-fine” 1–10 nm regime, important for applications especially in bioimaging and biomedical areas, where neither classical nor quantum based theoretical methods apply. Recently, new approaches have been put forward to bridge this size gap based on semi-empirical discrete interaction models where each atom makes a difference. A primary aim of this perspective article is to review some of the most salient features of these models, and in particular focus on a recent extension – the extended discrete interaction model (Ex-DIM), where the geometric and environmental features are extended – and highlight a set of benchmark studies using this model concerning size, shape, material, temperature dependence and other characteristics of ultra-fine plasmonic nanoparticles. We also analyze new possibilities offered by the model for designing ultra-fine plasmonic particles for applications in the areas of bioimaging, biosensing, photothermal therapy, infrared light harvesting and photodetection. We foresee that future modelling activities will be closely connected to collaborative experimental work including synthesis, device fabrication and measurements with feedback and validation in a systematic fashion. With this strategy we can expect that modelling of ultra-fine plasmonics particles can be integrated in the development of novel plasmonic systems with unprecedented performance and applicability.
1 Introduction
Few scientific endeavors have transformed our perception of nature like the development of nanotechnology. Materials structured at the nanoscale possess unique physicochemical attributes and provide unprecedented capabilities that nowadays are exploited in many important societal areas, like healthcare, environmental research and energy conversion. Much of the success of nanotechnology can be traced to two outstanding properties of nanoparticles: quantum confinement, leading to discrete energy states—quantum dots, and the ability to support collective electron oscillations—plasmons. The localization of the strong local fields is associated with collective electron excitations generating surface plasmon resonances (SPRs) that depend on the geometric properties of the particles.1 Plasmonics or plasmonic field enhancement is nowadays used in numerous applications for imaging, sensing and energy harvesting, like plasmonic enhanced solar cells, nanoparticle bioimaging, plasmon-controlled fluorescence for molecular tracking in living cells, plasmon-controlled electronic molecular devices, and surface enhanced Raman spectroscopy for single molecule detection, to mention a few out of many examples. Plasmonic enhancement of the incoming electromagnetic field also offers a great opportunity to substantially increase the efficiency of light conversion nanoparticles. Nanoplasmonics plays a crucial role as a means to produce concentration of optical energy at the nanoscale as localized surface plasmon oscillations and integrated plasmonic functionality provides various mechanisms for manipulating the optical response of engineered materials.2–4The optical properties of colloidal metal nanoparticles have been extensively reviewed and it has been shown that custom tailoring of the optical properties requires relatively inexpensive manipulation of the size, shape and composition of the plasmonic nanoparticles.1,5 Plasmonic materials of metal elements that are nanostructured can generate very strong electric fields in their vicinity through the interaction with electromagnetic radiation, leading to the possibility of detecting signals of single molecules on the nanoparticle surface. There is a need for matching the frequency of the incident light with that of the oscillating surface electrons that in turn, depends on electronic structure, and thereby also on the size, shape, and material or alloy of the nanoparticles. The important aspect here is the combination of a giant enhancement of the electromagnetic fields generated by the nanoparticles and their strong localization. Plasmonic nanoparticles have therefore been frequently employed as modifiers of the optical properties of various optically sensitive objects and materials, such as molecules, their aggregates, and quantum dots.6 At the same time, the properties of localized plasmons critically depends on the shape of the nanoparticles, which makes it possible to tune their resonance system to interact effectively with light or other elementary quantum objects. Such properties have enabled the discovery of a number of new effects associated with plasmonic nanoparticles. For instance, giant local fields near nanoparticles result in an increase in the Raman cross section by 10–14 orders of magnitude, making it possible to observe individual molecules and determine their structure.7,8 Plasmonic nanoparticles provide simultaneous enhancement of both extinction and emission of light and, thus, make up for effective fluorophores and nanoscale light sources, including nanolasers.9–13
The plasmonic optical response thus depends on the material, the shape and the size of the nanoparticle, something that can be used to tune the optical properties of a molecular dye located in the vicinity of the surface of the metallic particle. The locally enhanced fields are the basis for increasing the sensitivity of spectral methods for determining the chemical composition of impurity materials up to the level of single molecules. This fact also lays the basis for a number of applications in bioimaging,14–16 nanosensing,7,8,17,18 nanophotonics19–21 and medicine,22–26 see reviews by Halas27 and Linic et al.28 An additional important characteristic of plasmonic nanoparticles is that the localized surface plasmon wavelength relates also the characteristics of a surrounding medium, a factor that can be used in, e.g., refractive index sensitivity measurements for biosensing.
The applications alluded to above have been greatly boosted by the advances in synthesis procedures, which have made it possible to control the variation of the shape and size of particles and their material content.29 Traditional technologies based on colloidal systems for the chemical synthesis of nanoparticles have been complemented by fabrication by pulsed laser ablation of bulk materials in liquid media, and in gaseous media by the synthesis of self-organizing nanoparticles making it possible to fabricate nanoparticles upon their deposition on a substrate.30–33 Moreover, the fabrication of nanoparticles and synthesis of periodic arrays is now possible by both sputtering onto a substrate from the gas phase through nanomasks and by directional etching of various shapes on the faces of single-crystal samples.34–37 The tuning of plasmonic properties is well-known for larger particles (>20 nm); red shifting deep into the infrared region can easily be manipulated by just adjusting the size; blue shifting is more challenging but can be introduced by alloying,38,39 while field anisotropy and multiple resonances can be introduced by using non-spherical particles with different aspect ratios;40 the simplest case here is nanorods.40 An important concept is that ultra-strong field enhancement in terms of so-called “hot spots” can be triggered by field concentrations at sharp edges.41,42 This is, for example, utilized in scanning tunneling microscopy (STM) where the plasmon fields are mostly located at the very top of the tips creating there an ultra-strong field enhancement.43 All these aspects, which thus are supported by modern controlled synthesis, have opened important perspectives in terms of optical applications in a wide wavelength range.
From a theory or modeling point of view, the great challenge is to find quantitative forms of relationships between structure and plasmonic properties, that is structure–property relationships. This would further promote the possibilities of designing plasmonic nanoparticles for a specified purpose and so boost the utility of nanoparticle plasmonics for applications like detection, sensing and imaging. Modeling, with experimental feedback and validation, has indeed boosted the utility of plasmon techniques; however, it still remains a great challenge to design active plasmonic nanomaterials with arbitrary size, composition and structure. Classical electrodynamics methods serve in general as viable approaches for the prediction of the optical properties, including plasmonic generation.44–46 One can here identify a variety of approaches where perhaps the most commonly used one is the FDTD—the finite difference time domain method—a numerical approach which applies finite element propagation of the time-dependent Maxwell's equations47 and FEM – the finite element method – which has frequently been used for both time- and frequency-domain calculations. The FEM has been implemented in the package COMSOL Multiphysics48 among many commercial solvers. A combination of both the FDTD and the FEM retaining the advantages has been introduced, based on a variation of the so-called Galerkin method.49 These methods have been applied in several contexts, e.g. for designing plasmonic metal shells of quantum dot nanoparticles, to enhance the electromagnetic field either inside to strengthen absorption, or for enhancing the field outside for the purpose of sensing, and of course for surface enhanced Raman scattering. Furthermore, Mie theory44 is frequently used for scattering problems involving nano-particles that are sufficiently large that the concept of a classical dielectric constant remains valid. Other classical electrodynamics methods, such as the discrete dipole approximation or coupled dipole approximation45 and T-matrix method46 have also been widely useful for the calculation of optical properties of nanospheres, nanodiscs, nanorods and other complex geometrical configurations. A popular approach in modeling the dielectric constant of metals for subsequent calculation of the plasmon absorption spectra of nanoparticles is the Drude50 model, applicable for a finite metal spherical cluster much smaller than the wavelength of light.
For very small sizes, towards the ultra-fine region considered in this review, there are abundant contributions to what might be called mesoscopic electrodynamics.51–53 Here, the concept of electron spill-out54 has been frequently applied with extensions to account for size-dependent damping and the self-consistent interplay between screening and spill-out. Furthermore, various modified Drude models for the non-local effects have been put forward; for instance, the nonlocal hydrodynamic Drude model of electron gas.55 Also semiclassical non-local optical response theory has been advocated in the framework of hydrodynamic models, that involve induced charge diffusion kinetics as well as quantum pressure effects.56
The efficiency of the above mentioned methods has been confirmed many times; nevertheless, there are losses in accuracy for small particles with a diameter less than 12 nm and where quantum size effects57 can play a crucial role. While some corrections for these models that take into account the quantum size effects improve the results, these methods still use the dielectric constants of bulk materials, obtained empirically,58 and do not consider the discrete atomic structure of the nanoparticles. It is thus obvious that the dielectric constant will vary with size and become unpredictable for small clusters with broad plasmon resonances or for clusters with more complex shapes. Here the particle size can be smaller than the mean free path of the conduction electrons and the surface to volume ratio can become so large that significant deviations from a non-local, bulk value, description of the dielectric constant can be expected. All these methods rely on the principles of classical electrodynamics and have limited applicability to smaller nanosystems with pronounced quantum size effects.57,58 In the continuous medium models the classical approach to accounting for quantum size corrections to the dielectric constant of spherical metal nanoparticles was formulated in Kreibig's early works by incorporating the size-dependent contribution of the surface scattering effects in the electron damping constant as follows Γ(R) = Γ(bulk) + AvF/R. Here, vF is the Fermi velocity, R is the particle radius, and A is the numerical parameter that is adjusted to take into account the particle surface properties, usually taken equal to 1.
It is clear that there is a breaking point in size where quantum mechanics-based descriptions, accounting also for electronic structure, are necessary and where classical electrodynamics becomes too crude. Full quantum methods, such as time-dependent density functional theory (TDDFT), can be useful for calculating the absorption spectra of small clusters of noble metals with the number of atoms N ≈ 100–200.59,60 Plasmon oscillations have accordingly been addressed for noble-metal clusters61 and charged gold clusters62 using TDDFT. However, due to obvious limitations for first-principles calculations, they cannot be performed for a large number of atoms. Thus, to calculate the optical properties of particles with N > 106 and diameter of particles d < 10 nm it is necessary to use complex methods. If all electronic degrees of freedom are explicitly considered in an ab initio treatment, the scalability is drastically reduced. For the smallest clusters, up to 20–30 atoms, very accurate multi-configurational self-consistent field and coupled cluster methods can provide a reference state for time-dependent perturbation theory, for instance linear response theory in the form of the equation-of-motion coupled cluster (EOM-CC) method63 or the Bethe–Salpeter equation.64 These very accurate methods also make it possible for a hierarchical assessment between models that converge to the final spectrum without referring to experiments. However, the particle sizes are too limited to generate strong plasmon excitations, and definitely too small to explore their size-convergence. TDDFT-based methods65,66 cannot be applied in such a convergent manner since there are no formal relations between the functionals used, but can on the other hand reach considerably larger clusters than the pure ab initio methods. With modern density functional theory methods, using more advanced functionals, it is a realistic proposition to treat clusters of the size that show strong plasmonic excitations. Here, any type of symmetry or periodicity in the cluster reduces the computational effort. As even small metal clusters often show multiple conformations and energy minima with low transition state barriers, an integrated dynamical approach that couples (quantum or classical) dynamics to the quantum spectral calculations becomes almost mandatory. The development of pure quantum methods towards larger systems is rapidly expanding, including linear scaling technology. An example is the work of Nobusada and coworkers who in a series of papers developed and applied a highly efficient first principles TDDFT computational program for electron dynamics solved in real-time and real-space (a coupled Schrödinger–Maxwell approach), thereby reaching optical response of gold clusters with more than 1000 atoms, including plasmonic excitations, though never being close to the accuracy seen for classical methods on large particles. One can here emphasize orbital-free DFT as a powerful DFT variant for plasmonics.67,68 A few direct comparisons between classical atomistic models and TDDFT have been reported, as an example we can here mention the work of Giovanni et al.69 showing a favorable comparison of results from their ωFQ model with TDDFT for large clusters in the 1000 atom range. As an intermediate, the jellium model can be joined with density functional theory where the ionic background charge of the particles is replaced by a uniform charge density.70 When implemented with the so-called time-dependent local density approximation form of DFT, it can treat large clusters. In this case a meaningful comparison with pure classical results can be obtained. The jellium model thus introduces significant simplifications for quantum mechanical calculations of plasmonics. It is here notable that DFT and TDDFT have been implemented together with plasmonic models (n.b. discrete interaction models) in the form of QM/MM, thus as DFT/DIM or TDDFT/DIM. Here, TDDFT is applied to simulate properties in the DIM plasmonic fields, like surface-enhanced Raman optical activity,71 plasmonic circular dichroism,72 surface-enhanced hyper-Raman scattering73 and two-photon absorption.74
It thus still remains a great challenge to design active plasmonic nanoparticles with arbitrary size, composition and structure in the “ultra-fine” region with the dimensions of a few nanometers. This situation has been unfortunate considering the great number of applications such particles bring about, for instance in the bioimaging and biomedical areas where ultra-fine plasmonic particles provide a number of distinct advantages like size compatibility of small clefts, pockets and other compartments of the target biostructures. They can more easily pass through membrane channels and can, moreover, be effectively cleaned in the kidneys and rinsed from the body. This alleviates, although not removes, the nanotoxicity problem of using nanoparticles for in vivo studies and is especially important when using them as a part of complex therapy of oncological diseases and during early diagnosis of disease.
In this perspective article, we will review recent work addressing the lower nanoscale region for plasmonic nanoparticles, where classical bulk models have limited applicability or where the particles are yet too large for quantum mechanics, so that the gap between classical and quantum treatments for plasmonic particles potentially can be closed. This is accomplished by implementing atomistic models for plasmonic excitation and optical properties of metallic nanoclusters, which are parameterized using quantum chemical calculation results as well as empirical results for larger clusters. The models are based on a general atomistic complex polarizability parameterization of the metal atoms, where the atomistic parameters are obtained from a mix of experimental data and classical models. The atomistic parameters can be made local environment-dependent by introducing explicit atomistic parameter dependence on atom coordination number, and by introducing an explicit induced dipole-induced dipole interaction tensor on atom type. In the extended discrete interaction model (Ex-DIM)75 the total optical properties, the complex polarizability and the plasmonic excitation of a cluster are atomically dependent, and therefore dependent on arbitrary composition and geometric characteristics of the cluster. Calculations for the full polarizability and optical spectrum, including plasmonic resonances, are made with and without the topology awareness of the parameters and compared, for small clusters, with ab initio data. The role of size, shape, aspect ratios, and other geometric factors, down to the atomic level, is explored in order to design plasmonic particles with particular strength and field distribution. It follows that the model makes it possible to do such calculations also for any alloy composition of the constituting metal elements as also shown in this review. The model is at present practically implementable for clusters also above 10 nanometers, thus covering a significant part of the gap between the scales where pure quantum calculations are possible and where pure classical models based on the bulk dielectric constant apply. Before outlining the discrete interaction models, it is here relevant to mention the existence of another atomistic model based on a different physical background, namely the frequency-dependent Fluctuating Charges model (ωFQ) first proposed by Giovannini et al.,76 which is based on the Drude model of conduction and describes the plasmonic response in terms of classical charges only.
In the following section we review some basic elements of discrete interaction models addressing merits and limitations. We then present the Ex-DIM and give a survey of its applications. Finally, we highlight some of the important results and make an outlook for future research possibilities using the proposed approach.
2 Discrete interaction models
For intermediate-sized clusters an atomistic approach, where the polarizability can be obtained from the atoms of the particle, could fill an important gap in the description of nanoparticle plasmons between the quantum and classical extremes. Here, the classical dipole approximation can be applicable, since it can be used to construct the total polarizability (or the dielectric constant) from a set of interacting, complex polarizable, atomic dipoles.69,77–83 However, the polarizability is represented by fixed constants for each type of chemical element, obtained either from bulk measurements or electronic structure calculations. This neglects, e.g., any charge rearrangement that takes place in the real cluster, on formation or by a molecular sensitization. An obvious complication of a metallic particle is the almost free motion of charges within the metallic cluster, and that the interaction with the surroundings should be regulated by the “atomic capacitance” rather than by fixed charges. An elaborate model to deal with this, but yet very simple compared to quantum chemical calculations, is the so-called interaction model.84 In the simplest form it is a set of atomic polarizabilities that interact in accordance with classical electrostatics without external electric field. This model has been significantly expanded by inclusion of a damping term of the internal electric field85,86 extended also to the frequency dependence of the dipole polarizability87,88 and with a capacitance–polarizability interaction model (CPIM).89 One of the significant drawbacks of the interaction model is, however, that the atoms on the surface and inside of the cluster do not differ very much. A specific coordination number will correspond to each atom in the cluster.90,91 The coordination number will have little effect on the distribution of the charge density around every atom, depending on it's geometric position in the cluster. The charge density will be slightly compressed for atoms inside of the cluster, and slightly stretched for atoms on the surface. Here atomic parameters can be optimized for small clusters and interpolated for bigger systems.The aim of the discrete interaction model (DIM) has been to describe the polarizability and optical properties of small to large molecules, metallic nanoparticles and carbon nano-structures by representing the nanoparticle as a collection of interacting atomistic charges and dipoles. We note that the DIM can be generalized to include higher order moments such as quadrupole moments where also higher order hyperpolarizabilities are included. Including higher order terms, however, increases both the complexity of fitting and computational demand of the DIM significantly.92,93 We therefore here only review the DIM's using charges and dipoles.
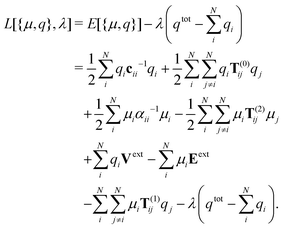
The starting points of most DIM's used69,75,77–83,87,89 are the energy expression Lagrangian for interacting fluctuating charges and dipoles in an external electric field subject to a charge equilibration constraint
 | (1) |
The first line in eqn (1) describes the self-interaction energy of fluctuating charges and the interaction energy between fluctuating charges, respectively. The second line contains the self-interaction energy of fluctuating dipoles and the interaction energy between fluctuating dipoles in that order. In the third line the interaction energy between fluctuating charges and the external potential along with the interaction energy between fluctuating dipoles and the external field are listed. The last line describes the interaction energy between fluctuating charges and dipoles and in the last term the charge equilibration condition is expressed via the Lagrangian multiplier λ.
The exact expressions for the electrostatic interaction tensors T(0)ij, T(1)ij, and T(2)ij depend on how the charges and dipoles are represented as discussed in Section 2.3. The external scalar potential Vext can be determined from the external electric field Eext and the choice of gauge. The self-interaction tensors cii and αii are model specific and the expression for αii is discussed in greater detail in Section 2.2 and for the Ex-DIM in Section 3. The effect of the different terms on the spectra from particles with different geometries will be discussed in Section 3.4.2.
The minimization of the energy E[{μ,q}] in which the fluctuating charges and dipoles are determined can be cast into a problem of solving a set of linear equations89
 | (2) |
| Aij = δij αij−1 − (1 − δij)T(2)ij, |
| Cij = δijcij−1 + (1 − δij)T(0)ij, |
| Mij = (1 − δij)T(1)ij, | (3) |
The DIMs are flexible models so DIMs which only involve charges77
| −Cq = Vext | (4) |
| Aμ = Eext | (5) |
The polarizability of the nanoparticle can be computed from the derivative of E[{μ,q}] with respect to an external field Eext.89,95 The polarizability of a nanoparticle is defined as
 | (6) |
The above described scheme for determination of the polarizability is generic and has been employed in the original, coordination-dependent and extended discrete interaction models.1,69,74,75,77–83,85–88,94–98 Model differences originate from the functional form employed to describe the fluctuating charges and dipoles and from the parameterization of the self-interaction and electrostatic interaction tensors.
2.1 Scaling considerations for linear equations
Eqn (2), (4) and (5) are all examples of linear systems| Ax = b | (7) |
For larger systems, iterative approaches scaling as m2 are needed. Here, the conjugate gradient method, generalized minimal residual iteration, and minimum residual iteration along with other methods can be used. We here found that the conjugate gradient method from Scipy was very slow to converge, if at all, but found the LGMRES algorithm,99 which is a modified version of the generalized minimal residual iteration from Scipy, both fast and robust in converging for the Ex-DIM. The fast Fourier transform (FFT) methods used in the discrete dipole approximation are in general not applicable since the geometries used in the Ex-DIM are often taken from molecular dynamics simulations where there are no perfect lattices.45 Combined with the distinction between surface and bulk atoms, which will be discussed in Section 2.3.2, where the individual dipoles will differ slightly limits methods based on symmetry of the lattice.
For very large systems the relay matrix in eqn (2) will either have to be constructed on the fly or created using sparse matrix algebra. In the sparse matrix approach the screening of the relay matrix will typically be on distance or interaction strength, where the latter is used in the Ex-DIM.98 The best effect of the sparse matrix algebra is seen in 1- and 2D systems like rods and thin films whereas in 3D systems like spheres the savings from sparse matrix screening are less effective.
The system sizes that can be reached by the DIMs are also very dependent on the order of the moments included. For a charges only DIM, as seen in eqn (4), the dimension of m is N, where N is the number of charges. In the dipole only moments DIM, see eqn (5), m = 3N while in the charge and dipole DIM, see eqn (2), m = N + 3N. Including quadrupole moments adds an additional 9N to m. From these scaling considerations of the Relay matrix it is seen that the maximum number of atoms in a given system drops by about a magnitude every time a higher order moment is included. Very large systems, where computational memory considerations have to be taken into account, for the charge, dipole and quadrupole moments models are approximately +500.000, +50.000 and +5000 atoms, respectively, depending on the computational hardware available.
2.2 Representation of the polarizability
The representation of the polarizability usually follows one of two methods. Either the frequency dependent polarizability is computed from experimental values of the dielectric constant or from the simulation of the polarizability from a Lorentz oscillator model.Lorenz and Lorentz showed that the refractive index of a material can be directly related to the polarizability of the individual atoms through a simple relation
 | (8) |
 | (9) |
The dielectric function from the Lorentz oscillator model can describe a resonance where the complex dielectric function is given by
 | (10) |
 and ωp2 is the plasma frequency, ω0 is the resonance frequency and Γ is the relaxation constant. N is the density of charges, e is the elementary charge and m is the effective mass of a charge. The polarizability of a single Lorentz oscillator is given by
 | (11) |
2.3 Representation of charges and dipoles
We will here briefly review the two most common ways to mathematically represent the fluctuating charges and dipoles. The charges and dipoles are meant to represent the individual constituents of the physical system irrespective of the composition of the constituents. This means that these charges and dipoles should make it possible to describe an aggregate of unit cells, atoms and all the way down to individual atoms.The interaction tensor of order n is in general defined as the n-th derivative of the charge interaction or some other charge distribution
| Tn = ∇rTn−1. | (12) |
This definition of the n'th order interaction means that the dipoles and higher orders will be described as exactly overlapping charge distributions of opposite charge that can be polarized. This physical description of the charge distribution of the individual constituents from eqn (12) therefore comes closer to aggregates than atoms. For aggregates, the physical charge distribution is more evenly distributed over the space of the individual constituents than for atoms since atoms are made of two spatially distinct charge distributions, one from the very localized charge distribution of the nuclei and one for the large and more diffuse charge distribution of the electrons, and these atomic charge distributions even out over larger aggregates.
Since it is not evident which well-behaved charge distribution shape ρ(r) represents molecular systems best, Thole tried several different charge distributions of which two survived:86
 | (13) |
 | (14) |
 | (15) |
The chemical environment radius acn is defined as
 | (16) |
In the Ex-DIM, the Grimme59 scheme is used where the atomic coordination number ficn is computed as
 | (17) |
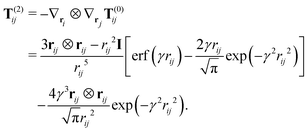
The electrostatic interaction tensors, T(0)ij, T(1)ij, and T(2)ij from two Gaussian charge distributions, G(r;fcn,C) and  centred on the i-th and j-th atoms with position vectors C and D, following A. Mayer,107 can be computed as
 | (18) |
From the derivate of T(0)ij, the higher order electrostatic interaction tensors, T(1)ij, and T(2)ij, can be derived
 | (19) |
 | (20) |
In this way, the electrostatic interaction between different Gaussian charge distributions, dependent on the topology, can be calculated. Regardless of whether the charges and dipoles are derived from different charge distributions or not, eqn (18)–(20) can be used directly. Eqn (18)–(20) are also directly applicable for alloys and molecules once the charge distributions are known.
The tensors T(0)ij, T(1)ij, and T(2)ij describe every interaction between two sites i and j in the DIM as defined in eqn (2) and explicitly seen in the matrix definition in eqn (3). The interaction between sites in the DIMs is therefore determined by the choice of charge distribution and here in particular the radii of the charge distributions. While the radii only have a minor influence on the position of the plasmon resonance for spherical particles, for the resonance position of non-spherical particles like rods, even a small change in the radii of the charge distribution can give a very large shift in the resonance. Choosing a good representation for the charge distribution and fit for the radii in the DIM is crucial for the description of geometric distortions from spherical particles.
2.4 Relations to the discrete dipole approximation
The discrete-dipole approximation (DDA) was developed by DeVoe as a flexible and powerful technique for computing scattering and absorption by targets of arbitrary geometry and as a method of discretization of Maxwell's equations for a particle in a field.110,111 Purcell and Pennypacker later included retardation effects into the DDA, which means that the aggregates no longer have to be small in comparison to the wavelength of the incoming field.112 The DDA algorithm assumes that any arbitrary object is replaced by a set of finite cubic elements small enough so that only dipole–dipole interactions induced by the incident field in neighboring elements occur. This helps to reduce Maxwell's equations to an algebraic problem involving many coupled dipoles. The appropriate choice of the polarizability of each element leads to an accurate simulation of electric fields within the number of dipoles used to approximate the object. The main advantage of DDA is the flexibility it offers in describing arbitrarily shaped objects.113The DDA is an approximation of a particle by a finite array of polarizable dipole moments. The dipole moments respond to the local electric field and interact with one another via their electric fields and numerically the DDA is represented by eqn (5). For a particle of arbitrary geometry, the DDA requires choices for the locations and the polarizability of the point dipoles in order to represent the particle. Each dipole in the DDA represents the local polarizability of a particular subvolume of a particle. The spatial resolution of the DDA depends on the volume of each subvolume for every dipole. Since there are no restrictions on the volume of the individual dipoles, weaker closer spaced dipoles can be used to describe a complex surface topology and larger dipole volumes for the body of the particle. While the spatial resolution of the DDA in this way can be improved, this method quickly becomes prohibitively expensive.45 Secondly using the experimental values of the frequency dependent dielectric constant also limits the subvolume size to a volume where the bulk dielectric constant makes physical sense.
The DIM is a DDA method where each subvolume is an atomic volume and the dipoles are placed on the nuclei of each atom. The DIM is, in some sense, the minimum subvolume for a material since the spatial resolution of the DIM is atomic. We here notice that the DDA of course can be extended to include both charges and higher order moments seen in the DIM.92 The strengths and weaknesses of the DDA and the DIM are therefore also similar. The cd-DIM is an example of where the DDA method is applied down to the atomistic level.95
3 Review of the Ex-DIM model
Since all interactions between different sites in the DIMs are determined by the choices of charge distributions, the differences in DIMs are primarily in the self-interaction part described in the diagonal. From the Lagrangian in eqn (1), the self-interaction of the charge and dipole are described by cii and αii. The self-interaction is, however, essential in describing the position, width and magnitude of a resonance, and also size dependence, medium and temperature shift in position and magnitude of the resonance. The Ex-DIM is a dipole only model because the charges are not parameterized, which means that the diagonal only consists of αii. In the parameterization of cii the same effects as in αii would also have to be considered and effects should emerge in a similar form.The different effects such as temperature, size and media all require modification of the polarizability αii. Each effect and term in αii
 | (21) |
3.1 Multiplicative environment factors
Surface topological effects related to the coordination number not only effect the radii of the charge distribution as seen in Section 2.3.2, but also the polarizability of the individual atoms. The scaling of the individual atomic polarizability as (ai(fcn)/rbulk)3 is inspired by studies of small gold clusters where the atomic polarizability is shown to be very dependent on the topology.114,115 In (ai(fcn)/rbulk)3, the nominator ai(fcn) is calculated from eqn (16).The (ai(fcn)/rbulk)3 term ensures that surface atoms, depending on the coordination number, will have a larger intrinsic polarizability than bulk atoms and hence increase the total polarizability for clusters with more surface atoms. (ai(fcn)/rbulk)3 primarily shifts the total polarizability and gives only a minor shift in resonance position, which is dominated by the charge distribution as discussed in Section 2.3.2.
n2 is the square of the refractive index n of the media for the particles and is similar to the expression from DDA.45,116 The media is known to give a significant polarizability shift along with some shift in the position of the plasmon resonance. The major shift in the value of polarizability from the media, however, stems from the change in the relaxation constant as described in Section 3.2.2. n2 as a multiplicative factor here mainly ensures the shift in the resonance frequency.
3.2 Lorentzian
The Lorentzian L(ω,P,T,n) in eqn (21) regulates the size-, geometric-, temperature- and media dependence. The geometric part of the size dependence comes in via the size dependent resonance frequencies of three size-dependent Lorentzian oscillators| L(ω,P,T,n) = N(Lx(ω,Px,T,n) + Ly(ω,Py,T,n) + Lz(ω,Pz,T,n)), | (22) |
 | (23) |
 | (24) |
The plasmon length is defined as the length over which the oscillations take place in a given direction and the aim of using the plasmon length is to give a differentiated directional size correction, which reflects the geometry of the particle. In practice, the plasmon length is a measure of the maximum distance between any two atoms plus the radius of those atoms in each of the x, y, and z directions. We notice that the plasmon length is not invariant to rotations of the particle, since the Px, Py and Pz will change slightly with such rotations. The plasmon length is a pragmatic approach to describe size correction for all particle shapes. This means that regular shaped particles such as rods, films and other shapes where there are clear choices of direction should be rotated to align with the coordinate system, while for irregular shapes the size correction is more unclear. It should, however, be noted that the effect of the size correction will rapidly decrease with size, and the charge distribution, described in Section 2.3.2, is significantly more important than the size correction for irregular shapes or shapes with uneven lengths.
 | (25) |
| Γi(Pi,T,n) = [Γ(Pi) + Γe-ph,d(T)]/n2 as | (26) |
| Γ(Pi) = Ks/Pi | (27) |
 | (28) |
The specific resistance of gold exhibits a sharp jump in the relaxation constant when transitioning from the solid to the liquid phase:126
| Γ(l)e-ph,d(Tm) = 2.4·Γ(s)e-ph,d(Tm), | (29) |
If the melting temperature cannot be directly derived from the molecular dynamics simulations, the melting temperature can be calculated from the plasmon length using the generalised Gibbs–Thomson equation:127,128
 | (30) |
 is the bulk phase change temperature, Δc is the difference in the specific heat between the liquid and solid phase, Δc = cl – cs, where the subscripts indicate the phase, σ is the surface tension, ρs is the density of the metal, and κ is the mean curvature radius of the surface. The generalised Gibbs–Thomson equation from eqn (30) accurately describes the melting temperature of spherical nanoparticles in the 1–12 nm range. Eqn (30) is in the Ex-DIM primarily used to determine the phase of the particle, which accordingly adjusts the relaxation constant in eqn (29).
3.3 Interband transition
Since the plasmon resonance and the interband transitions in many materials partially overlap, it is often not sufficient to model the polarizability of the plasmon resonance only due to the interference of the two close resonances. In the Ex-DIM the interband transition αib for gold is modelled by two size- and media-dependent Lorentzians extrapolated from the fit to the experimentally measured interband transitions129
 | (31) |
3.4 Parameterization of Ex-DIM
The parameterization of any method under continuous development often needs to be parameterized anew every time a new effect is introduced and the Ex-DIM is here certainly no exception. One of the fundamental problems with the DIM is the lack of available data, both experimental and calculated, along with which input parameters should be fitted and which can reliably be taken from table lookup of experimental data.We will here discuss the different parameters in the Ex-DIM, finding data for the fitting of the parameters along with the actual fitting procedure.
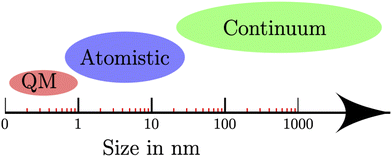 | ||
| Fig. 1 Size range of applicability of quantum mechanical (QM) and atomistic models, and classical continuum methods. | ||
The only QM method, which can reach the particle size needed for plasmonics, in reasonable time is DFT. The accuracy of DFT is, however, not comparable with the classical methods and is therefore not suited for data extraction for small particles with a diameter between one and two nanometers.75 Secondly, extrapolating from particles with 50 ≈ 150 atoms also has the added difficulty from magic numbering due to the shell structure effect seen for small particles.
Classical methods have proven to be very accurate in predicting the position of the resonance frequency for large particles and size-correction from fitting to experimental data seems to be better than a purely theoretical approach.130 The result from the classical methods also depends on the choice of experimental data used as can be seen for the extinction cross sections in Fig. 2. In Fig. 2, all parameters such as the plasma frequency and relaxation constant are kept the same for the classical Mie method and only the experimental data of the dielectric constant is varied. This variation in the experimental data results in a significant shift in the absolute value of the extinction cross section where the experimental data from Babar et al.131 is 1.6 times larger than the extinction cross section from the experimental data from Hagemann et al.132 with the data from McPeak et al.133 and Johnson and Christy134 nested in between the Babar and Hagemann data. Secondly the position of the plasmon resonance also shifts 7 cm−1 depending on the choice of experimental data.
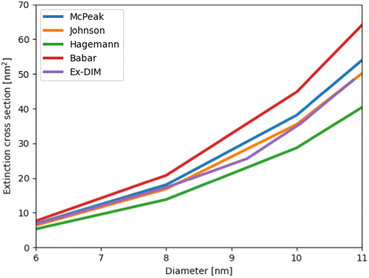 | ||
| Fig. 2 The extinction cross section as a function of size for the Ex-DIM and Mie theory with different experimental inputs for the dielectric constant. The size correction in the Mie theory is taken from Karimi et al.130 The different experimental input data are from bulk or thick films from McPeak et al.,133 Johnson and Christy,134 Hagemann et al.132 and Babar et al.131 | ||
Experimental data where a single effect is systematically examined for particles in the 1–15 nm size range are scarce. The effect of plasmon resonance as a function of particle size has been examined for some plasmonic materials like gold and silver, but there is a lack of systematic studies for other effects.120–123,135
ratom and rbulk from the radius of charge distribution and polarizability in eqn (16) and (21), respectively, are often set to the experimental radii, which can be looked up. However, as discussed in Section 2.3.2 the charge distribution from the overlapping Gaussian model differs significantly from the atomic charge distribution and using ratom and rbulk directly from experiments without any scaling may not be wise. A scaling of ratom and rbulk will not change the polarizability in eqn (21) and only change the off-diagonal elements describing the interaction between the charge distributions. Determining a scaling factor for ratom and rbulk requires data from geometries different than spherical since the scaling factor for ratom and rbulk is responsible for the large shift in the longitudinal and transverse resonance frequency and extinction cross section observed in rods and thin films.
The frequency independent polarizability αii,s,kl in eqn (21) only gives a minor shift in resonance frequency but is instrumental in setting the absolute value of the extinction cross section. Getting the absolute value of the extinction cross section right is crucial in getting the absolute value of the local electric field right and hence the effect on any surroundings.
ωa and A from eqn (25) regulate the position of the resonance frequency as a function of size and can easily be fitted for materials where there are systematic data of the size dependence.
Ks and K0 are the size- and temperature-dependent relaxation constants from eqn (27) and (28) where knowledge of the absolute value of the extinction cross section as a function of size and temperature is needed.
For the interband transition kj, the fitted multiplication factor for the j'th Lorentzian and R the radius needs to be determined. In the size-correction of the interband, we assume that the particle is spherical and R is the input parameter for the fit. The media correction of Γj(R,n) from eqn (31) is provided in Section 3.3.
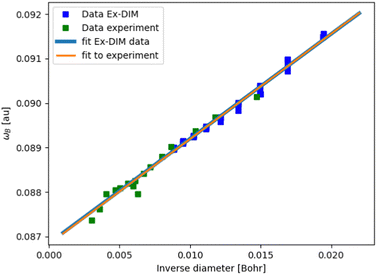 | ||
| Fig. 3 Fitting the size correction in the Ex-DIM by comparison with experimental data.120–122 | ||
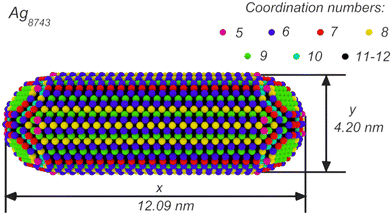 | ||
| Fig. 4 Coordination numbers, longitudinal and transverse plasmon length for an Ag nanorod containing 8743 atoms. From ref. 75. | ||
The absolute value of the extinction cross section is fitted to the absolute values from Mie theory using the Johnson and Christy134 experimental data and the Karimi et al.130 size correction for the dielectric constant, as shown in Fig. 20. Using Johnson and Christy data for the fit gives an absolute value of the extinction cross section, which lies in the middle of all the experimental values as seen in Fig. 2. The atomic polarizability and the size correction to the relaxation constant Ks can in this way be determined. K0, the temperature-dependent relaxation constant, is determined indirectly since a too large or small K0 will increase the size sensitivity of Ks.
All fits in Fig. 3 and 20 can be performed with very different charge distributions since all particles used in those fits are spherical. In order to fit the charge distribution the resonance shifts in FDTD and Ex-DIM have been compared for thin films since the longitudinal plasmon is here significantly red shifted and this red shift is primarily caused by the charge distribution.
4 Survey of representative Ex-DIM model studies
4.1 Test of the model – silver nanoparticles
As a first set of applications beyond spheres, cubes and rods were also considered in ref. 75. Fig. 5 and 6 of that paper indicate substantial red shifts for nanorods along the long axis, in fact much stronger (with respect to aspect ratio defined as the ratio between the plasmon length in the longitudinal and transverse directions) than the red shifts for spherical particles with respect to the radius. This significant red shifting property is the basis for the common utility of nanorods in imaging and sensing, as it easily can be manipulated by fabrication. Furthermore, the plasmon magnitude of the shifted peak is also greatly enhanced with increasing aspect ratio. In addition, the nanorods show plasmonic bands along the short transverse axis, which typically are only slightly blue shifted in comparison to a spherical cluster with the same plasmon length. Notably, for the smallest of the two rods shown, Fig. 5, the transverse plasmon is split into two peaks, something that yet has to be experimentally confirmed for such small rods.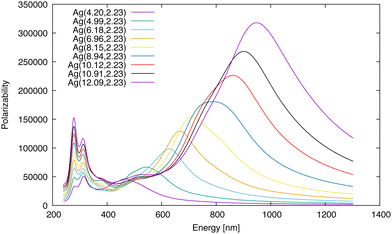 | ||
| Fig. 5 Polarizability versus incident energy for Ag(x,2.23) nanorods with different longitudinal plasmon lengths. From ref. 75. | ||
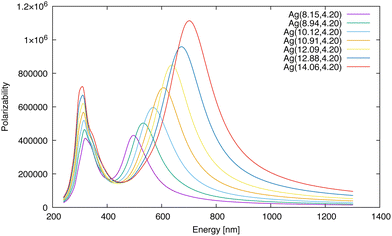 | ||
| Fig. 6 Polarizability versus incident energy for Ag(x,4.20) nanorods with different longitudinal plasmon lengths. From ref. 75. | ||
In ref. 75, the interplay between the aspect ratio and diameter was further studied with respect to the plasmon resonance. A series of nanorods where each end is formed by a half sphere connected by a cylinder, as shown in Fig. 4, were studied. In this rod figure one discerns a great variation of coordination numbers – the top layer of atoms with coordination number below 11–12 and edge atoms with the lowest coordination numbers 5–6 on the edges. As the surface atom polarizability is directly affected by the changes introduced by the coordination, the plasmon generation is delicately dependent on the coordination numbers as also recognized by the parameterization in the Ex-DIM (as well as in the cd-DIM82) models.
The red shift of the transverse plasmon is directly proportional to the aspect ratio and the difference in the longitudinal plasmon resonance changes with the diameter of the nanorod. The dependence on the diameter of the nanorods is observed for gold nanorods of bigger dimensions.136–138 Jakab et al.139 showed (experimentally) red shifts that are directly proportional to the aspect ratio and with a slight increase in slope compared to the Ex-DIM results.
The relative polarizability and peak width between longitudinal and transverse plasmons increase significantly with increasing aspect ratio, actually the polarizability per atom increases linearly with the aspect ratio, while the dependence on the diameter of the nanorod is quite small, see ref. 75. Thus both the maximum and the absorbance of the longitudinal SPR can in this way be controlled by the aspect ratio and the diameter. It is notable that the refractive index of the surrounding medium plays an important role, see further below.
Summarizing – the Ex-DIM results for small nanorods agree with observation for larger particles in that the longitudinal resonance significantly red shifts and the transverse resonance slightly blue shifts with aspect ratio. The red shift as well as the atom polarizability correlates linearly with the aspect ratio thereby making both the peak position and magnitude controllable for these particles. For the transverse direction, the slope in blue shift shows a slight dependence on their plasmon length, something also seen for gold nanorods of larger dimensions.136,137 Here, the refractive index of the surroundings seems only to give a constant shift for the plasmon resonance.139
Also cubes were addressed in ref. 75 as a test bed for further exploration of the Ex-DIM model. At the time of the publication of the model, Ringe et al.117 and González et al.140 had shown that gold cubes red shift differently than spherical clusters with the same plasmon length—with larger red shifts up to 0.2 eV. Silver particles shift even more than gold with respect to size, see also ref. 141 and 142. The Ex-DIM results presented in Fig. 7 predict that there is also a larger size dependence for silver particles as their cubes are red shifted around 0.6 eV in comparison to the spheres; see also results for larger particles predicted by González et al.140 The size-dependences of the cubes and spheres thus follow similar trends although the geometric dependence for Ag is larger than for Au.
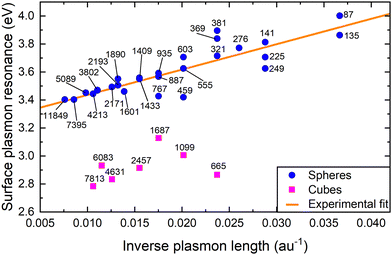 | ||
| Fig. 7 SPR for sphere and cubes with different plasmon lengths. From ref. 75. | ||
4.2 Hollow nanoparticles
In ref. 143 hollow nano-shells were explored by the Ex-DIM model in order to test to what extent the role of cavity versus volume size of spherical particles can be used as an additional design parameter for plasmonics generation, along with the particle size dependence. Hollow spherical nano-shells, as depicted in Fig. 8 made of gold, were used for that purpose. As shown in ref. 144 and 145 the surface charges on the nano-shells constitute a hybridization of plasmon modes from the cavity and the shell that can, in a semiclassical approach, be described as two coupled harmonic oscillators, as depicted in Fig. 9. It has been shown146,147 that for larger nano-shells, this approach gives both a good intuitive picture and good numerical results for the surface plasmon resonance frequencies for both small and large nano-shells. In ref. 143, it was studied if the basic picture also holds going to ultra-fine dimensions.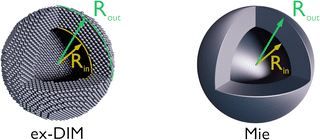 | ||
| Fig. 8 Representations of Rout and Rin for Ex-DIM and Mie models of nano-shells. The Ex-DIM radius of the atoms corresponds to the effective radius. From ref. 143. | ||
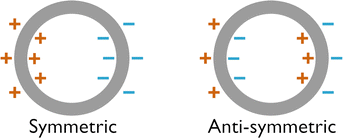 | ||
| Fig. 9 Symmetrically (ω−) and anti-symmetrically (ω+) coupled nano-shell plasmon modes. From ref. 143. | ||
In the semi-classical approach with two coupled oscillators, the two SPRs are associated with red and blue shifts, which depend only on the relative radius between the hole and the particle. Ex-DIM calculations largely confirm this contention, see Fig. 10a. Here, the antisymmetric mode weakly blue shifts with respect to the hole and particle radii, whereas the symmetric mode red shifts more strongly. Here it seems (Fig. 10b) that using Mie theory, the forming of the resonances does not entirely follow the predicted plasmon modes from the semi-classical approximation, as well as showing a too strong (Rin/Rout) dependence. Fig. 11 shows the normalized imaginary polarizability calculated for nano-shells with fixed outer radius by the Ex-DIM model and by Mie theory which indicates that the two theories possess similar red and blue shift trends for increasing hole size, although the numerical results are somewhat different. For a fixed inner shell radius the blue and red shifts for different (Rin/Rout) are not as distinct as for fixed outer radii. A difference between spectra for a fixed Rout and Rin is that for the fixed outer radius, the plasma frequency is the same for all clusters, while for the fixed inner radius, the plasma frequency changes with Rin/Rout where the highest ratio has the largest plasma frequency. The antisymmetric mode also becomes increasingly strong for larger ratios Rin/Rout, although still significantly weaker than the symmetric mode.
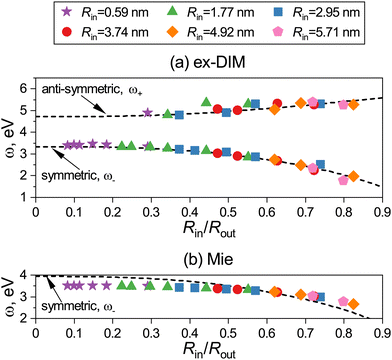 | ||
| Fig. 10 The spectral positions of SPRs for the symmetric and anti-symmetric modes versus Rin/Rout calculated via (a) Ex-DIM and (b) Mie theory for nano-shells with different Rin. The dashed line shows the spectral position of symmetric, ω−, and anti-symmetric, ω+, modes from eqn (1) in ref. 143 with (a) ωB = 5.78 eV and (b) 6.82 eV used for the fit. From ref. 143. | ||
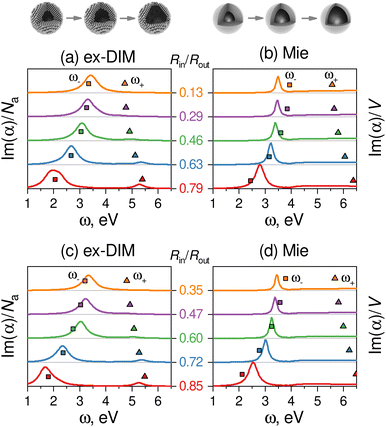 | ||
| Fig. 11 Normalized imaginary polarizability from the Ex-DIM model (left) and Mie theory (right) calculations for nano-shells with fixed outer radius Rout: 5.97 nm (top) and 7.94 nm (bottom). Squares and triangles give the positions of the symmetric (ω−) and anti-symmetric (ω+) modes from eqn (1) in ref. 143 with ωB = 5.78 eV (Ex-DIM) and ωB = 6.82 eV (Mie). From ref. 143. | ||
In summary, the Ex-DIM study presented in ref. 143 could show that the prediction for larger nano-shells by the simple semi-classical harmonic oscillator model for symmetric and anti-symmetric plasmon modes holds well also for small nano-shells in the 2–13 nm range, having similar size dependence as seen for filled nanoparticles. For the extended discrete interaction model (Ex-DIM), the plasmon modes follow the same functional form predicted by the semi-classical model though with a different size-dependent plasma frequency. For the symmetric mode a significant red shift shows up with increasing ratio between particle and hole ending in the regular surface plasmon resonance of a filled cluster, while the anti-symmetric mode disappears towards a filled cluster as expected.
4.3 Alloys and core shells
In addition to designing plasmonic nanoparticles by their size, shape and material, one can also consider compositions including more than one plasmonic material. Such alloy nanoparticles can be interesting for bioimaging, sensors and devices as the resonance position of the plasmon then can be adjusted over a large wavelength range just by varying the composition of the constituent metals. This gives flexibility that can serve the purpose for a particular application. Developments in synthesis and characterization148,149 have made studies of such alloyed or bimetallic nanoparticles possible through fine-tuned design. Bimetallic particles formed by noble metal elements, like platinum, gold, silver and copper, stand out as the most promising candidates for such studies.The question is, e.g. for a binary system, if the property looked for, e.g. the extinction coefficient of the plasmonic resonance, relates in a linear fashion or not with respect to percentage of the ingredients. Here the validity of the so-called Vegard law150,151 has been examined for larger particles to quite some extent, which indeed overall have supported such a linear relation between resonance frequency and composition. Moreover, core shelling the two materials opens new flexibilities for design – which material is chosen to be the core and shell, and which thicknesses of the core and shell are preferable. Moreover, forming core–shell structures turns out to be an effective way to get a significant blue-shift in the surface plasmon resonance frequency.
In order to shed light on these questions for nanoparticles in the ultra-fine range, a series of Ex-DIM calculations were carried out on gold–silver nanoparticle alloys in the small (1–15 nm) nanoscale regime in ref. 149. It could there be demonstrated that the surface plasmon resonances of these alloys and core–shell particles, irrespective of geometry, indeed follow Vegards law of the nanoparticle quite well, see Fig. 12a and b. However, it was also shown that the dependence of the polarizability with size is highly non-linear with respect to the constituent ratio and with geometry in both alloys and core–shell nanoparticles. Thus, going from the case of 100% gold to 100% silver in spherical nanoparticles the polarizability curve shows a minimum at about 40% before rising to the high silver value, see Fig. 13a and 14a. In the mixed situation, with difference in polarizability of the mixing constituents, there is a quenching and increased misalignment of the dipoles due to the heterogeneity where the nearest neighbors respond differently to the external field dipoles causing misalignment and losing the cooperative effect of having aligned dipoles. Interestingly, other shapes than spherical with a low aspect ratio showed a better linearity, see Fig. 13b and 14b for nanorods. It was furthermore demonstrated that there is only a small dependence of the surface plasmon resonance on the exact atomic distribution in a nanoparticle and that the numeric standard deviation of this dependence decreases rapidly with the size of the nanoparticles.
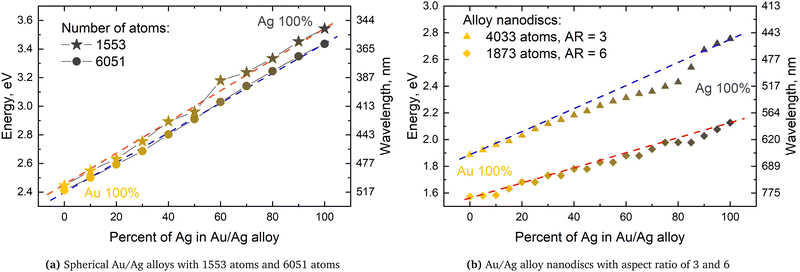 | ||
| Fig. 12 Position of SPR versus percentage of Ag atoms for Au/Ag alloys of different geometries. Dashed lines indicate Vegard's law. Note that the frequency in wavelength scale is non-linear. From ref. 149. | ||
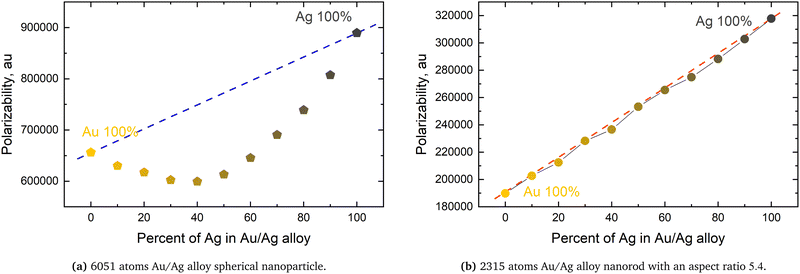 | ||
| Fig. 13 The polarizability at SPR maximum versus the percentage of Ag atoms for Au/Ag alloys of different geometries. Dashed lines indicate Vegard's law. From ref. 149. | ||
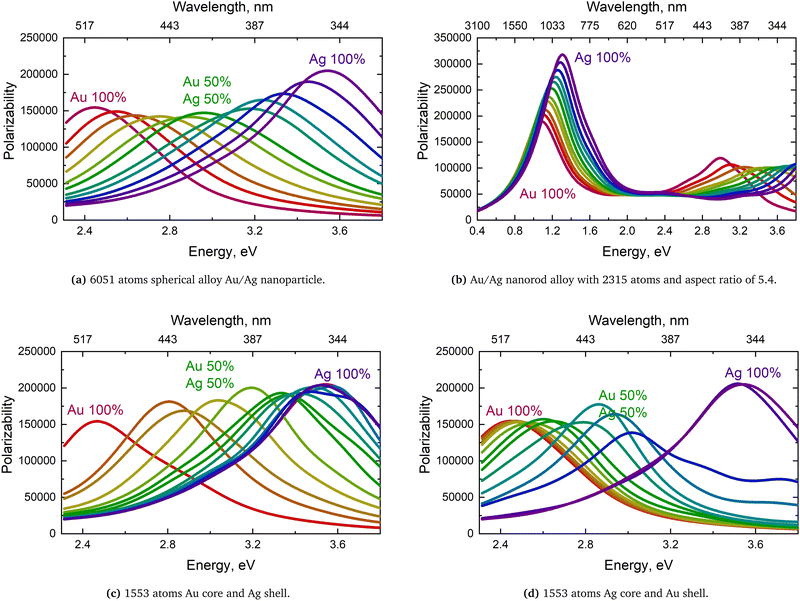 | ||
| Fig. 14 Polarizability of Au/Ag alloys spherical nanoclusters with different geometries in (a) and (d) and for Au–Ag and Ag–Au core–shells in (c) and (d). The frequency in the wavelength scale is non-linear. From ref. 149. | ||
Fig. 14(c) and (d) show the polarizability for the core–shell structure. As seen, the response is of quite unsystematic nature making it hard to a priori design such systems and to predict their polarizability. No enhancement above the Vegard law could be observed. The Ex-DIM results for the ultra-fine alloy particles indicate that the classical methods of treating an alloy without any atomic resolution largely are valid. With appropriate correction for the dielectric constant, classical methods could be recommended simulating nanoparticle alloys down to the 4–5 nm size. However, there is indeed a standing issue of the validity of current size corrections of the bulk dielectric constant for the very small particles and here direct Ex-DIM simulations of the dielectric constants could be recommended as a more precise alternative. It is clear that more irregular shapes and more complex elementary compositions, also will call for atomically decomposed models like Ex-DIM.
4.4 Plasmonics nanoparticles and local fields
Ref. 152 covered a broad range of geometrical structures with different symmetry and geometry in order to analyze the distributions of plasmonically generated near electric fields and the concentration of hot and cold spots around the particles, see Fig. 16. We could predict wide ramifications of these results for applications of ultra-fine plasmonic particles in the areas of imaging, sensing and energy harvesting. After the initial development and parameterization of the Ex-DIM method, and the test applications on spheres, rods, hollow particles and alloys reviewed above, a more comprehensive set of applications of the model was undertaken in this paper. Here, a variety of ultra-fine gold particles were studied, focusing on different geometric shapes and symmetries and on the local distributions of the plasmonically generated electric near-fields for all these particles. Although experimental comparison often indicates that classical electromagnetic theory works well when the complex dielectric environment is well characterized and modeled, there is, as already mentioned in the introduction of this review, an open question when the particle size is diminished to the level where there are issues with using the bulk dielectric constant. This is in particular the case when one deals with particles of complex shapes, which was the motivation for this study. One can here also question the applicability of conventional discrete dipole interaction models in this region and their capability to describe the plasmon polarizability dependence of the surface topology and their predictability of detailed field generation. With the Ex-DIM model applied in ref. 152 it was observed that also for very small nanoparticles there are significant field localizations and charge concentrations occurring at surfaces and close to sharp edges; however, with the difference that such localizations are spatially very confined, also for particles with high symmetry, and that there are sharp geometric variations of the field amplitudes. Hot spots appear as very narrow and can rapidly, within 1 nm or less, and can decrease to cold spots as an effect of interference between the external and generated fields. Thus when particles of this size are employed as strong field concentrators the geometric requirements are very sharp. It is here also notable that Ex-DIM makes it possible to study the role of internal crystal structure on the optical response of nanoscale particles, which makes it further possible to explore the external field polarization dependence of the generated local fields, something that is not achieved with the common classical models. As shown in ref. 152 there is in general a strong deviation from the Lorentzian surface plasmon extinction spectra, typical for ideal spherical particles, for particles with sharp edges and complex shapes. These shape features can significantly change the plasmonic spectra with respect to spherical particles of comparative size. We can summarize the findings for the different shapes as: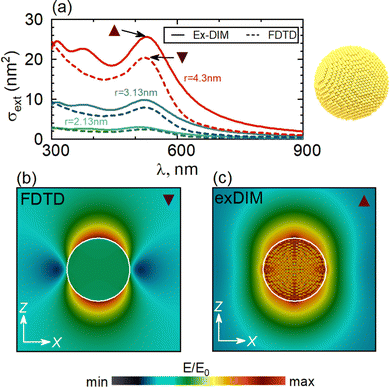 | ||
| Fig. 15 Extinction cross section spectra for spherical Au nanoparticles of different sizes in aqueous medium calculated by the Ex-DIM (solid lines) and by the FDTD method (dashed lines) (a); configuration of local electric field calculated for spherical particles with r = 4.3 nm using the FDTD method (b) and Ex-DIM (c) for Au spherical particles at the wavelength λ = 525 nm. From ref. 152. | ||
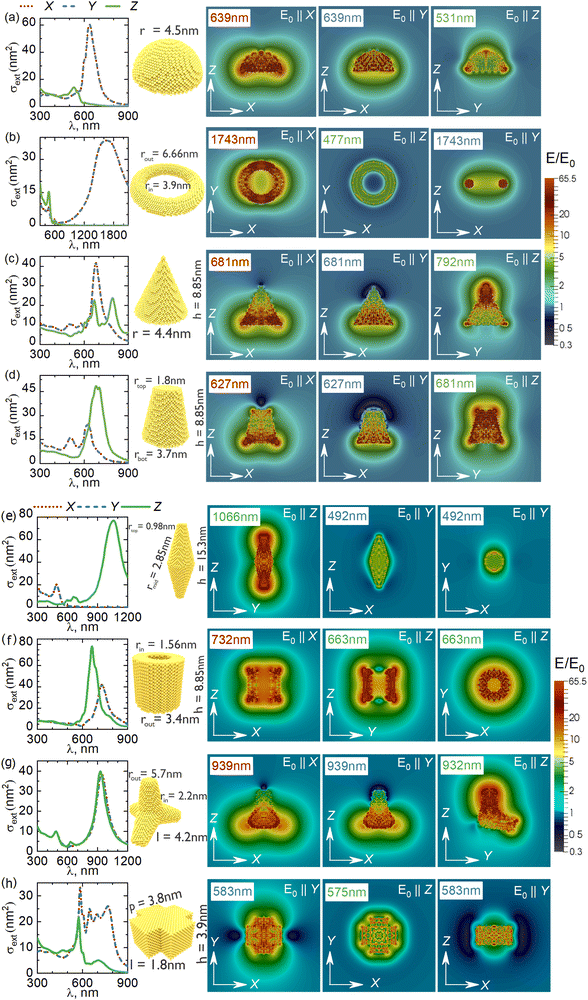 | ||
| Fig. 16 Plasmonic electric fields from polarized external electric fields together with spectra for ultra-fine plasmonic nanoparticles of different shape. From ref. 152. | ||
4.5 Red shifts
As mentioned in the introduction of this review, and which also served as a motivation to derive the Ex-DIM model, the ultra-fine regime 1–10 nm provides both challenges and opportunities for plasmonic research: challenges, because this size regime is in between the applicability of quantum mechanical methods and classical continuum electromagnetic theory, and opportunities as it can account for the most important aspects of both theories. Being semi-empirical yet based on atomic resolution, Ex-DIM, like other discrete interaction models, provides the possibility to address this size regime. Opportunities, because of the great number of applications such particles bring about, in particular for biosensing in the biomedical area where ultra-fine plasmonic particles provide a number of distinct advantages like reduced interference with the research object, size compatibility of small clefts, pockets and other compartments of the target biostructures. There are primarily two such factors that make plasmonic ultra-fine nanoparticles different from larger ones, namely enhanced surface effects due to the increased ratio of surface to bulk atoms, and the limited validity of using bulk dielectric constants. It is therefore imperative for a discrete interaction model to find quantitative relationships between structure and the plasmonic properties which remediate these two challenging factors.The red shift of the plasmonic response is one of these factors that needs to be scrutinized when going ultra-fine. This red shift with respect to nanoparticle size is an important factor in the design of the particle to operate in certain wavelength regions for sensing or imaging. A linear relationship between shift and size has long been assumed and applied as the prime design criterion. It was, however, recently contested in some recent reports not to hold for ultrafine particles. Piella et al.121 showed that there is an inflection point at about 8 nm in the red shift dependence for gold nanoparticles, above which the red shift retains its common linear behavior, while below it becomes non-linear with a stronger dependence on size; Haiss et al.135 observed a significant variation in size dependency of the red shift at about 10 nm. Their classical modelling approach agreed excellently with the linear dependency above this limit, but broke down below. The inflection point for the red shift indicates a change of physics. For the larger particles the so-called retardation effect has served as the underlying explanation, while for the ultra-fine regime one can suspect surface induced effects playing the dominating role. As the classical physics may break down, the use of atomistic-based descriptions is called for, something that was the case in the recent Ex-DIM work presented in ref. 160. Here the role of surface layers on the dependence of the red shift of plasmon resonance on the particle size was analyzed, from which a quantitative relation was derived and compared with available experimental data. Two key notions were introduced to unravel the surface effects—the anisotropy factor and the chaotization factor.
The anisotropy factor is defined by the positions of surrounding atoms around each arbitrary atom of the crystal lattice and the radial dependence of this factor.161 The local anisotropy of atoms near the surface increases due to breaking and deforming the crystal lattice near the surface. It has been shown that the local anisotropy factor strongly correlates with the local electromagnetic response. The chaotization factor refers to the degree of disorder of the atomic light-induced dipoles when interacting with each other, combined with the dispersion of their amplitudes. Both the anisotropy and the chaotization factors are mathematically defined in ref. 160. Fig. 17 summarizes the main result of the paper.
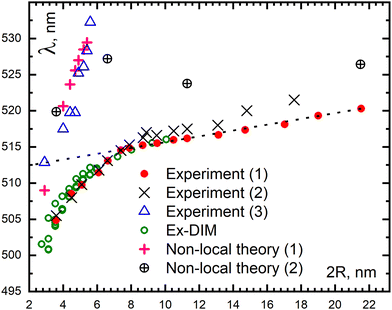 | ||
| Fig. 17 Comparison of the size dependence for the maximum absorption spectra of Au nanoparticles in aqueous medium with dielectric constant ε = 1.78 obtained by Ex-DIM in the size range 3–10 nm (hollow green circles) and experimental data (1) red circles from ref. 121, and (2) crosses from ref. 135. The experimental inflection point is established for a particle diameter of 8 nm. Dashed line shows a general trend in the red-shift size dependence for Au nanoparticles in the size range 8–22 nm. Data on the non-local theory (1) pink crosses were taken from ref. 162 for comparison with experimental data (3) blue triangles from ref. 118, and the non-local theory (2) black circled plus from ref. 130 for comparison with experimental data (1) from ref. 121 (red circles). Full figure from ref. 160. | ||
The inflection point at about 8 nm for the red shift dependence versus size is clearly seen in accordance with two recent experiments, while some work, both experimental and theoretical, are at odds with this finding.
The common view of the source of the linearity for the larger particles is due to an increase in the total effective (inertial) mass of electrons in a particle upon increasing particle size.163 A depolarizing field inside the particle is created due to collective oscillations of conduction electrons and local charge redistribution in the plasmonic nanoparticle. An electrical capacitive restoring force appears resonating with the inductive conduction of electron mass.163 The red shift then appears by an increase in the electromagnetic inertial mass of the conduction electrons in the nanoparticles. The increase in the inertial mass is in turn caused by inductive loading of magnetic fields inside and outside the nanoparticle. The inertial mass of electrons in the small sized particles is much reduced and would point at a reduced red shift dependence, quite opposite to what is observed in Fig. 17. Thus, other concurrent processes, come into play, namely those taking place at the surface. We then enter into a range where traditional Mie theory or other classical approximations are too limited to be applied. Here, we turn to the Ex-DIM results displayed in Fig. 18 referring to the radial dependencies of the local anisotropy factor; the degree of chaotization of atomic dipoles; the real part of atomic dipole moment distribution in a particle; and field distribution images for four different ultra-fine particles of size ranging from 3 to 6 nm.
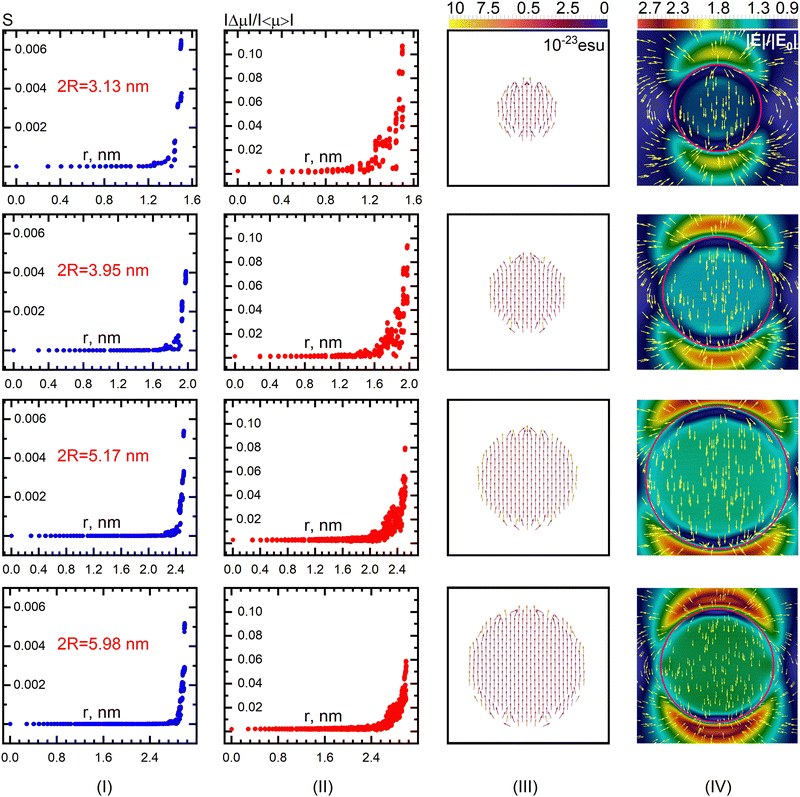 | ||
| Fig. 18 Radial dependencies of local anisotropy factor (I), chaotization of atomic dipoles (II); distribution of the atomic dipole moment (real part) in a particle (III), distribution of the maximum field strength modulus (|E|/|E0|) and field directions inside and around the Au nanoparticles with diameter 3.13, 3.95, 5.17, and 5.98 nm in aqueous medium with refractive index n = 1.33 at the wavelength of SPR maximum for vertical polarization (IV). The largest particle with a diameter of 5.98 nm with the field distribution image is reduced in order to cover the field distribution pattern (the pink circles around the particles indicate the positions of their boundaries). From ref. 160. | ||
Fig. 19 gives a comparison between the ideal case of complete orientational ordering of identical dipoles with equal amplitude and the effect of non-collinearity for an Au nanoparticle with a diameter of 3.13 nm. The chaotization effect in a surface layer of the field distribution inside and outside a particle for the same size parameters and ambient medium can in this way be visualized in Fig. 19.
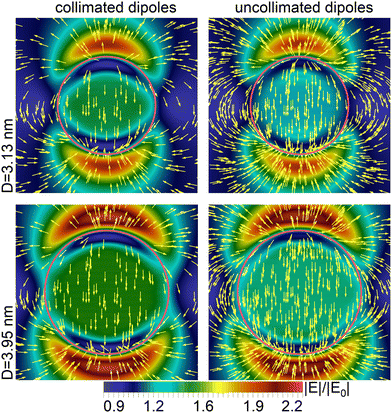 | ||
| Fig. 19 The maximum field strength modulus and the field direction inside and around the Au nanoparticles with diameter 3.13 and 3.95 nm in than aqueous medium with refractive index n = 1.33 at the wavelength of SPR. On the left: All dipoles in a particle are collimated; on the right: non-collimated dipoles. Polarization is vertical. From ref. 160. | ||
The nonlinear and stronger red shift dependence for smaller particles can be explained by the local anisotropy of the crystal lattice, and caused by the chaotization of light-induced atomic dipoles near the particle boundary, and furthermore by the field inhomogeneities arising near the surface. We here see that for all particles both anisotropy and chaotization factors are localized to the surface, but also that they spread inwards towards the bulk, more so for the smaller particles. This is also reflected by the dipole moment distribution, which spreads the most for the smallest particles and also with weaker generated plasmonic fields and weaker hot spots. It is seen that the distribution of the field strength modulus and field direction inside the nanoparticles are strongly inhomogeneous with a weakening of the local field strength towards the surface layer, as well as a concentration of field minima near the poles. These field minima are actually located below the surface in a thin layer. Cold spots of the field appear at the particle poles and intensify when the particle is embedded in a dielectric medium (not shown).
All the above reviewed features can be referred to the fact that the relative, but not the absolute, size of the surface layer of the particles strongly depends on the particle size for a given local environment. In actuality, it is the ratio of the volume of the surface layer to its entire volume that is the physically important factor, rather than the particle surface-to-volume ratio, as is commonly considered. Thus, the red shift mechanisms in the extinction spectra for ultra-fine nanoparticles are associated with a significant increase in the surface layer volume with decreasing particle size. We may conclude that processes at the surface layer can be represented by a local anisotropy factor describing the arrangement of atoms that, upon interaction with an incident radiation, leads to a chaotization of the light-induced dipoles in this layer, which implies a lowering of their orientational ordering and dispersion of amplitudes. The chaotization reduces the strength of the resonant interaction between the atomic light-induced dipoles, thereby lowering the total polarizability. This in turn increases the plasmon frequency and the red shift compared to larger particles.
4.6 Medium shifts
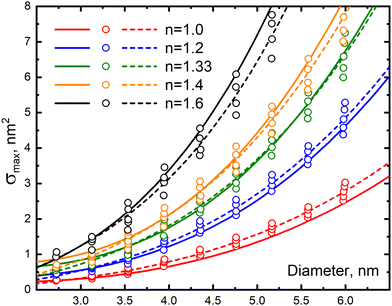
The strongest applied feature of plasmonic nanoparticles is their ability to generate ultra strong electric fields for sensing objects in the neighborhood, so strong in fact as to make it possible to detect single molecules. However, plasmonic particles can also be used to probe their environment by means of how the plasmon excitation itself is perturbed by its surroundings. Here, the refractive index sensitivity is an important concept whereby the environment and its refractive index are sensed by the shift of the plasmon resonance. The early variants of surface plasmon resonance devices relied on the generation of surface plasmons in thin metallic films, which were used as indicators of the changes in the refractive index of the close environment or ligands to surface binding. Thus, the plasmon maxima and extinction coefficient are sensitive to the dielectric properties, n.b. refractive index, of the materials close to the particle surface.118,164–178 Subsequently, it was shown that the use of plasmons emerging from nanoparticles could give even higher sensitivity than biosensing devices based on thin film generated plasmons.179 It has been possible to settle that the plasmon frequency in general changes in a regular manner upon change of the refractive index changes, and also that the size and shape of the particle matter a lot for how strong this dependency appears, where larger particles tend to increase the dependency and so also shaped particles compared to spherical ones.180–182 Many recent articles are now available that explore and analyze these dependencies, using different methods, see e.g. ref. 183–186.It can in this context be relevant to recall some facts from classical dielectric theory assuming a bulk dielectric constant. According to this theory, the frequency of the plasmon resonance of a metal particle ωpl (the first dipole resonance) in a small sphere depends on the real dielectric constant of the ambient medium (εm) as  . The parameter εib reflects the contribution of interband transitions to the dielectric function, and ωp is the plasma frequency. This simple relation tells that the surface plasmon resonance experiences a red shift increasing with increasing dielectric constant of the medium. In the dipolar approximation, the extinction cross section of a metal nanoparticle with dielectric constant ε′ + iε′′ and radius R increases with εm (λ is the light wavelength)175,187
| σext = 24π2R3εm3ε′′/λ[(ε′ + 2εm)2 + 2ε′′2]. | (32) |
 | ||
| Fig. 20 Comparison of the results from Mie theory and Ex-DIM model calculations of the SPR maximum as a function of Au nanoparticle size for different refractive indices of the ambient medium. Mie theory calculations obtained with size correction for the dielectric constant of Karimi130 are given as solid lines. Discrete Ex-DIM data are given as hollow circles and approximating functions are marked as dashed lines. From ref. 124. | ||
Fig. 21 demonstrates plots of absorption band maximum on the inverse particle diameter at various values of the refractive index where only small deviations from linearity for the high index data are observed. Thus, the classical relation above basically also holds for the small sizes. As the particle size increases, the influence of the medium increases the maximum extinction cross section and decreases the red shift. Thus we see regular trends for these aspects. Fig. 22 shows the dependence of the plasmon resonance maximum on the refractive index of the environment for different particle sizes. One notices an increase of the red shift with increase of refractive index of the medium, with the red shift becoming anomalously strong in this small size range for a given medium, much stronger than for larger particles beyond 8 nm. As discussed in the previous section, this observation can be referred to the chaotization of atomic dipoles of the surface volume and that the surface volume to total volume ratio becomes essentially larger.
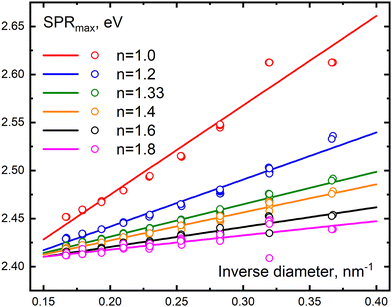 | ||
| Fig. 21 SPR maximum of Au nanoparticles (in eV) versus their inverse diameter at different values of the refractive index of an ambient medium – discrete Ex-DIM data (hollow circles) and approximating functions (solid lines). From ref. 124. | ||
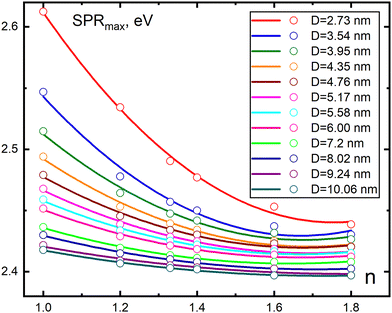 | ||
| Fig. 22 SPR maximum of Au nanoparticles (in eV) versus the refractive index of an ambient medium for Au nanoparticle sizes in the range 2.73–10.6 nm: discrete Ex-DIM data (hollow circles) and approximating functions (solid lines). From ref. 124. | ||
4.7 Refractive index sensitivity
The refractive index sensitivity (RIS), defined by the ratio of the resonance wavelength shift to the change of refractive index of the surrounding medium, is an important concept for biosensing using plasmonic particles with numerous applications. Here, the character of this factor for small particles becomes extra important to scrutinize owing to the above commented great utility of small particles in the context of biostructures like protein pockets, cell channels, etc. As already stressed in this review, we then enter into a surface physics domain and a domain where the mean free path of the conduction electrons may exceed the particle size and therefore is associated with limited applicability of using the bulk dielectric constants.Mie theory results in Fig. 23 shows the dependence RIS on Au particle diameter for an aqueous medium. The size correction of the Mie theory for the Au dielectric constants was taken from Karimi.130 Two opposite trends are found—a decrease in RIS in the ultra-fine size range and an increase in RIS in the large particle range, with a minimum at 10 nm. These two trends converge at the minimum. It should be noted that the anomaly in the ultra-fine range holds only at small values of the refractive index values n ≤ 1.33. Fig. 24 demonstrates the corresponding results using Ex-DIM dependence of RIS on the particle diameter for aqueous media in the ultra-fine particle range. The difference for RIS magnitudes for 8–10 nm particles between Ex-DIM and Mie can probably be related to differences in the physical mechanisms underlying the models. The results of Fig. 23 and 24, showing RIS anomaly for small size particles finds an explanation in that the relative extent of its surface layer (ΔR/R) rapidly decreases with particle growth. Here the extent ΔR weakly depends on the radius at a given value n.124 This means that the contribution of the surface layer reduces with increasing particle radius.
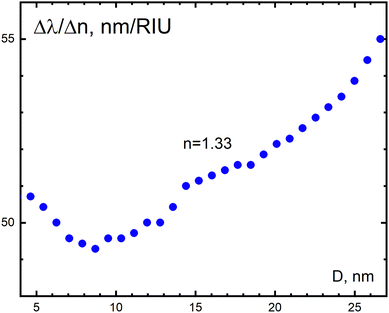 | ||
| Fig. 23 Dependence of the refractive index sensitivity (RIS) of Au nanoparticles with sizes 5–27 nm at the refractive index of aqueous medium (n = 1.33). The Mie theory calculations with size correction for the Au dielectric constants by Karimi.130 From ref. 124. | ||
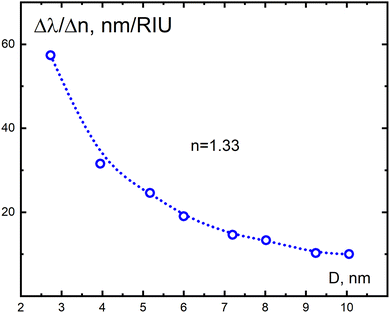 | ||
| Fig. 24 Refractive index sensitivity (RIS) of Au nanoparticles versus nanoparticle size in the range 2.73–10 nm (an enlarged fragment of Fig. 23 in the ultra-fine size range 5–10 nm) at the refractive index of aqueous medium (n = 1.33). Ex-DIM calculations. From ref. 124. | ||
The results of Ex-DIM calculations of the local fields inside and around nanoparticles of different sizes in the surrounding dielectric medium are collected in Fig. 25 with refractive index values in the range n = 1.0–1.8. This figure demonstrates that the field strength grows with increasing refractive index, as well as with particle size (see also Fig. 10 in ref. 124). However, the increase in field strength with growing particle size is less pronounced. That is, the effect of the medium is dominant. The results of calculations for vacuum (n = 1) in Fig. 25 demonstrate the minimum variation of field strength as a function of size (note the different colour bar scales for different sizes).
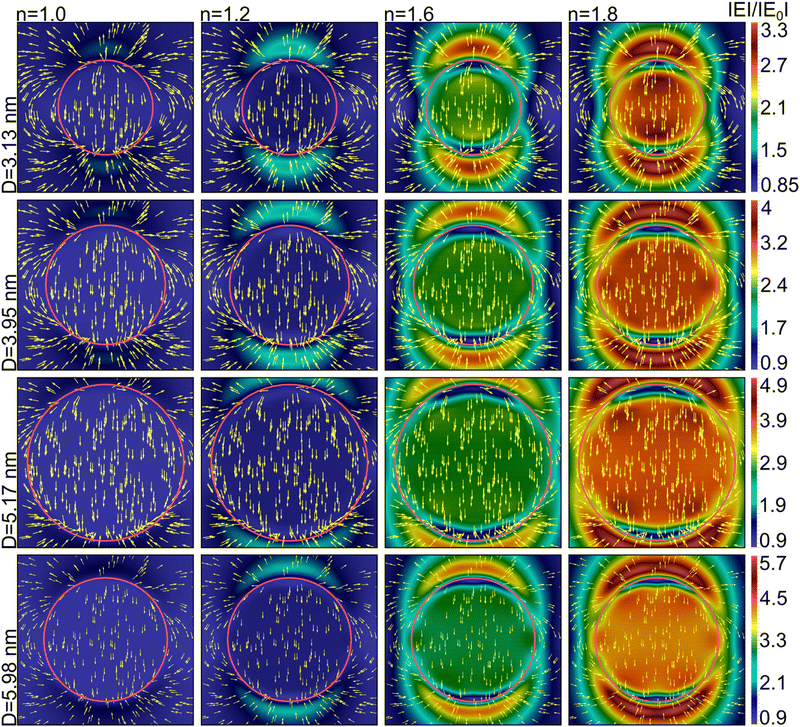 | ||
| Fig. 25 Distribution of the field strength modulus (|E|/|E0|) and the field directions inside and around the Au nanoparticles with diameters of 3.13, 3.95, 5.17, and 5.98 nm as a function of the refractive index of the ambient media n = 1.0; 1.2; 1.6; 1.8 at the wavelength of the SPR maximum. The largest particle with a diameter of 5.98 nm with the field distribution image (in the bottom row) is reduced in order to cover the field distribution pattern around the particle. Polarization is vertical. Color bars used are different for the different sizes due to the large variation in the field amplitudes. From ref. 124. | ||
The figure also indicates that the field strength receives a maximum at a distance above the poles of the particle, while it is weaker right at the surface and also that with larger refractive index of the surrounding medium the localization of that maximum moves farther from the surface.
In conclusion, from the work in ref. 124 it is clear that a plasmonic nanoparticle reacts with its environment by shifting the plasmon resonance towards longer wavelengths and by increasing its amplitude, thus following the general trend for larger particles.172–177 This is due to the formation of a dipole-polarised layer of molecules on the inner surface of the dielectric cavity in which the nanoparticle is immersed and an increase in the local field inside this cavity.
With a larger refractive index of the dielectric medium this field increases, creating a higher polarization of the molecules in the medium at the wavelength of the plasmon resonance. As discussed, there is a relation between this medium effect and the trend for the spectral red shift, but in both cases there is an accelerating effect for smaller particles (see Fig. 3 in ref. 124). It is noteworthy that with the growth of the refractive index of the ambient medium, the perturbed part of the surface layer of particles expands (see Fig. 8 in ref. 124).
Following the results of ref. 124 it is clear that for the ultra-fine particle regime the contribution to the local field enhancement is dominated by the medium effect in comparison to the size effect, as manifested by the red-shift.
When the local field is enhanced inside the spherical cavity the induced atomic dipoles increase their amplitudes, thus strengthening the dipole interactions with an additional chaotization at the surface layer. This contributes in turn to the penetration of chaotization into deeper layers of the particle. Interestingly, the behavior trend changes at the 10 nm region. As discussed in Section 4.6, the red shift behavior changes – in that an anomalous red shift is introduced below this size. This seems to hold also for the medium effect – in fact in ref. 124 a corresponding anomaly for the refractive index sensitivity was predicted and that this factor changes its trend from decreasing to increasing passing through a minimum, see Fig. 24. Again this must be associated to change in the physics when the relative volume of the surface layer compared to the full volume of the particles increases. In this case, the sensitivity to the refractive index reaches a minimum value in the size range of 8–10 nm. According to the available data, e.g. ref. 172 and 175, with further growth of particle sizes up to 20–30 nm and much above, the sensitivity to increasing refractive index grows again due to enhancement of the local field in the dielectric cavity with increasing refractive index and due to the strengthening of the processes responsible for the red shift of the plasmon resonance maximum in the “large” particle range.163
4.8 Thermoplasmonics
Thermoplasmonics constitutes one of the most attended application areas for nanoparticle plasmonics. The ability to generate extremely intense near-fields that produce concentrated local heating has a number of implications within biotechnology. One of the most prominent implications being the ability to break membranes of “bad” cells or bacteria. The therapeutic effects are here obtained by means of hydrodynamical effects generating vaporization bubble pressure from the heated nanoparticles when bound to malignant cell membranes or malignant neoplasms. The use of nanoparticles significantly reduces the intensity threshold of pulsed laser radiation to avoid damage effects on normal cells, and to localize the destructive temperature field near the particle. Anticancer therapy by thermoplasmonics has thus generated a manifold of biomedical studies, see reviews in ref. 189–191. Thermoplasmonics has found important applications also in other areas, like nanosensorics, plasmonically enhanced Raman scattering, waveguiding, photoacoustic imaging and near-field heat transfer using nanoparticles. However, “thermoplasmonics” can also have a somewhat different meaning, namely how temperature perturbs the properties of nanoparticles, like crystal structure, particle shape or the light matter interaction that generates the plasmon resonances. This is important knowledge as when the particle is heated too much it may weaken or even completely loose its plasmonic property. The heating is caused mainly by the exciting laser light but also by the fact that the heated medium surrounding the nanoparticle by the super concentrated near-field can further warm to the particle itself. Thus for each experimental setup there is an optimum laser effect for using nanoparticle plasmonics that is important to identify.A particularly important scenario takes place when the nanoparticles transfer into the liquid state as a result of intense laser radiation.192–194 Quite a drastic change can then be expected for the optical properties, which also can become non-linear in this temperature regime.195 Moreover, the melting nanoparticles can then react with the heated environment generating crucial side effects. Motivated by these facts, Ex-DIM calculations were carried and analyzed in ref. 196 in order to find the underlying causes for temperature changes of the plasmonic properties and to establish correlations between structural modification of the crystal lattices, the dynamics and the phonon relaxation with the plasmonic generation covering a variety of temperatures up to melting and beyond as seen in Fig. 26.
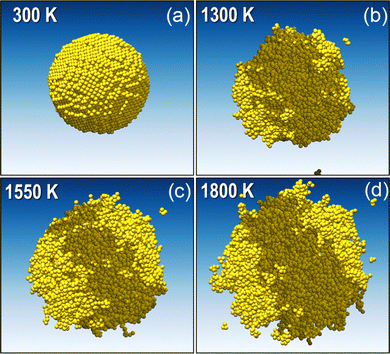 | ||
| Fig. 26 Reactive force field molecular dynamics simulations of the evolution of the Au nanoparticle shape upon temperature growth – from the initial state at room temperature (D = 6 nm) directly to extremely high temperature values much above the melting point. From ref. 196. | ||
Here structural data were obtained by means of molecular dynamics and a semi-empirical theory for relaxation constants of the plasmonic excitation states was employed, making also comparisons with multilayered Mie theory.
Much of the underlying features behind the Ex-DIM analysis of the thermoplasmonics for ultra small nanoparticles can be found in Fig. 27(I) and (III), displaying temperature dependencies of the atomic mobility in a gold nanoparticle, the spectral density of states and distributions of the local fields inside the particle and near its surface with rising temperature. Furthermore, the figure demonstrates the chaotization of the crystal lattice structure and the increase of vibrational amplitude with growing mobility of atoms. It is clear that rising temperature gives a geometry change that involves a randomization of the lattice and an increase in the crystal lattice constant. The effect of structural change and randomization of the crystal lattice on the extinction spectrum is shown in Fig. 28(a) and (b), where the room temperature relaxation is kept constant. It is clear from Fig. 28 that the structural change and randomization of the crystal lattice effect from the temperature is almost negligible. The relaxation factor is here clearly the most important mechanism. However, both factors should still be kept in mind in order to interpret the overall results presented in Fig. 29 and 30.
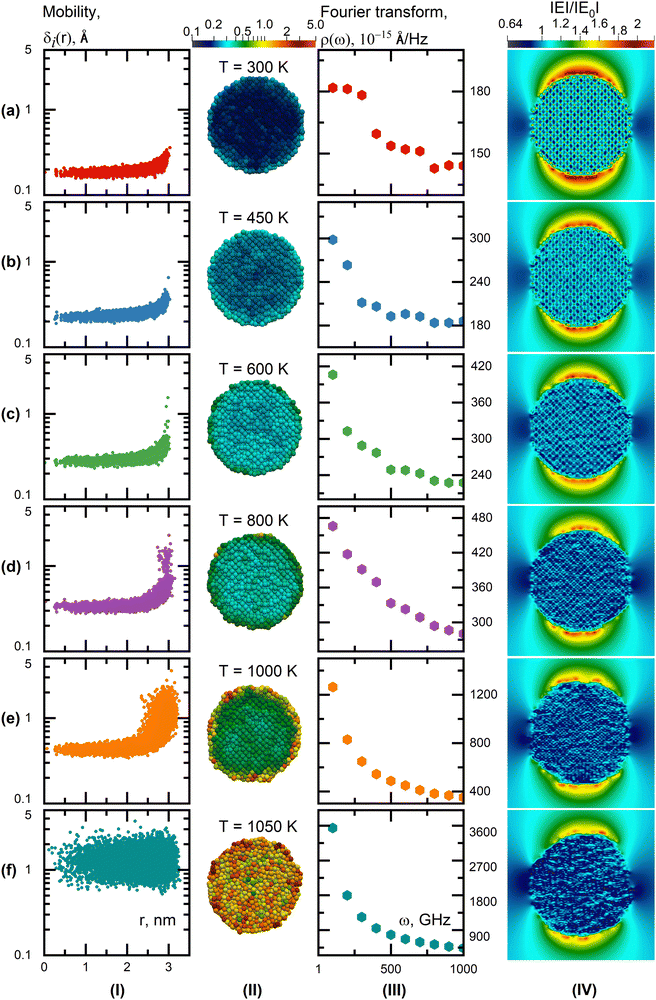 | ||
| Fig. 27 Temperature dependencies (columns I, II, III, IV) of the atomic mobility in an Au nanoparticle with radius R = 3 nm (I), view of this mobility in the particle cross-section with internal structure (II), the Fourier transform of the time dependent modulus of the i-th atom coordinate (|ri(t)|) as a spectral density of states in a unit range Δωi within in the frequency range up to 1012 Hz (III), and distribution of the local field inside the particle and near its surface with rising temperature (for vertical polarization) (IV). From ref. 196. | ||
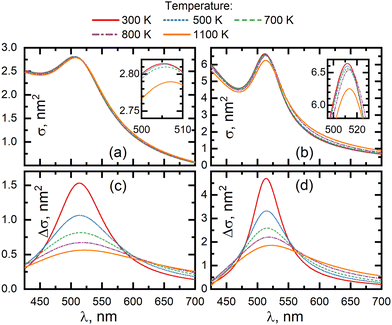 | ||
| Fig. 28 Structure effect on the extinction spectra for the 6 nm Au nanoparticle from Ex-DIM calculations. Geometries are taken at different temperatures but with the relaxation constant fixed at the room temperature—Γi (T = 300 K). Insets show the enlarged fragments of spectral curves near the surface plasmon resonance maximum. Plasmonic absorption spectra of the 6 nm Au nanoparticle with a subtracted interband absorption band of gold at different temperatures. (a) and (c) In vacuum (n0 = 1), (b) and (d) in medium with a refractive index of n0 = 1.33. From ref. 196. | ||
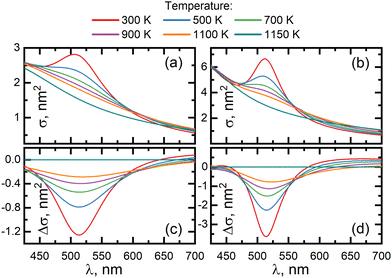 | ||
| Fig. 29 Extinction spectra variation for the 6 nm Au nanoparticle with suppression of surface plasmon resonance in the temperature range 300–1150 K (Ex-DIM calculations). Variation of differential extinction spectra with suppression of surface plasmon resonance in for temperatures 300–1150 K (all curves were subtracted from the spectral dependence for T = 1150 K). (a) and (b) In vacuum, (b) and (d) in medium with refractive index n0 = 1.33 (b). From ref. 196. | ||
 | ||
| Fig. 30 The plasmonic resonance as a function of temperature for three particles with 1433, 4321 and 9693 atoms. The melting temperatures of the particles are 977 K, 1103 K and 1160 K, respectively. From ref. 196. | ||
As can be seen from the series of images obtained from Ex-DIM in Fig. 27(IV), there is an inhomogeneous local field distribution inside the heated particle and near its surface. The maximum values inside the particle reside near its poles for the ordered crystal lattice at cold temperature, but as the temperature rises, the pole fields decrease and deviate from a classic spherical configuration. Here, the internal local fields inside the particle experience a decrease in the amplitude with increasing temperature. Fig. 29 clearly demonstrates the suppression of the surface plasmon resonance with increasing temperatures up to melting temperature (which in ref. 196 is calculated to be 1130 K from the Gibbs–Thomson equation). From Fig. 30 it is seen that the suppression of the surface plasmon resonance with increasing temperatures behaves in a similar fashion independent of the particle size. Compared to multilayered Mie theory, the Ex-DIM model predicts faster decrease of the SPR maximum at lower temperatures, see Fig. 31, with a more linear correlation between the maximum plasmon extinction coefficient and temperature being predicted. A better visibility of the temperature suppression is given by the differential spectra between going from solid to melted particles shown in Fig. 29(c) and (d), which also display the small red shifting of the resonance with temperature.
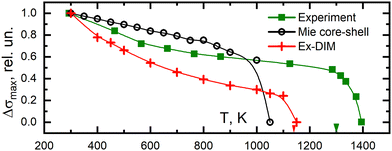 | ||
| Fig. 31 Suppression rate for SPR maximum versus temperature growth calculated by the multilayered Mie theory in the case of inhomogeneous radial dependencies of the dielectric constant in a 6 nm Au nanoparticle (circles), by Ex-DIM with homogeneous radial dependencies of dielectric constant (cross dots) – both in vacuum (n0 = 1), and an experimental extinction spectrum of 40 nm Au nanoparticles on a quartz substrate (square dots).197 Arrows on the temperature scale show the melting points for the 6 nm and 40 nm nanoparticles. From ref. 196. | ||
An experimental validation is given in Fig. 31, which demonstrates a comparison between Ex-DIM (6 nm particle), Mie theory (40 nm particle) and experimental data (40 nm particle) for plasmon maximum extinction coefficients with rising temperature. It is notable here that despite the large difference in particle size (6 vs. 40 nm) there is a better representation of Ex-DIM with respect to Mie theory concerning both the slope of the curves and the melting points with complete plasmon depletion.
In conclusion, it is clear that the heating of plasmonic nanoparticles generates and enhances electron–phonon scattering with entailed increased plasmon relaxation and a change of dielectric constant. There are also strong structural variations, both for the inner lattice atoms and for the overall shape of the particles, the latter becoming chaotic towards melting. For more complex particle shapes, additional resonances are acquired as a result of shape change also at lower temperatures, which will appear as an overall broadening of the plasmonic spectrum. It could be established that the radial dependence of the mobility is much higher near the particle surface than in the central part, reflecting that the melting starts from the surface and progresses inwards. It is also clear that the surface melting occurs at a much lower temperature than core melting, corroborating with experiments.128 On melting, the mobility becomes homogenized over the particle volume before the particle totally disintegrates. In between, however, the mobility demonstrates staged features, thus increasing towards melting in a non-monotonous way. The study in ref. 196 could numerically establish the depletion of the plasmonic generation with rising temperature by means of Ex-DIM calculations. That was also corroborated from analysis of Fourier spectra representing the average amplitude of phonon oscillations with respect to frequency. It could thus be concluded that it is the electro-phonon coupling, which increases the relaxation constant, that is the major reason for the plasmon depletion. The electro-phonon coupling thereby being significantly more important than the chaotization of the internal nanoparticle structure. The suppression of the plasmon starts at temperatures well below the melting point going up to full suppression at melting, something that equates with the importance of the surface for plasmon generation and that the surface melts at smaller temperatures than what the full particle does. These are thus important features to learn in order to understand the plasmon behaviour of ultra-fine nanoparticles at shifting temperatures.
5 Discrete interaction models versus classical models for plasmonics
The finite difference time domain (FDTD) method47 is one of the key methods for describing the optical properties of nanostructures. This method has been developed since the middle of the 20th century and has become one of the most popular methods of numerical electrodynamics. The method is based on a discretization of Maxwell's equations written in differential form. Unlike other methods, such as the coupled dipole approximation, the mathematical model underlying FDTD does not use approximations and is accurate for classical electrodynamics. The equations are solved by the finite difference method on two nested structured rectangular grids, one of which is used for calculating electric fields and the other for magnetic fields. The method makes it possible to obtain in one calculation the transmission and reflection spectra and the field distribution in the computational region, taking into account both the complex composite structure of the system under study and the optical properties of the materials used. The possibility of using periodic boundary conditions and optimization by taking into account the symmetry of the unit cell of the periodic structure can significantly speed up the calculation process. Also, the method allows parallel computations using high-performance cluster systems.COMSOL Multiphysics48 is based on Maxwell's equations, calculated in the frequency domain, and can be used for computing optical properties, including the absorption and scattering cross sections of plasmonic nanoparticles of arbitrary shape. In contrast to FDTD, the calculation of the optical properties of nanoparticles with strongly nonspherical shapes containing sharp corners are more accurate due to the use of trigonal meshes in this method. This makes it possible to understand how the optical properties of a nanoparticle depend on its size and changes in the local environment, as well as how the near-field enhancement is affected by the plasmonic interaction of nearby nanoparticles.
The discrete dipole approximation (DDA), briefly mentioned already in Section 2, is a method for computing scattering of radiation by particles of arbitrary shape and often by periodic structures. Given a target of arbitrary geometry, one seeks to calculate its scattering and absorption properties by an approximation of the continuum target by a finite array of small polarizable dipoles, e.g. ref. 112, 198 and 199. Light-induced dipoles interact with each other, which is described by the coupled dipole approximation (CDA), e.g. ref. 200. This technique is used in a variety of applications including nanophotonics.
Discrete medium description methods such as DDA make it possible to investigate arbitrary shapes as well as the possibility of introducing anisotropy within the nanoparticle. However, this approach has some limitations in the number of dipoles used, which reduces the accuracy of the representation of complex shapes. An alternative approach is to numerically solve the electromagnetic scattering equations using the boundary element method (BEM).201 BEM, in general, is a numerical computational method for solving linear partial derivative equations that have been reformulated as integral equations defined at the boundary of the system. Ultimately, it allows for greater control over the details of the object under study – see e.g. ref. 202. As an example, BEM has been successfully used to study the radiative properties of plasmonic core–shell nanowire resonators,203 and for modeling multiple scattering of plasmonic nanowires.204
The T-matrix method has proved to be highly efficient and is widely used in the calculation of electromagnetic scattering of single and composite particles. This method is one of the most powerful and widely used tools for accurately computing light scattering by non-spherical particles, based on directly solving Maxwell's equations, see e.g. ref. 205 and 206.
The generalized many-particle Mie theory207,208 is often used to calculate the interaction of plane electromagnetic waves with systems of spherical particles. Compared to general methods for solving an electromagnetic problem (for example, FDTD, COMSOL), Mie's theory allows for faster solutions and often more accurately but only for spherical particles. The basis of the many-particle Mie theory lies in classical one-particle theory. It is based on expanding the solution of the wave equation in a homogeneous medium in vector spherical functions. The electromagnetic field is presented in three components: the incident and scattered waves outside the particle and the field inside the particle. The solution to the scattering and absorption problem is achieved by fulfilling the boundary conditions at the particle/environment interface.
The many-particle Mie theory considers the interaction of a plane electromagnetic wave with a system of spherical particles. The calculation of the electromagnetic response of each particle is similar to the single-particle Mie theory, but the wave incident on a given particle is the sum of the external wave and waves scattered by other particles in the system and can be carried out using, for example, Gaunt coefficients. Thus, the solution of the scattering and absorption problems is given by the solution of the system of linear algebraic equations.209,210
As for theoretical models in general, discrete interaction models, including their extended versions, are associated with merits and limitations. There are some particular advantages with the DIM models over classical models that consider the nanoparticle material as a continuous medium. Here, the Ex-DIM model makes it possible to study the properties of arbitrarily shaped particles and makes it possible to obtain information on the detailed distribution of local electromagnetic fields inside the particle – literally around each atom, as well as around arbitrary defects, and to evaluate how these defects affect the optical properties and the ability to enhance local electromagnetic fields. In continuum models, these fields are visualized as a continuous homogeneous background inside the particle, whereas in reality this is clearly not the case.
In particular, DIMs make it possible to detect the surface layer of atoms in a nanoparticle, which exhibits strong inhomogeneities of the local field due to the anisotropic surrounding of each atom by neighboring atoms. This distinguishes the surface layer from the inner regions of the nanoparticle, where the environment of each atom is isotropic. In addition, Ex-DIM makes it possible to study the influence of lattice defects or its partial chaotization on the optical properties of the nanoparticles and their ability to enhance the local field, which is impossible in the case of continuous medium models in which the influence of chaotization cannot be taken into account if interatomic bonds are preserved. Besides that, when investigating the use of SERS to detect impurity molecules in the presence of plasmonic particles, Ex-DIM reveals an important feature, namely that the maximum enhancement of the local field near the surface of particles is shown to take place not on the surface of the particle itself, but somewhat further from its geometric surface, which is not detected using classical methods.
Fig. 32 illustrates a comparison between the results obtained from calculating the local field distribution around a gold nanotetrahedron using FEM implemented in COMSOL Multiphysics48 and Ex-DIM. The figure depicts a matching pattern of field distribution with only a slight difference in amplitude, which is not fundamental when considering the normalized values.
It is also worthwhile noting the possibilities that Ex-DIM provides for the study of alloys and mixtures of atoms capable of forming crystal lattices with an arbitrary ratio of the number of different atoms. Obviously, when using classical models, experimental data on optical constants of alloys with arbitrary ratio of fractions of different atoms are necessary in order to solve Maxwell's equations. New opportunities of Ex-DIM are opened when it is combined with the use of molecular dynamic simulations, e.g. the LAMMPS (large-scale atomic/molecular massively parallel simulator) software.211 This provides information on the stability of the crystal lattice composed of different atoms (alloys) and also opens up the possibility of studying the optical properties of amorphous and porous metals, as well as metallic foams.212 In addition, Ex-DIM makes it possible to study the effect of external mechanical impact on nanoparticles, namely their one-dimensional stretching or compression deformation on optical properties.
All that is said above refers to metallic plasmonic nanoparticles, but the same tasks can be investigated with the help of Ex-DIM in dielectric nanoparticles, including studies of both optical properties and the possibility of use in tasks of photovoltaics. We can foresee a multitude of applications of DIMs as well as development of the models and merging to other models, classical or quantum, in a multiscale setting. Below we present an outlook that shortly speculates on a few possible lines of development and applications which seem extra promising.
6 Outlook – opportunities and challenges for ultra-fine particle plasmonics
6.1 Ex-DIM thermodynamic models for plasmonic heat generation
As discussed in Section 4.8 a very useful aspect of metal nanoparticles is that the enhanced light–matter interaction at their plasmonic resonance induces very high temperature increments, highly localized in space and time. Such increments can actually be created with moderate light intensity without thermobleaching or photobleaching of the absorbers.213 The ability to release heat on the nanoscale has impacted a broad range of research activities, from biomedicine and imaging to solar light harvesting and catalysis.214 Plasmonic photothermal therapy can be promoted by thermally selective laser irradiation of biostructures, like malignant tumor cells, when labeled with plasmonic nanoparticles. Here, one can suggest the selective exposure to be based on either employing DNA aptamers or antibodies attached to the surface of the plasmonic nanoparticles, which allows them to bind to specific membrane proteins of the malignant cells. The use of nanoparticles significantly reduces the intensity threshold of pulsed laser radiation to avoid damage effects on normal cells, and to localize the destructive temperature field near the particle.22,25,26 The advancement in theory of ultra-fine plasmonics will make it possible to more precisely define the nanoparticles for plasmonic field distributions and hot spots with optimum heating of the cell membrane, but at the same time avoiding the depletion of the plasmon excitation itself by heat – thus optimizing the heat effect on the plasmonic nanoparticles for given laser characteristics – intensity, wavelength and pulse duration.22,215,216 We see opportunities in joining the Ex-DIM method with thermodynamic models, which can make it possible to solve the dynamic problem of heating by the plasmonic nanoparticles taking into account not only their special characteristics but also the parameters of the laser pulses.217 The energy of electromagnetic radiation absorbed by the particle is then predicted using the Ex-DIM module by calculating its temperature dependent absorption cross section and then transferred to the heat exchange module as an input parameter along with the external radiation intensity. New possibilities for experiments on hypothermia of malignant cell membranes are here opened by using strongly non-spherical particles, e.g., plasmon stars.2186.2 Ultra-fine plasmonic nanoparticles for enhanced photoacoustic imaging
Photoacoustic imaging219 involves non-ionizing laser pulses delivered into biological tissues that are absorbed and converted into heat, leading to transient thermoelastic expansion and therefore wideband ultrasonic emission. As a result, the magnitude of the ultrasonic emission reveals physiologically specific optical absorption contrast.220,221 One can here foresee multiple advantages of using ultra-fine nanoparticles, namely to focus heat, to navigate in the tight biostructural environments, and being easier to rinse from tissue and body than larger nanoparticles. The control of heat is necessary in order to establish a balance between the action of heat (i.e. the photoinduced thermal increase of target volume) and the destructive action on both the environment and the nanoparticle plasmon generation. We can anticipate applications in many areas, for instance in tracing early stages of neurodegenerative disease, which are governed by brain proteinopathies, where the authors have been active.222–224 Here one can apply simulation guided ultra-fine plasmonic nanoparticles that are conjugated to targeting biomarker probes that bind to proteins, plaques or proto-fibrils.6.3 SERS—surface enhanced Raman scattering
SERS constitutes perhaps the most well-known application of plasmonics and has been a frequently used tool for identifying the binding sites of small molecules on therapeutically important proteins.225–227 As SERS can be performed for proteins at extremely low concentrations in their active state, the competitive binding versus noncompetitive binding and specific changes in the proteins upon ligand binding can be targeted. One can here foresee the use of Ex-DIM in the design of bioconjugated SERS reporter systems for binding to, and detection of, cancer cells or protein fibrils that are early hallmarks of neurodegenerative diseases. The full effect, plasmonic field enhancement and shifts in Raman signals and spectra, may in the future be simulated using multiscale techniques, taking account of the main interactions in the compound systems in addition to the light–matter interaction. In addition to the action of a plasmonic particle, it is relevant to trace the structural refinement when the biomarker approaches the protein and also the effect of the various binding situations on the actual Raman spectra, see Fig. 33. A developed combined SERS-simulation protocol may thus help converge the potential of ultra-fine nanoparticles for diagnostic and therapeutic applications.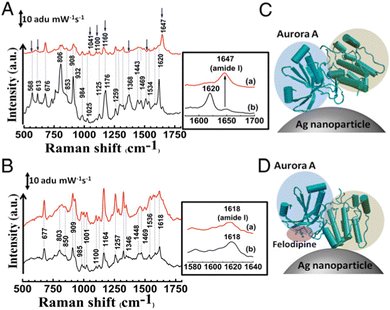 | ||
| Fig. 33 SERS study of specific binding of felodipine to Aurora A. (A) SERS spectrum of Aurora A (black) and Aurora A complexed with felodipine (red). (B) SERS spectrum of Aurora B (black) and after treatment with felodipine (red). From ref. 228. | ||
6.4 TERS—tip enhanced Raman scattering
Sub-nanometer resolution under local plasmonic excitation can nowadays be obtained by the tip-enhanced Raman scattering (TERS) technique.229 Its physical origin can be understood by a quantum mechanical interaction between a molecule and a highly confined plasmonic field, see the schematics in Fig. 34 (ref. 230). Using the capability of designing ultra-fine plasmonic structures, one can aim to cope with the current possibilities for local plasmonic enhanced Raman images of single molecules where the spatial distribution of the plasmonic field is comparable to the size of the molecule. Here one takes account of the very subtle variations of the field distribution that emerge from the tip metal, and optimize the shape/size/material of the tip as well as the geometric configuration of the molecule surface complex. One thus designs the plasmonic particles and their confined super enhanced fields and hot spots at the sub-nanometer scale and calculate the Raman spectra induced by the field accounting also for the interactions with the substrate environment. Here, one can with advantage apply the Raman theory and code accounting for confined position-dependent electromagnetic fields as derived by Duan et al.231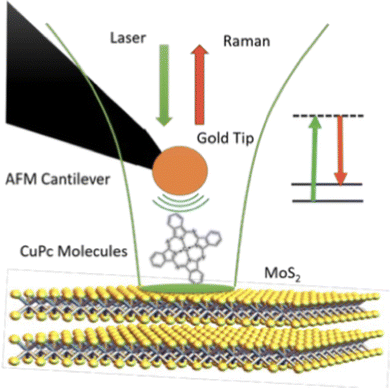 | ||
| Fig. 34 Schematic overview of TERS. From ref. 230. | ||
6.5 Plasmonic cascading
Plasmonic cascading is a concept that offers new opportunities in nanophotonics like in the area of IR solar cell harvesting and photodetection at the ultrasmall nanoscale. An example is to combine plasmonics with upconversion and microlens technologies232 – either plasmonically enhanced fields by nanoparticles or by nanohole perforated thin films.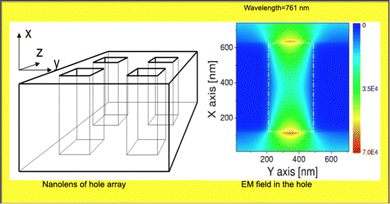 | ||
| Fig. 35 (left) Thin film with holes working as a nanolens. (right) The enhanced electric field at the top and bottom of a hole. Courtesy Dr Ying Fu. | ||
In order to shed light on the issue for super transmission through hole perforated thin films, and in order to design nanodevices of applicable value, one can here consider the emergence of plasmon excitations in these systems when the dimensions are small and thus when the dimensions of films and holes go below the limit where classical dielectric descriptions do not apply. In this limit, an atomic scale interaction model is called for, thus suitable for our unique Ex-DIM code. The wave propagation in these perforated nanohole systems can so be optimized both for material and geometric configurations of the thin film. Here one can aim to couple these arrays with microlens upconversion technology, to obtain a super concentrated upconversion, leading to a proof-of-principle that can be used both in photodetectors and for solar cell harvesting.
Another, related, prospect is to use DIM models for designing so-called picocavities – Benz et al. demonstrated236 that individual atomic features inside the gap of plasmonic nano-assemblies can localise light to volumes well below 1 nm3, enabling optical experiments on the atomic scale, and could show that such atomic features can be dynamically formed and disassembled by laser irradiation. According to the authors, such picocavity formation can access sub-molecular dynamics and open new possibilities for high precision sensors and single-photon strong-optomechanical coupling.
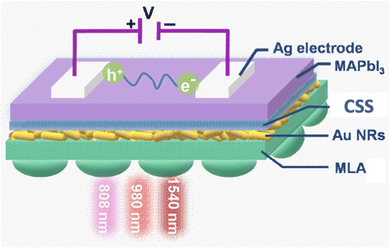 | ||
| Fig. 36 Schematic illustration of a selective multispectral narrowband NIR photodetector at 808 nm, 980 nm and 1540 nm based on a hybrid structure. From ref. 232. | ||
6.6 Optical forces
Optical force or optical force density gives fundamental information on kinetic motion of condensed matter and of various optomechanical phenomena.238–241 Such forces have an impact on solid state systems whenever momentum is transferred from photon to material, like membranes, beams, cantilevers, waveguides, and optical switches. They can be important in general for silicon devices and communication systems. Here, we foresee that classical electro-magnetic theory can with advantage be joined with the Ex-DIM model to explore the action of optical forces at the very nano scale where the concept of a homogenized dielectric constant is no longer valid.6.7 Plasmonic waveguides
Because of the high confinement of electromagnetic energy, propagating surface plasmon polaritons (SPPs) have been considered to represent one of the best potential ways to construct next-generation ultra-small circuits that use light to overcome the limits of speed and energy consumption in electronics(Fig. 37).242,243 Being fabricated at the nanoscale they can be superior to chains of all-dielectric particles, which have a much larger cross-sectional size and approach the size of a conventional optical fiber. By means of ultra-fine plasmonic particles, designed by Ex-DIM, it may be possible to significantly increase the transmission coefficient of the chains of particles by putting them as close to each other as possible. In this case, the excitation and transfer interactions of at least a few higher-order multipoles, which rapidly attenuate with distance from the particle, should be taken into account, something that earlier often has been neglected using the simplified dipole models. Here, multipole decomposition could be derived directly from the Ex-DIM model. The optical properties of the waveguide, including the dielectric permittivity of the nanoparticle material, are obtained from the solution of a self-consistent equation. As a complement, the optical properties of a plasmonic waveguide can then be obtained using the generalized multi-particle Mie theory207 for spherical particles or the finite difference time domain method as well as COMSOL Multiphysics for the particles of arbitrary shape.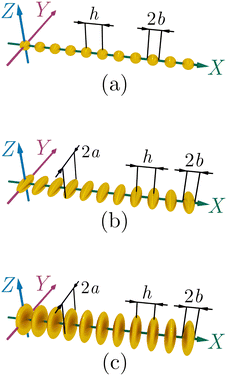 | ||
| Fig. 37 Schematic representation of chained plasmonic nanoparticle waveguides consisting of (a) spheres, (b) prolate spheroids, and (c) oblate spheroids. From ref. 244. | ||
These are only a few highlighted examples out of many possible, that illustrate the great potential of discrete interactions models and their extensions for future collaborative studies with experiments and with wide ramifications in a diverse set of application fields.
Data availability
No new data were created or analysed during this study except for Fig. 32. Since similar data are shown in Fig. 15, 16, 18, 19, 25 and 27 the data for Fig. 32 are not publicly available.Conflicts of interest
There are no conflicts of interest to declare.Acknowledgements
We acknowledge the collaboration in earlier plasmonic studies, in particular with Vadim Zakomrnyi, Zilvinas Rinkevicius, Glib Baryshnikov, Alexander Ershov, Susanna Monti, Anton D. Utyushev, Daniil E. Khrennikov, Sergey P. Polyutov, Ilia L. Rasskazov, P. Scott Carney. H. Å. acknowledges the support from the Swedish Science Research Council on contract 2022-03405 and Lasse Jensen for instructive discussions. S. K. a acknowledges that the study in Section 4.5 was carried out under the state assignment of Kirensky Institute of Physics, and that the study in Section 4.7 was funded by the Ministry of Science and High Education of Russian Federation, Project No. FSRZ-2023-0006. The computations were enabled by resources provided by the National Academic Infrastructure for Supercomputing in Sweden (NAISS) partially funded by the Swedish Research Council through grant agreement no. 2023/3-40.Notes and references
- S. M. Morton, D. W. Silverstein and L. Jensen, Chem. Rev., 2011, 111, 3962–3994 CrossRef CAS PubMed.
- L. M. Liz-Marzán, C. Murphy and J. Wang, Chem. Soc. Rev., 2014, 43, 3820–38222 RSC.
- S. Maier, Plasmonics: Fundamentals and Applications, Springer, New York, NY, 2007 Search PubMed.
- M. E. Stewart, C. R. Anderton, L. B. Thompson, J. Maria, S. K. Gray, J. A. Rogers and R. G. Nuzzo, Chem. Rev., 2008, 108, 494–521 CrossRef CAS PubMed.
- N. Jiang, X. Zhuo and J. Wang, Chem. Rev., 2018, 118, 3054–3099 CrossRef CAS PubMed.
- G. Shvets and I. Tsukerman, Plasmonics and plasmonic metamaterials: Analysis and applications, World Scientific, 2012, vol. 4 Search PubMed.
- R. M. Stöckle, Y. D. Suh, V. Deckert and R. Zenobi, Chem. Phys. Lett., 2000, 318, 131–136 CrossRef.
- S. Duan, G. Tian, Y. Ji, J. Shao, Z. Dong and Y. Luo, J. Am. Chem. Soc., 2015, 137, 9515–9518 CrossRef CAS PubMed.
- G. Sun and J. Khurgin, Plasmonics and Plasmonic Metamaterials, 2011 Search PubMed.
- R. B. Schasfoort, Handbook of surface plasmon resonance, Royal Society of Chemistry, 2017 Search PubMed.
- V. Amendola, R. Pilot, M. Frasconi, O. M. Maragò and M. A. Iat, J. Phys.: Condens. Matter, 2017, 29, 203002 CrossRef PubMed.
- M. I. Stockman, Opt. Express, 2011, 19, 22029–22106 CrossRef PubMed.
- C. David and F. J. G. de Abajo, J. Phys. Chem. C, 2011, 115, 19470–19475 CrossRef CAS.
- A. S. Thakor, J. Jokerst, C. Zavaleta, T. F. Massoud and S. S. Gambhir, Nano Lett., 2011, 11, 4029–4036 CrossRef CAS PubMed.
- X. Huang, P. K. Jain, I. H. El-Sayed and M. A. El-Sayed, Nanomedicine, 2007, 2, 681–693 CrossRef CAS PubMed.
- J. R. Navarro, F. Lerouge, C. Cepraga, G. Micouin, A. Favier, D. Chateau, M.-T. Charreyre, P.-H. Lanoë, C. Monnereau, F. Chaput, S. Marotte, Y. Leverrier, J. Marvel, K. Kamada, C. Andraud, P. L. Baldeck and S. Parola, Biomaterials, 2013, 34, 8344–8351 CrossRef CAS PubMed.
- O. Glembocki, S. Prokes, H. Szmacinski, J. Liu, F. Kub and C. Kub, Nanosensing: Materials and Devices II, 2005, p. 600809 Search PubMed.
- M. E. Stewart, C. R. Anderton, L. B. Thompson, J. Maria, S. K. Gray, J. A. Rogers and R. G. Nuzzo, Chem. Rev., 2008, 108, 494–521 CrossRef CAS PubMed.
- P. Anger, P. Bharadwaj and L. Novotny, Phys. Rev. Lett., 2006, 96, 113002 CrossRef PubMed.
- B. Saute and R. Narayanan, Analyst, 2011, 136, 527–532 RSC.
- E. C. L. Ru, J. Grand, I. Sow, W. R. C. Somerville, P. G. Etchegoin, M. Treguer-Delapierre, G. Charron, N. Félidj, G. Lévi and J. Aubard, Nano Lett., 2011, 11, 5013–5019 CrossRef PubMed.
- A. S. Kostyukov, A. E. Ershov, V. S. Gerasimov, S. A. Filimonov, I. L. Rasskazov and S. V. Karpov, J. Quant. Spectrosc. Radiat. Transfer, 2019, 236, 106599 CrossRef CAS.
- L. H. Madkour, Pharm. Pharmacol. Int. J., 2018, 6, 157–174 Search PubMed.
- E. Y. Lukianova-Hleb, X. Ren, R. R. Sawant, X. Wu, V. P. Torchilin and D. O. Lapotko, Nat. Med., 2014, 20, 778–784 CrossRef CAS PubMed.
- A. S. Kostyukov, I. L. Isaev, A. Ershov, V. Gerasimov, S. Polyutov and S. V. Karpov, J. Phys. D: Appl. Phys., 2022, 55, 175401 CrossRef.
- A. S. Kostyukov, I. L. Isaev, A. Ershov, V. Gerasimov, S. P. Polyutov and S. V. Karpov, J. Phys. D: Appl. Phys., 2022, 55, 175402 CrossRef.
- N. J. Halas, Proc. Natl. Acad. Sci. U. S. A., 2019, 116, 13724–13726 CrossRef CAS PubMed.
- S. Linic, P. Christopher and D. B. Ingram, Nat. Mater., 2011, 10, 911–921 CrossRef CAS PubMed.
- C. Dhand, N. Dwivedi, X. J. Loh, A. N. J. Ying, N. K. Verma, R. W. Beuerman, R. Lakshminarayanan and S. Ramakrishna, RSC Adv., 2015, 5, 105003–105037 RSC.
- G. Yang, Prog. Mater. Sci., 2007, 52, 648–698 CrossRef CAS.
- P. Lorazo, L. J. Lewis and M. Meunier, Phys. Rev. Lett., 2003, 91, 225502 CrossRef PubMed.
- T. Tsuji, D.-H. Thang, Y. Okazaki, M. Nakanishi, Y. Tsuboi and M. Tsuji, Appl. Surf. Sci., 2008, 254, 5224–5230 CrossRef CAS.
- T. Tsuji, Y. Okazaki, Y. Tsuboi and M. Tsuji, Jpn. J. Appl. Phys., 2007, 46, 1533–1535 CrossRef CAS.
- B. M. DeVetter, B. E. Bernacki, W. D. Bennett, A. Schemer-Kohrn and K. J. Alvine, JoVE, 2017, e56204 Search PubMed.
- B. J. Y. Tan, C. H. Sow, T. S. Koh, K. C. Chin, A. T. S. Wee and C. K. Ong, J. Phys. Chem. B, 2005, 109, 11100–11109 CrossRef CAS PubMed.
- D. Brodoceanu, C. Fang, N. H. Voelcker, C. T. Bauer, A. Wonn, E. Kroner, E. Arzt and T. Kraus, Nanotechnology, 2013, 24, 085304 CrossRef CAS PubMed.
- C.-W. Kuo, J.-Y. Shiu, Y.-H. Cho and P. Chen, Adv. Mater., 2003, 15, 1065–1068 CrossRef CAS.
- K. Loza, M. Heggen and M. Epple, Adv. Funct. Mater., 2020, 30, 1909260 CrossRef CAS.
- L. K. Sørensen, A. D. Utyushev, V. I. Zakomirnyi and H. Ågren, Phys. Chem. Chem. Phys., 2021, 1, 173–185 RSC.
- L. S. Slaughter, W.-S. Chang, P. Swanglap, A. Tcherniak, B. P. Khanal, E. R. Zubarev and S. Link, J. Phys. Chem. C, 2010, 114, 4934–4938 CrossRef CAS.
- D. Chateau, A. Liotta, F. Vadcard, J. R. G. Navarro, F. Chaput, J. Lermé, F. Lerouge and S. Parola, Nanoscale, 2015, 7, 1934–1943 RSC.
- D. Château, S. David, G. Berginc, C. Lopes, F. Chaput, F. Lerouge, A. Désert, C. Andraud and S. Parola, ACS Appl. Nano Mater., 2022, 5, 3773–3780 CrossRef.
- B. Yang, G. Chen, A. Ghafoor, Y. Zhang, Y. Zhang, Y. Zhang, Y. Luo, J. Yang, V. Sandoghdar, J. Aizpurua, Z. Dong and J. G. Hou, Nat. Photonics, 2020, 14, 693–699 CrossRef CAS.
- G. Mie, Ann. Phys., 1908, 330, 377–445 CrossRef.
- B. T. Draine and P. J. Flatau, J. Opt. Soc. Am. A, 1994, 11, 1491 CrossRef.
- P. Waterman, Proc. IEEE, 1965, 53, 805–812 Search PubMed.
- Lumerical Solutions, “FDTD Solutions”, 2020, https://www.lumerical.com/tcad-products/fdtd/.
- COMSOL Multiphysics, 2015 Search PubMed.
- J. Hesthaven and T. Warburton, Algorithms, Analysis, and Applications, Springer, Berlin, 2007 Search PubMed.
- P. Drude, Ann. Phys., 1900, 306, 566–613 CrossRef.
- W. Zhu, R. Esteban, A. G. Borisov, J. J. Baumberg, P. Nordlander, H. J. Lezec, J. Aizpurua and K. B. Crozier, Nat. Commun., 2016, 7, 1–14 Search PubMed.
- N. A. Mortensen, P. A. D. Gonçalves, F. A. Shuklin, J. D. Cox, C. Tserkezis, M. Ichikawa and C. Wolff, Nanophotonics, 2021, 10, 3647–3657 CrossRef.
- P. E. Stamatopoulou and C. Tserkezis, Opt. Mater. Express, 2022, 12, 1869 CrossRef.
- S. Palomba, L. Novotnyb and R. Palmer, Opt. Commun., 2008, 281, 480–483 CrossRef CAS.
- A. Boardman, Electromagnetic Surface Modes, John Wiley & Sons Ltd, 1982 Search PubMed.
- N. Mortensen, S. Raza, M. Wubs, T. Sondergaard and S. Bozhev, Nat. Commun., 2014, 5, 3809 CrossRef CAS PubMed.
- W. P. Halperin, Rev. Mod. Phys., 1986, 58, 533–606 CrossRef CAS.
- E. D. Palik, Handbook of optical constants of solids, Academic Press, 1998 Search PubMed.
- S. Grimme, J. Antony, S. Ehrlich and H. Krieg, J. Chem. Phys., 2010, 132, 154104 CrossRef PubMed.
- L. L. Zhao, L. Jensen and G. C. Schatz, J. Am. Chem. Soc., 2006, 128, 2911–2919 CrossRef CAS PubMed.
- H.-C. Weissker and X. Chitl Ló Pez-Lozano, Phys. Chem. Chem. Phys., 2015, 17, 28379–28386 RSC.
- M. Stener, A. Nardelli, R. De Francesco and G. Fronzoni, J. Phys. Chem. C, 2007, 111, 11862–11871 CrossRef CAS.
- J. Stanton and R. Bartlett, J. Chem. Phys., 1993, 98, 7029–7039 CrossRef CAS.
- E. Salpeter and H. Bethe, Phys. Rev., 1951, 84, 1232 CrossRef.
- E. Runge and E. Gross, Phys. Rev. Lett., 1984, 52, 997 CrossRef CAS.
- P. Salek, O. Vahtras, T. Helgaker and H. Ågren, J. Chem. Phys., 2002, 17, 9630 CrossRef.
- F. Della Sala, R. Pachter and M. Sukharev, J. Chem. Phys., 2022, 157, 1–7 Search PubMed.
- F. Della Sala, J. Chem. Phys., 2022, 157, 104101 CrossRef PubMed.
- T. Giovannini, L. Bonatti, P. Lafiosca, L. Nicoli, M. Castagnola, P. G. Illobre, S. Corni and C. Cappelli, ACS Photonics, 2022, 9, 3025–3034 CrossRef CAS PubMed.
- D. Beck, Phys. Rev. B: Condens. Matter Mater. Phys., 1984, 30, 6935 CrossRef CAS.
- D. V. Chulhai and L. Jensen, J. Phys. Chem. A, 2014, 118, 9069–9079 CrossRef CAS PubMed.
- D. V. Chulhai and L. Jensen, J. Phys. Chem. A, 2015, 119, 5218–5223 CrossRef CAS PubMed.
- Z. Hu, D. V. Chulhai and L. Jensen, J. Chem. Theory Comput., 2016, 12, 5968–5978 CrossRef CAS PubMed.
- Z. Hu and L. Jensen, J. Chem. Theory Comput., 2018, 14, 5896–5903 CrossRef CAS PubMed.
- V. I. Zakomirnyi, Z. Rinkevicius, G. V. Baryshnikov, L. K. Sørensen and H. Ågren, J. Phys. Chem. C, 2019, 123, 28867–28880 CrossRef CAS.
- T. Giovannini, M. Rosa, S. Corni and C. Cappelli, Nanoscale, 2019, 11, 6004–6015 RSC.
- P. Lafiosca, T. Giovannini, M. Benzi and C. Cappelli, J. Phys. Chem. C, 2021, 125, 23848–23863 CrossRef CAS PubMed.
- S. Morton and L. Jensen, J. Chem. Phys., 2010, 133, 15697–15703 CrossRef PubMed.
- S. Morton and L. Jensen, J. Chem. Phys., 2011, 135, 134103 CrossRef PubMed.
- J. L. Payton, S. M. Morton, J. E. Moore and L. Jensen, J. Chem. Phys., 2012, 136, 214103 CrossRef PubMed.
- J. L. Payton, S. M. Morton, J. E. Moore and L. Jensen, Acc. Chem. Res., 2014, 47, 88–99 CrossRef CAS PubMed.
- X. Chen, J. E. Moore, M. Zekarias and L. Jensen, Acc. Chem. Res., 2015, 6, 8921 CAS.
- L. Nicoli, P. Lafiosca, P. Grobas Illobre, L. Bonatti, T. Giovannini and C. Cappelli, Front. Photonics, 2023, 4, 1199598 CrossRef.
- F. Gray, Phys. Rev., 1916, 7, 472–488 CrossRef CAS.
- R. R. Birge, J. Chem. Phys., 1980, 72, 5312–5319 CrossRef CAS.
- B. Thole, Chem. Phys., 1981, 59, 341–350 CrossRef CAS.
- L. Jensen, P.-O. Åstrand, K. O. Sylvester-Hvid and K. V. Mikkelsen, J. Phys. Chem. A, 2000, 104, 1563–1569 CrossRef CAS.
- L. Jensen, O. H. Schmidt, K. V. Mikkelsen and P.-O. Åstrand, J. Phys. Chem. B, 2000, 104, 10462–10466 CrossRef CAS.
- L. L. Jensen and L. Jensen, J. Phys. Chem. C, 2008, 112, 15697–15703 CrossRef CAS.
- P. Pyykkö and M. Atsumi, Chem. – Eur. J., 2009, 15, 186–197 CrossRef PubMed.
- X. Chen, J. E. Moore, M. Zekarias and L. Jensen, Nat. Commun., 2015, 6, 8921 CrossRef CAS PubMed.
- L. Jensen, P.-O. Åstrand and K. V. Mikkelsen, J. Comput. Theor. Nanosci., 2009, 6, 270–291 CrossRef CAS.
- A. D. Buckingham, Permanent and Induced Molecular Moments and Long-Range Intermolecular Forces, John Wiley & Sons, Ltd, 1967, pp. 107–142 Search PubMed.
- L. L. Jensen and L. Jensen, J. Phys. Chem. C, 2009, 113, 15182–15190 CrossRef CAS.
- X. Chen, J. E. Moore, M. Zekarias and L. Jensen, Nat. Commun., 2015, 6, 8921 CrossRef CAS PubMed.
- B. Shanker and J. Applequist, J. Chem. Phys., 1996, 104, 6109–6116 CrossRef CAS.
- M. L. Olson and K. R. Sundberg, J. Chem. Phys., 1978, 69, 5400–5404 CrossRef CAS.
- Z. Rinkevicius, M. Kaminskas, P. Palevičius, M. Ragulskis, K. Bočkutė, M. Sriubas and G. Laukaitis, Phys. Chem. Chem. Phys., 2022, 24, 27731–27741 RSC.
- A. H. Baker, E. R. Jessup and T. Manteuffel, SIAM J. Matrix Anal. Appl., 2005, 26, 962–984 CrossRef.
- L. Silberstein, London, Edinburgh Dublin Philos. Mag. J. Sci., 1917, 33, 521–533 CrossRef CAS.
- P. T. van Duijnen and M. Swart, J. Phys. Chem. A, 1998, 102, 2399–2407 CrossRef CAS.
- S. Luo, R. P. Misra and D. Blankschtein, ACS Nano, 2024, 18(2), 1629–1646 CrossRef CAS PubMed.
- E. D. Larsson, P. Reinholdt, E. D. Hedegård and J. Kongsted, J. Phys. Chem. B, 2023, 127, 9905–9914 CrossRef CAS PubMed.
- J. M. Litman, C. Liu and P. Ren, J. Chem. Inf. Model., 2022, 62, 79–87 CrossRef CAS PubMed.
- C. Feng, J. Xi, Y. Zhang, B. Jiang and Y. Zhou, J. Chem. Theory Comput., 2023, 19, 1207–1217 CrossRef CAS PubMed.
- A. Mayer, Phys. Rev. B: Condens. Matter Mater. Phys., 2005, 71, 235333 CrossRef.
- A. Mayer, Phys. Rev. B: Condens. Matter Mater. Phys., 2007, 75, 045407 CrossRef.
- S. Zhao, H. Wei, P. Cieplak, Y. Duan and R. Luo, J. Chem. Theory Comput., 2022, 18, 3654–3670 CrossRef CAS PubMed.
- N. Legenski, C. Zhou, Q. Zhang, B. Han, J. Wu, L. Chen, H. Cheng and R. C. Forrey, J. Comput. Chem., 2011, 32, 1711–1720 CrossRef CAS PubMed.
- H. DeVoe, J. Chem. Phys., 1964, 41, 393–400 CrossRef CAS.
- H. DeVoe, J. Chem. Phys., 1965, 43, 3199–3208 CrossRef CAS.
- E. M. Purcell and C. R. Pennypacker, Astrophys. J., 1973, 186, 705 CrossRef.
- M. A. Yurkin, Discrete dipole approximation, Elsevier, 2023, pp. 167–198 Search PubMed.
- J. I. Rodríguez, J. Autschbach, F. L. Castillo-Alvarado and M. I. Baltazar-Méndez, J. Chem. Phys., 2011, 135, 034109 CrossRef PubMed.
- J. I. Rodríguez, M. I. Baltazar-Méndez, J. Autschbach and F. L. Castillo-Alvarado, Eur. Phys. J. D, 2013, 67, 109 CrossRef.
- J. Dong, W. Zhang and L. Liu, Opt. Express, 2021, 29, 7690–7705 CrossRef PubMed.
- E. Ringe, M. R. Langille, K. Sohn, J. Zhang, J. Huang, C. A. Mirkin, R. P. Van Duyne and L. D. Marks, J. Phys. Chem. Lett., 2012, 3, 1479–1483 CrossRef CAS PubMed.
- U. Kreibig and M. Vollmer, Optical Properties of Metal Clusters, Springer Berlin Heidelberg, Berlin, Heidelberg, 1995, vol. 25 Search PubMed.
- J. Tiggesbäumker, L. Köller, K.-H. Meiwes-Broer and A. Liebsch, Phys. Rev. A: At., Mol., Opt. Phys., 1993, 48, R1749–R1752 CrossRef PubMed.
- N. G. Bastús, J. Comenge and V. Puntes, Langmuir, 2011, 27, 11098–11105 CrossRef PubMed.
- J. Piella, N. G. Bastús and V. Puntes, Chem. Mater., 2016, 28, 1066–1075 CrossRef CAS.
- S. Link and M. A. El-Sayed, J. Phys. Chem. B, 1999, 103, 4212–4217 CrossRef CAS.
- J. A. Scholl, A. L. Koh and J. A. Dionne, Nature, 2012, 483, 421–427 CrossRef CAS PubMed.
- L. K. Sørensen, D. E. Khrennikov, V. S. Gerasimov, A. E. Ershov, S. P. Polyutov, S. V. Karpov and H. Ågren, Phys. Chem. Chem. Phys., 2022, 24, 24062–24075 RSC.
- K. Ujihara, J. Appl. Phys., 1972, 43, 2376–2383 CrossRef CAS.
- A. Ershov, V. Gerasimov, A. Gavrilyuk and S. V. Karpov, Appl. Phys. B: Lasers Opt., 2017, 123, 182 CrossRef.
- F. Font and T. G. Myers, J. Nanopart. Res., 2013, 15, 2086 CrossRef.
- R. Kofman, P. Cheyssac, A. Aouaj, Y. Lereah, G. Deutscher, T. Ben-David, J. Penisson and A. Bourret, Surf. Sci., 1994, 303, 231–246 CrossRef CAS.
- S. Zhu, T. Chen, Y. Liu, Y. Liu and S. Fung, J. Nanopart. Res., 2012, 14, 856 CrossRef.
- S. Karimi, A. Moshaii, S. Abbasian and M. Nikkhah, Plasmonics, 2019, 14, 851 CrossRef CAS.
- S. Babar and J. H. Weaver, Appl. Opt., 2015, 54, 477–481 CrossRef CAS.
- H.-J. Hagemann, W. Gudat and C. Kunz, J. Opt. Soc. Am., 1975, 65, 742–744 CrossRef CAS.
- K. M. McPeak, S. V. Jayanti, S. J. P. Kress, S. Meyer, S. Iotti, A. Rossinelli and D. J. Norris, ACS Photonics, 2015, 2, 326–333 CrossRef CAS PubMed.
- P. B. Johnson and R. W. Christy, Phys. Rev. B: Condens. Matter Mater. Phys., 1972, 6, 4370–4379 CrossRef CAS.
- W. Haiss, N. T. K. Thanh, J. Aveyard and D. G. Fernig, Anal. Chem., 2007, 79, 4215–4221 CrossRef CAS PubMed.
- L. S. Slaughter, W.-S. Chang, P. Swanglap, A. Tcherniak, B. P. Khanal, E. R. Zubarev and S. Link, J. Phys. Chem. C, 2010, 114, 4934–4938 CrossRef CAS.
- Gold nanorods spr vs. aspect ratio, https://www.nanopartz.com/gold-nanoparticles-properties-nanorods-spr-aspect-ratio.asp.
- O. Pena-Rodríguez, P. Diaz-Nunez, G. Gonzalez-Rubio, V. Manzaneda-Gonzalez, A. Rivera, J. M. Perlado, E. Junquera and A. Guerrero-Martínez, Sci. Rep., 2020, 10, 5921 CrossRef PubMed.
- A. Jakab, C. Rosman, Y. Khalavka, J. Becker, A. Trügler, U. Hohenester and C. Sönnichsen, ACS Nano, 2011, 5, 6880–6885 CrossRef CAS PubMed.
- A. L. González, C. Noguez, J. Beránek and A. S. Barnard, J. Phys. Chem. C, 2014, 118, 9128–9136 CrossRef.
- D. C. Tzarouchis, P. Ylä-Oijala, T. Ala-Nissila and A. Sihvola, Appl. Phys. A: Solids Surf., 2016, 122, 298 CrossRef.
- A. A. Ashkarran and A. Bayat, Int. Nano Lett., 2013, 3, 50 CrossRef.
- V. I. Zakomirnyi, I. L. Rasskazov, L. K. Sørensen, P. S. Carney, Z. Rinkevicius and H. Ågren, Phys. Chem. Chem. Phys., 2020, 22, 13467–13473 RSC.
- G. Mukhopadhyay and S. Lundqvist, Il Nuovo Cimento B, 1975, 27, 1–18 CrossRef.
- G. Mukhopadhyay and S. Lundqvist, J. Phys. B, 1979, 12, 1297–1304 CrossRef CAS.
- E. Prodan and P. Nordlander, Nano Lett., 2003, 3, 543–547 CrossRef CAS.
- E. Prodan, C. Radloff, N. Halas and P. Nordlander, Science, 2003, 302, 419–422 CrossRef CAS PubMed.
- N. G. Khlebtsov, L. A. Dykman and B. N. Khlebtsov, Russ. Chem. Rev., 2022, 91, 2–29 CrossRef.
- L. K. Sørensen, A. D. Utyushev, V. I. Zakomirnyi and H. Ågren, Phys. Chem. Chem. Phys., 2021, 23, 173–185 RSC.
- L. Vegard, Z. Physik, 1921, 5, 17–26 CrossRef CAS.
- A. R. Denton and N. W. Ashcroft, Phys. Rev. A: At., Mol., Opt. Phys., 1991, 43, 3161–3164 CrossRef CAS PubMed.
- L. K. Sørensen, A. D. Utyushev, V. I. Zakomirnyi, V. S. Gerasimov, A. E. Ershov, S. P. Polyutov, S. V. Karpov and H. Ågren, J. Phys. Chem. C, 2021, 125, 13900–13908 CrossRef.
- G. J. Lee, J. J. Kim, C. K. Hwangbo, J. Kim, I. Park and Y. P. Lee, J. Nanosci. Nanotechnol., 2013, 13, 568–571 CrossRef CAS PubMed.
- A. Mary, D. Koller, A. Hohenau, J. Krenn, A. Bouhelier and A. Dereux, Phys. Rev. B: Condens. Matter Mater. Phys., 2007, 76, 245422 CrossRef.
- J. Aizpurua, P. Hanarp, D. S. Sutherland, M. Käll, G. W. Bryant and F. J. García de Abajo, Phys. Rev. Lett., 2003, 90, 057401 CrossRef CAS PubMed.
- N. K. Geitner, A. Doepke, M. A. Fickenscher, J. M. Yarrison-Rice, W. R. Heineman, H. E. Jackson and L. M. Smith, Nanotechnology, 2011, 22, 275607 CrossRef CAS PubMed.
- S. Ye, G. Marston, J. R. McLaughlan, D. O. Sigle, N. Ingram, S. Freear, J. J. Baumberg, R. J. Bushby, A. F. Markham, K. Critchley, P. L. Coletta and S. D. Evans, Adv. Funct. Mater., 2015, 25, 2117–2127 CrossRef CAS.
- Y.-l Liu, J. Zhu, G.-j Weng, J.-j Li and J.-w Zhao, Microchim. Acta, 2020, 187, 1–24 CrossRef PubMed.
- J. Chen, F. Saeki, B. J. Wiley, H. Cang, M. J. Cobb, Z.-Y. Li, L. Au, H. Zhang, M. B. Kimmey, X. Li and Y. Xia, Nano Lett., 2005, 5, 473–477 CrossRef CAS PubMed.
- L. K. Sørensen, D. E. Khrennikov, V. S. Gerasimov, A. E. Ershov, S. P. Polyutov, S. V. Karpov and H. Ågren, J. Phys. Chem. C, 2022, 126, 16804–16814 CrossRef.
- S. V. Karpov, V. S. Gerasimov, I. L. Isaev and V. A. Markel, Phys. Rev. B: Condens. Matter Mater. Phys., 2005, 72, 205425 CrossRef.
- F. J. G. de Abajo, J. Phys. Chem. C, 2008, 112, 17983–17987 CrossRef.
- W. T. Doyle, J. Opt. Soc. Am. A, 1985, 2, 1031 CrossRef CAS.
- V. Klimov, Nanoplasmonics, Jenny Stanford Publishing, 2014 Search PubMed.
- M. M. Miller and A. A. Lazarides, J. Phys. Chem., 2003, 109, 21556–21565 CrossRef PubMed.
- M. M. Miller and A. A. Lazarides, SPIE Proc., 2005, 5927, 59270D CrossRef.
- T. Jensen, M. Malinsky and C. H. R. van Duyne, J. Phys. Chem. B, 2000, 104, 10549–10556 CrossRef CAS.
- M. D. Malinsky, K. L. Kelly, G. C. Schatz and R. P. V. Duyne, J. Am. Chem. Soc., 2001, 123, 1471–1482 CrossRef CAS.
- N. Nath and A. Chilkoti, Anal. Chem., 2001, 74, 504–509 CrossRef PubMed.
- A. J. Haes, S. Zou, G. C. Schatz and R. P. V. Duyne, J. Phys. Chem. B, 2004, 108, 6961–6968 CrossRef CAS.
- A. Gole and C. J. Murphy, Chem. Mater., 2005, 17, 1325–1330 CrossRef CAS.
- N. G. Khlebtsov, L. A. Trachuk and A. G. Mel'nikov, Opt. Spectrosc., 2005, 98, 77–83 CrossRef CAS.
- M. K. Hongxing Xu, Sens. Actuators, B, 2002, 87, 244–249 CrossRef.
- B. N. Khlebtsov and N. G. Khlebtsov, J. Quant. Spectrosc. Radiat. Transfer, 2007, 106, 154–169 CrossRef CAS.
- M. A. Garcia, J. Phys. D: Appl. Phys., 2011, 44, 283001 CrossRef.
- F. Qin, X. Cui, Q. Ruan, Y. Lai, J. Wang, H. Ma and H. Q. Lin, Nanoscale, 2016, 8, 17645 RSC.
- K. L. Kelly, E. Coronado, L. L. Zhao and G. C. Schatz, J. Phys. Chem. B, 2002, 107, 668–677 CrossRef.
- C. Noguez, J. Phys. Chem. C, 2007, 111, 3806–3819 CrossRef CAS.
- J. J. Mock, D. R. Smith and S. Schultz, Nano Lett., 2003, 3, 4 CrossRef.
- H. Chen, X. Kou, Z. Yang, W. Ni and J. Wang, Langmuir, 2008, 24, 5233–5237 CrossRef CAS PubMed.
- A. D. McFarland and R. P. V. Duyne, Nano Lett., 2003, 3, 1057–1062 CrossRef CAS.
- F. Qin, X. Cui, Q. Ruan, Y. Lai, J. Wang, H. Ma and H. Q. Lin, Nanoscale, 2016, 8, 17645 RSC.
- C. Yu, R. Schira, H. Brune, B. von Issendorff, F. Rabilloud and W. Harbich, Nanoscale, 2018, 10, 20821–20827 RSC.
- A. Shafiqa, A. A. Aziz and B. Mehrdel, J. Phys.: Conf. Ser., 2018, 1083, 012040 CrossRef.
- H. B. Jeon, P. V. Tsalu and J. W. Ha, Sci. Rep., 2019, 9, 13635 CrossRef PubMed.
- A. Yuksel, M. Cullinan, E. T. Yu and J. Murthy, J. Quant. Spectrosc. Radiat. Transfer, 2020, 254, 107207 CrossRef CAS.
- N. G. Khlebtsov, L. A. Dykman and B. N. Khlebtsov, Russ. Chem. Rev., 2022, 91, RCR5058 CrossRef.
- N. A. Mortensen, S. Raza, M. Wubs, T. Søndergaard and S. I. Bozhevolnyi, Nat. Commun., 2014, 5, 3809 CrossRef CAS PubMed.
- B. S. Luk'yanchuk, A. E. Miroshnichenko, M. I. Tribelsky, Y. S. Kivshar and A. R. Khokhlov, New J. Phys., 2012, 14, 093022 CrossRef.
- G. Baffou, P. Berto, E. B. Ureña, R. Quidant, S. Monneret, J. Polleux and H. Rigneault, ACS Nano, 2013, 7, 6478–6488 CrossRef CAS PubMed.
- A. D. Phan, T.-L. Phan and L. M. Woods, J. Appl. Phys., 2013, 114, 214306 CrossRef.
- A. P. Gavrilyuk and S. V. Karpov, Appl. Phys. B: Lasers Opt., 2009, 97, 163–173 CrossRef CAS.
- A. Gavrilyuk and S. Karpov, Appl. Phys. B: Lasers Opt., 2011, 102, 65–72 CrossRef CAS.
- A. Ershov, A. Gavrilyuk, S. Karpov and P. Semina, Appl. Phys. B: Lasers Opt., 2014, 115, 547–560 CrossRef CAS.
- A. Alabastri, A. Toma, M. Malerba, F. De Angelis and R. Proietti Zaccaria, ACS Photonics, 2015, 2, 115–120 CrossRef CAS.
- L. K. Sørensen, D. E. Khrennikov, V. S. Gerasimov, A. E. Ershov, M. A. Vysotin, S. Monti, V. I. Zakomirnyi, S. P. Polyutov, H. Ågren and S. V. Karpov, Nanoscale, 2022, 14, 433–447 RSC.
- V. S. Gerasimov, A. E. Ershov, A. P. Gavrilyuk, S. V. Karpov, H. Ågren and S. P. Polyutov, Opt. Express, 2016, 24, 26851 CrossRef CAS PubMed.
- K. Bagi, Computational Modeling of Masonry Structures Using the Discrete Element Method, IGI Global, 2016, pp. 90–102 Search PubMed.
- M. A. Yurkin and A. G. Hoekstra, J. Quant. Spectrosc. Radiat. Transfer, 2011, 112, 2234–2247 CrossRef CAS.
- S. Sukhov, D. Haefner and A. Dogariu, Phys. Rev. E: Stat., Nonlinear, Soft Matter Phys., 2008, 77, 066709 CrossRef CAS PubMed.
- A. Amirjani, P. Z. Abyaneh, P. A. Masouleh and S. K. Sadrnezhaad, Plasmonics, 2022, 17, 1095–1106 CrossRef.
- J. Marcheselli, D. Chateau, F. Lerouge, P. Baldeck, C. Andraud, S. Parola, S. Baroni, S. Corni, M. Garavelli and I. Rivalta, J. Chem. Theory Comput., 2020, 16, 3807–3815 CrossRef CAS PubMed.
- C. E. Hofmann, F. J. García de Abajo and H. A. Atwater, Nano Lett., 2011, 11, 372–376 CrossRef CAS PubMed.
- C. Mystilidis, X. Zheng, A. Xomalis and G. A. E. Vandenbosch, Adv. Theory Simul., 2023, 6, 2200722 CrossRef.
- M. I. Mishchenko, L. D. Travis and D. W. Mackowski, J. Quant. Spectrosc. Radiat. Transfer, 1996, 55, 535–575 CrossRef CAS.
- M. I. Mishchenko, L. D. Travis and D. W. Mackowski, J. Quant. Spectrosc. Radiat. Transfer, 2010, 111, 1700–1703 CrossRef CAS.
- Y.-l Xu, Appl. Opt., 1995, 34, 4573 CrossRef CAS PubMed.
- Y.-L. Xu and B. A. S. Gustafson, J. Quant. Spectrosc. Radiat. Transfer, 2001, 70, 395–419 CrossRef CAS.
- Y.-L. Xu, Math. Comput., 1996, 65, 1601–1613 CrossRef.
- Y.-L. Xu and B. A. S. Gustafson, J. Quant. Spectrosc. Radiat. Transfer, 2001, 70, 395–419 CrossRef CAS.
- LAMMPS Molecular Dynamics Simulator, 2022, https://www.lammps.sandia.gov.
- J. Banhart, Prog. Mater. Sci., 2001, 46, 559–632 CrossRef CAS.
- G. Huttmann and R. Birngruber, IEEE J. Sel. Top. Quantum Electron., 1999, 5, 954–962 CrossRef CAS.
- G. Baffou, F. Cichos and R. Quidant, Nat. Mater., 2020, 19, 946–958 CrossRef CAS PubMed.
- A. E. Ershov, A. P. Gavrilyuk, S. V. Karpov and P. N. Semina, Appl. Phys. B: Lasers Opt., 2014, 115, 547–560 CrossRef CAS.
- A. E. Ershov, V. S. Gerasimov, I. L. Isaev, A. P. Gavrilyuk and S. V. Karpov, Chin. Phys. B, 2020, 29, 037802 CrossRef CAS.
- A. E. Ershov, V. S. Gerasimov, A. P. Gavrilyuk and S. V. Karpov, Appl. Phys. B: Lasers Opt., 2017, 123, 182 CrossRef.
- N. G. Khlebtsov, L. Lin, B. N. Khlebtsov and J. Ye, Theranostics, 2020, 10, 2067–2094 CrossRef CAS PubMed.
- M. Xu and L. V. Wang, Rev. Sci. Instrum., 2006, 77, 041101 CrossRef.
- D. Razansky, J. Klohs and R. Ni, Eur. J. Nucl. Med. Mol. Imaging, 2021, 48, 4152–4170 CrossRef PubMed.
- Y. Mantri and J. V. Jokerst, ACS Nano, 2020, 14, 9408–9422 CrossRef CAS PubMed.
- N. Murugan, K. Chiotis, E. Rodriguez-Vieitez, L. Lemoine, H. Ågren and A. Nordberg, Eur. J. Nucl. Med. Mol. Imaging, 2019, 46, 1369–1382 CrossRef CAS PubMed.
- G. Kuang, N. A. Murugan, Y. Zhou, A. Nordberg and H. Ågren, ACS Chem. Neurosci., 2020, 11, 900–908 CrossRef CAS PubMed.
- Y. Zhou, G. Kuang, J. Li, C. Halldin, A. Nordberg, B. Långström, Y. Tu and H. Ågren, RSC Adv., 2021, 11, 3942–3951 RSC.
- S. Nie and S. Emory, Science, 1997, 275, 1102–1106 CrossRef CAS PubMed.
- A. Kopwitthaya, K. Yong, A. Kuzmin, W. Law, A. Pliss, L. A. Vathy, I. Roy and P. Prasad, Plasmonics, 2012, 8, 313–318 CrossRef.
- B. N. Khlebtsov, A. M. Burov, S. V. Zarkov and N. G. Khlebtsov, Phys. Chem. Chem. Phys., 2023, 25, 30903–30913 RSC.
- D. Karthigeyan, S. Siddhanta, A. H. Kishore, S. S. R. R. Perumal, H. Ågren, S. Sudevan, A. V. Bhat, K. Balasubramanyam, R. K. Subbegowda, T. K. Kundu and C. Narayana, Proc. Natl. Acad. Sci. U. S. A., 2014, 111, 10416–10421 CrossRef CAS PubMed.
- R. M. Stöckle, Y. D. Suh, V. Deckert and R. Zenobi, Chem. Phys. Lett., 2000, 318, 131–136 CrossRef.
- Z. He, D. V. Voronine, A. M. Sinyukov, Z. N. Liege, B. Birmingham, A. V. Sokolov, Z. Zhang and M. O. Scully, IEEE J. Sel. Top. Quantum Electron., 2017, 23, 113–118 Search PubMed.
- S. Duan, G. Tian, Y. Ji, J. Shao, Z. Dong and Y. Luo, JACS, 2015, 137, 9515–9518 CrossRef CAS PubMed.
- J. Yang, C. Qian, X. Xie, K. Peng, S. Wu, F. Song, S. Sun, J. Dang, Y. Yu, S. Shi, J. He, M. J. Steer, I. G. Thayne, B.-B. Li, F. Bo, Y.-F. Xiao, Z. Zuo, K. Jin, C. Gu and X. Xu, Light: Sci. Appl., 2020, 9, 81 CrossRef PubMed.
- T. Ebbesen, H. Lezec, H. Ghaemi, T. Thio and P. A. Wolff, Nature, 1998, 391, 667–669 CrossRef CAS.
- Z. M. Abd El-Fattah, V. Mkhitaryan, J. Brede, L. Fernandez, C. Li, Q. Guo, A. Ghosh, A. R. Echarri, D. Naveh, F. Xia, J. E. Ortega and F. J. Garcia de Abajo, ACS Nano, 2019, 13, 7771–7779 CrossRef CAS PubMed.
- J. B. Pendry, L. Martn-Moreno and F. J. Garcia-Vidal, Science, 2004, 305, 847–848 CrossRef CAS PubMed.
- F. Benz, M. K. Schmidt, A. Dreismann, R. Chikkaraddy, Y. Zhang, A. Demetriadou, C. Carnegie, H. Ohadi, B. de Nijs, R. Esteban, J. Aizpurua and J. J. Baumberg, Science, 2016, 354, 726 CrossRef CAS PubMed.
- V. I. Zakomirnyi, I. L. Rasskazov, V. S. Gerasimov, A. E. Ershov, S. P. Polyutov, S. V. Karpov and H. Ågren, Photonics Nanostruct., 2018, 30, 50–56 CrossRef.
- L. A. Jakob, W. M. Deacon, Y. Zhang, B. de Nijs, E. Pavlenko, S. Hu, C. Carnegie, T. Neuman, R. Esteban, J. Aizpurua and J. J. Baumberg, Nat. Commun., 2023, 14, 3291 CrossRef CAS PubMed.
- K. J. Webb, Phys. Rev. B, 2022, 106, 155423 CrossRef CAS.
- A. Kostyukov, V. Gerasimov, A. Ershov, E. Bulgakov and A. Sadreev, Opt. Lasers Eng., 2023, 171, 107797 CrossRef.
- A. E. Ershov, A. P. Gavrilyuk, S. V. Karpov and P. N. Semina, Appl. Phys. B: Lasers Opt., 2013, 115, 547–560 CrossRef.
- I. L. Rasskazov, S. V. Karpov and V. A. Markel, Opt. Lett., 2013, 38, 4743–4746 CrossRef CAS PubMed.
- I. L. Rasskazov, S. V. Karpov and V. A. Markel, Phys. Rev. B: Condens. Matter Mater. Phys., 2014, 90, 075405 CrossRef CAS.
- V. I. Zakomirnyi, I. L. Rasskazov, V. S. Gerasimov, A. E. Ershov, S. P. Polyutov, S. V. Karpov and H. Ågren, Photonics Nanostruct., 2018, 30, 50–56 CrossRef.
| This journal is © the Owner Societies 2024 |


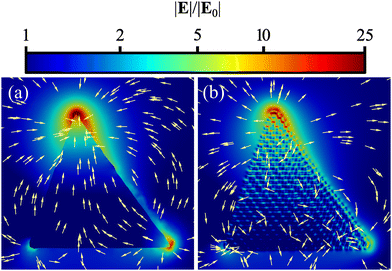
![[thin space (1/6-em)]](https://www.rsc.org/images/entities/char_2009.gif) 000 atoms (normalisation to the incident field strength), calculated with the finite element method (COMSOL) (a) and Ex-DIM (b). Polarisation direction from the top to the middle of the bottom.
000 atoms (normalisation to the incident field strength), calculated with the finite element method (COMSOL) (a) and Ex-DIM (b). Polarisation direction from the top to the middle of the bottom.