Resonant two-photon photoelectron imaging and adiabatic detachment processes from bound vibrational levels of dipole-bound states†
Dao-Fu
Yuan
,
Yue-Rou
Zhang
,
Chen-Hui
Qian
 and
Lai-Sheng
Wang
 *
*
Department of Chemsitry, Brown University, Providence, RI 02912, USA. E-mail: Lai-Sheng_Wang@brown.edu
First published on 20th December 2021
Abstract
Anions cannot have Rydberg states, but anions with polar neutral cores can support highly diffuse dipole-bound states (DBSs) as a class of interesting electronically excited states below the electron detachment threshold. The binding energies of DBSs are extremely small, ranging from a few to few hundred wavenumbers and generally cannot support bound vibrational levels below the detachment threshold. Thus, vibrational excitations in the DBS are usually above the electron detachment threshold and they have been used to conduct resonant photoelectron spectroscopy, which is dominated by state-specific autodetachment. Here we report an investigation of a cryogenically-cooled complex anion, the enantiopure (R)-(−)-1-(9-anthryl)-2,2,2-trifluoroethanolate (R-TFAE−). The neutral R-TFAE radical is relatively complex and highly polar with a non-planar structure (C1 symmetry). Photodetachment spectroscopy reveals a DBS 209 cm−1 below the detachment threshold of R-TFAE− and seven bound and eight above-threshold vibrational levels of the DBS. Resonant two-photon detachment (R2PD) via the bound vibrational levels of the DBS exhibits strictly adiabatic photodetachment behaviors by the second photon, in which the vibrational energies in the DBS are carried to the neutral final states, because of the parallel potential energy surfaces of the DBS and the corresponding neutral ground electronic state. Relaxation processes from the bound DBS levels to the ground and low-lying electronically excited states of R-TFAE− are also observed in the R2PD photoelectron spectra. The combination of photodetachment and resonant photoelectron spectroscopy yields frequencies for eight vibrational modes of the R-TFAE radical.
1. Introduction
Polar neutral molecules with large enough dipole moments (μ > ∼2.5 Debye) can bind an excess electron in a highly diffuse orbital to form dipole-bound anions.1–6 Valence-bound anions with polar neutral cores can have diffuse dipole-bound states as electronically excited states right below the detachment threshold,7–17 analogous to Rydberg states in neutral molecules. Dipole-bound states (DBSs) are supported via the long-range electron–dipole interactions, usually with very small binding energies on the order of a few to a few hundred cm−1. Since first investigated by Fermi and Teller in 1947,18 DBS has attracted continued experimental and theoretical attentions. DBSs may be important in the capture of low energy electrons in radiation damages of biomolecules19–21 and have been proposed as the “doorway” to the formation of valence-bound anions.22–24 DBS also provides an interesting platform to study electron-molecule interactions and nonadiabatic transitions between the DBS and valence-bound states.22–33 The creation of cold anions has allowed the development of resonant photoelectron spectroscopy (rPES) via excitation to specific above-threshold vibrational levels of the DBS.34–36 Recently, excited π type DBSs have been observed37,38 and the autodetachment lifetimes of DBSs have been directly measured.39Since the diffuse dipole-bound electron has little influence on the geometry of the polar neutral core, DBSs have parallel potential energy surfaces and thus identical vibrational frequencies with the corresponding neutral core. Under the Franck–Condon (FC) approximation, photodetachment of the dipole-bound electron should be adiabatic, with no change to the quantum states of the corresponding neutral core. Such adiabatic processes have been inferred in photoionization from Rydberg states40 and observed in resonant two-photon detachment (R2PD) photoelectron spectroscopy (PES) from bound vibrational levels of DBSs.32,41 Owing to their small binding energies, generally very few bound vibrational states can exist for DBSs below the detachment threshold. Hence, the adiabatic detachment behaviors of the dipole-bound electron in excited vibrational levels of DBSs are rarely studied systematically. Such studies require systems with large DBS binding energies or more complex molecules with low frequency vibrational modes so that there would be copious bound vibrational states below the detachment threshold. Vibrationally-cold anions and high spectral resolution would also be necessary to enable such vibrational state-specific experiments.
Electrospray ionization (ESI) is a powerful soft ionization method that transports solution ions into the gas phase,42 in particular biological molecules.43 The Wang group introduced the ESI technique into spectroscopy to investigate the properties of free multiply-charged anions,44,45 solution-phase chemistry in the gas phase,46,47 and the electronic structure of biologically-relevant molecules.48 A second-generation ESI-PES apparatus was developed by coupling a cryogenically-cooled Paul trap with an ESI source and a magnetic-bottle photoelectron analyzer,49 which eliminated vibrational hot bands of anions and improved the spectral resolution.50 The third-generation ESI-PES apparatus combining a high-resolution photoelectron imaging (PEI) system and the cryogenically-cooled Paul trap has dramatically improved the PES resolution and fully realized the spectroscopic potential of cold anions.15,34,51 With a tunable detachment laser system, the third-generation ESI-PES apparatus is particularly suitable to study DBSs via photodetachment spectroscopy (PDS), R2PD, and rPES and has dramatically expanded our capabilities to probe the vibronic structures and obtain spectroscopic information for various molecular systems.38,52–54
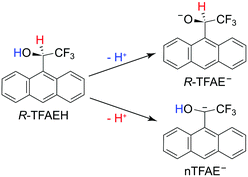
In the current article, we report an investigation of a relatively complex anion, the chiral (R)-(−)-1-(9-anthryl)-2,2,2-trifluoroethanolate (R-TFAE−) (see Fig. 1). Enantiomers of 1-(9-anthryl)-2,2,2-trifluoroethanol (TFAEH) are chiral NMR solvating agents, which have been separated by a variety of chromatographic techniques and have become reference compounds for testing new optically active selectors.55 TFAE− is a complicated anion with a non-planar structure (C1 symmetry) including an aromatic anthracenyl ring. The TFAE radical has a dipole moment of 4.1 D, much larger than the critical value for supporting excited DBSs,56 and it has abundant low-frequency vibrational modes (<100 cm−1), making it possible for many bound DBS vibrational levels below the detachment threshold. Therefore, TFAE− should be a promising system to study the adiabatic detachment behaviours from the DBS. Enantiopure TFAE− anions may also allow photoelectron circular dichroism experiments,57–59 but the current study focuses on its spectroscopy and DBS. The electron affinity (EA) of the R-TFAE radical is determined accurately to be 20![[thin space (1/6-em)]](https://www.rsc.org/images/entities/char_2009.gif) 353 ± 2 cm−1 (2.5234 ± 0.0002 eV). A DBS is indeed observed 209 cm−1 below the detachment threshold of R-TFAE−. Fifteen vibrational levels are observed for the DBS, including seven bound vibrational levels and eight above-threshold levels (vibrational Feshbach resonances). Strict adiabatic detachment behaviours are observed for the detachment of the dipole-bound electron from the seven bound vibrational levels using R2PD, while eight resonant photoelectron spectra are obtained for the eight vibrational Feshbach resonances. Relaxation processes from the bound DBS levels to low-lying valence excited states of R-TFAE− are also observed in the R2PD. Vibrational frequencies for ten vibrational modes of R-TFAE are obtained from the combination of the non-resonant PES, PDS, rPES, and R2PD.
353 ± 2 cm−1 (2.5234 ± 0.0002 eV). A DBS is indeed observed 209 cm−1 below the detachment threshold of R-TFAE−. Fifteen vibrational levels are observed for the DBS, including seven bound vibrational levels and eight above-threshold levels (vibrational Feshbach resonances). Strict adiabatic detachment behaviours are observed for the detachment of the dipole-bound electron from the seven bound vibrational levels using R2PD, while eight resonant photoelectron spectra are obtained for the eight vibrational Feshbach resonances. Relaxation processes from the bound DBS levels to low-lying valence excited states of R-TFAE− are also observed in the R2PD. Vibrational frequencies for ten vibrational modes of R-TFAE are obtained from the combination of the non-resonant PES, PDS, rPES, and R2PD.
2. Methods
The experiment was carried out using our third-generation ESI-PES apparatus,51 consisting of an ESI source,45 cryogenically-controlled Paul trap,49 and a multi-lens PEI system.60 The enantiopure R-TFAEH sample was purchased from Sigma-Aldrich with a specified purity of ≥98% and an enantiomeric excess of ≥97.5%, and used without further purification. The R-TFAE− anions were produced by ESI of a 1 mM solution of R-TFAEH in a mixed solvent of CH3OH/H2O (9/1 volume ratio) at pH ∼ 10. Anions generated in the ESI source were guided into a cryogenically-cooled 3D Paul trap operated at 4.6 K by a set of quadrupole and octupole ion guides.51 After being accumulated for about 0.1 s and thermally cooled via collisions with a 1 mTorr He/H2 (4/1 in volume) background gas,49 the anions were pulsed out of the trap at a repetition rate of 10 Hz, and entered the extraction zone of a time-of-flight (TOF) mass spectrometer. The anions of interest were selected by a mass gate and then photodetached in the interaction zone of the PEI system by a tunable dye laser, which was pumped by the third harmonic of an Nd:YAG laser. The polarization direction of the detachment laser was parallel to the imaging plane. Photoelectrons were projected onto a pair of 75 mm diameter micro-channel plates coupled to a phosphor screen, and captured by a charge-coupled-device camera. Since the 3D distributions of the photoelectrons are circularly symmetric along the polarization direction, the photoelectron images with a slice through the 3D photoelectron distributions were retrieved using pBASEX61 and BASEX.62 It was found that pBASEX gave better images while BASEX was better for the spectra. The photoelectron spectra were calibrated with the known spectra of Au− at different photon energies. The kinetic energy (KE) resolution was 3.8 cm−1 for electrons with 55 cm−1 KE and about 1.5% (ΔKE/KE) for KE above 1 eV in the current experiment.Geometry optimization and ground-state electronic structure calculations were performed using density functional theory (DFT) at the B3LYP/6-311++(d,p) level of theory. The electronic structure calculations were followed by vibrational analyses. Time-dependent DFT (TDDFT) at the B3LYP/6-311++(d,p) level was used to calculate the vertical excitation energies for R-TFAE and R-TFAE− in the equilibrium structures of the corresponding ground electronic states. The geometry optimization and the corresponding adiabatic excitation energy calculation for the first excited state of the R-TFAE radical were performed using the same TDDFT method. All electronic structure calculations were performed using the Gaussian 09 package.63 Franck Condon (FC) factor calculations were carried out using the FC-Lab2.64
3. Results
3.1. Deprotonation of TFAEH
According to the molecular structure of R-TFAEH (Fig. 1), there can be three possible deprotonation sites, i.e., from the hydroxy group, the chiral carbon position, and the aromatic anthracenyl ring (not shown). Generally, the proton acidity of alkane or small polycyclic aromatic hydrocarbons is too weak to be deprotonated during ESI. Because of the strong electron-withdrawing property of the –CF3 group, deprotonation of the chiral carbon atom is still possible for R-TFAEH, which would destroy the chiral centre. The achiral anion is designated as nTFAE− in Fig. 1. The electron affinities (EAs) of the neutral R-TFAE and nTFAE were calculated to be 2.91 and 1.90 eV, respectively. Thus, the chiral R-TFAE− anion is much more stable than nTFAE−, which means that the achiral nTFAE− anion is most likely negligible from the ESI source.3.2. Photoelectron imaging of R-TFAE− at 403.75 nm
Fig. 2 displays the photoelectron image and spectrum of R-TFAE− at 403.75 nm (3.0708 eV). The narrow band in the low binding energy side represents detachment to the ground state of R-TFAE (![[X with combining tilde]](https://www.rsc.org/images/entities/char_0058_0303.gif) ). The broad band above 2.7 eV indicates detachment transition to the first electronically excited state of R-TFAE (Ã). The adiabatic detachment energy (ADE) of band
). The broad band above 2.7 eV indicates detachment transition to the first electronically excited state of R-TFAE (Ã). The adiabatic detachment energy (ADE) of band ![[X with combining tilde]](https://www.rsc.org/images/entities/char_0058_0303.gif) was measured to be 2.52 eV, which gave a rough estimate of the EA for the R-TFAE neutral radical. A much more accurate EA is measured at lower photon energies (vide infra). The calculated Franck–Condon (FC) factors for the ground state detachment transition are presented as vertical lines in Fig. 2 for comparison. Band à shows very broad features from around 2.7 to 3.1 eV (Fig. 2). The ADE of bands à is measured to be 2.72 eV, and the corresponding energy separation (excitation energy) with the ground electronic state is estimated to be 0.20 eV. Because of the small energy separation between the two electronic states, there is some overlap between the high binding energy side of the
was measured to be 2.52 eV, which gave a rough estimate of the EA for the R-TFAE neutral radical. A much more accurate EA is measured at lower photon energies (vide infra). The calculated Franck–Condon (FC) factors for the ground state detachment transition are presented as vertical lines in Fig. 2 for comparison. Band à shows very broad features from around 2.7 to 3.1 eV (Fig. 2). The ADE of bands à is measured to be 2.72 eV, and the corresponding energy separation (excitation energy) with the ground electronic state is estimated to be 0.20 eV. Because of the small energy separation between the two electronic states, there is some overlap between the high binding energy side of the ![[X with combining tilde]](https://www.rsc.org/images/entities/char_0058_0303.gif) band and the à band, as revealed by the FC simulation. In order to confirm the assignment and understand the broad feature of band Ã, the vertical and adiabatic excitation energies of the first excited state of R-TFAE were calculated by the TDDFT method, as summarized in Table S1 (ESI†). The results show that the calculated adiabatic excitation energy (0.32 eV) is consistent with the experimental energy separation. The relatively large difference between the vertical (0.54 eV) and adiabatic excitation energies (0.32 eV) of the first excited state (Table S1, ESI†) indicates that there is a relatively large geometry change between the first excited neutral state and the anion ground state, which is consistent with the very broad structure of band à in Fig. 2. The good agreement between the theoretical results and the experimental observations supported that the chiral R-TFAE− was indeed the observed anion.
band and the à band, as revealed by the FC simulation. In order to confirm the assignment and understand the broad feature of band Ã, the vertical and adiabatic excitation energies of the first excited state of R-TFAE were calculated by the TDDFT method, as summarized in Table S1 (ESI†). The results show that the calculated adiabatic excitation energy (0.32 eV) is consistent with the experimental energy separation. The relatively large difference between the vertical (0.54 eV) and adiabatic excitation energies (0.32 eV) of the first excited state (Table S1, ESI†) indicates that there is a relatively large geometry change between the first excited neutral state and the anion ground state, which is consistent with the very broad structure of band à in Fig. 2. The good agreement between the theoretical results and the experimental observations supported that the chiral R-TFAE− was indeed the observed anion.
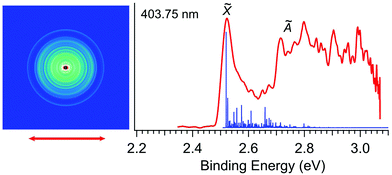 | ||
| Fig. 2 Non-resonant photoelectron image and spectrum of R-TFAE− at 403.75 nm (3.0708 eV). The calculated FC factors for the electronic ground state are shown as vertical lines. | ||
3.3. High-resolution photoelectron imaging of R-TFAE− at lower photon energies
In order to determine the EA of R-TFAE more accurately and resolve the vibrational features for band![[X with combining tilde]](https://www.rsc.org/images/entities/char_0058_0303.gif) , we took higher resolution photoelectron images at two lower photon energies, as shown in Fig. 3. The first intense peak, labelled as 000, denotes the detachment transition from the vibrational ground state of R-TFAE− to that of neutral R-TFAE, and defines the EA of R-TFAE. Peaks A–D represent excited vibrational levels of neutral R-TFAE. The binding energies of the five vibrational peaks are given in Table 1, as well as the shifts to peak 000, the assignments, and their comparisons to the theoretical vibrational frequencies. All the displacement vectors and computed frequencies of the vibrational modes of R-TFAE are presented in Fig. S1 and Table S2 (ESI†). The 000 peak defines an accurate EA of 2.5234 ± 0.0007 eV (20
, we took higher resolution photoelectron images at two lower photon energies, as shown in Fig. 3. The first intense peak, labelled as 000, denotes the detachment transition from the vibrational ground state of R-TFAE− to that of neutral R-TFAE, and defines the EA of R-TFAE. Peaks A–D represent excited vibrational levels of neutral R-TFAE. The binding energies of the five vibrational peaks are given in Table 1, as well as the shifts to peak 000, the assignments, and their comparisons to the theoretical vibrational frequencies. All the displacement vectors and computed frequencies of the vibrational modes of R-TFAE are presented in Fig. S1 and Table S2 (ESI†). The 000 peak defines an accurate EA of 2.5234 ± 0.0007 eV (20![[thin space (1/6-em)]](https://www.rsc.org/images/entities/char_2009.gif) 353 ± 6 cm−1) for R-TFAE. Peaks 000, A, B, and C are also observed more accurately in the resonant photoelectron spectra (vide infra). The experimental uncertainties in the last digit in Table 1 are from the more accurate resonant photoelectron spectra. Specifically, the EA of R-TFAE is best determined to be 2.5234 ± 0.0002 eV (20
353 ± 6 cm−1) for R-TFAE. Peaks 000, A, B, and C are also observed more accurately in the resonant photoelectron spectra (vide infra). The experimental uncertainties in the last digit in Table 1 are from the more accurate resonant photoelectron spectra. Specifically, the EA of R-TFAE is best determined to be 2.5234 ± 0.0002 eV (20![[thin space (1/6-em)]](https://www.rsc.org/images/entities/char_2009.gif) 353 ± 2 cm−1).
353 ± 2 cm−1).
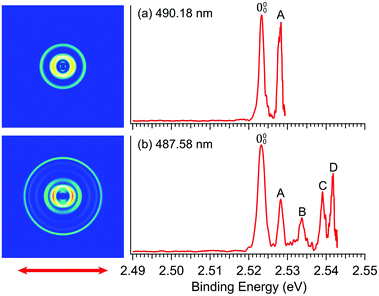 | ||
| Fig. 3 Photoelectron images and spectra of R-TFAE− at (a) 490.18 nm (2.5294 eV) and (b) 487.58 nm (2.5428 eV). The double arrow below the images indicates the laser polarization. | ||
| Observed peak | Binding energya (eV) | Binding energya (cm−1) | Shift (cm−1) | Assignment | Theoretical frequency (cm−1) |
|---|---|---|---|---|---|
| a The numbers in the parentheses indicate the experimental uncertainties in the last digit. | |||||
| 000 | 2.5234 (2) | 20![[thin space (1/6-em)]](https://www.rsc.org/images/entities/char_2009.gif) 353 (2) 353 (2) |
0 | — | — |
| A | 2.5285 (5) | 20![[thin space (1/6-em)]](https://www.rsc.org/images/entities/char_2009.gif) 394 (4) 394 (4) |
41 | 831 | 45 |
| B | 2.5336 (4) | 20![[thin space (1/6-em)]](https://www.rsc.org/images/entities/char_2009.gif) 435 (3) 435 (3) |
82 | 811/832 | 85/90 |
| C | 2.5390 (5) | 20![[thin space (1/6-em)]](https://www.rsc.org/images/entities/char_2009.gif) 478 (4) 478 (4) |
125 | 831811/833 | 130/135 |
| D | 2.5418 (5) | 20![[thin space (1/6-em)]](https://www.rsc.org/images/entities/char_2009.gif) 501 (4) 501 (4) |
148 | 831801 | 156 |
3.4. Photodetachment spectroscopy of R-TFAE−
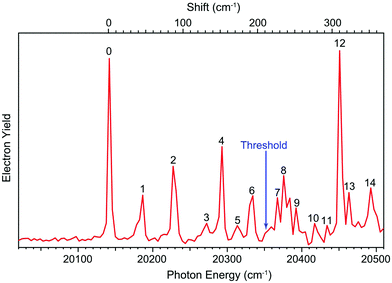
The dipole moment of the R-TFAE radical is calculated to be 4.1 D, which is larger than the empirical critical value (2.5 D) to support a DBS as an electronically excited state of the R-TFAE− anion.56 To search for the DBS, we measured the photodetachment spectrum of R-TFAE− by scanning the detachment laser wavelength around the threshold and monitoring the total photoelectron yield, as shown in Fig. 4. The arrow at 20![[thin space (1/6-em)]](https://www.rsc.org/images/entities/char_2009.gif) 353 cm−1 indicates the detachment threshold. The observation of sharp peaks and resonances suggests the existence of a DBS. The first below-threshold peak denoted as 0, at 20
353 cm−1 indicates the detachment threshold. The observation of sharp peaks and resonances suggests the existence of a DBS. The first below-threshold peak denoted as 0, at 20![[thin space (1/6-em)]](https://www.rsc.org/images/entities/char_2009.gif) 144 cm−1 (2.4975 eV) should correspond to the ground state of the DBS. The binding energy of the DBS, defined as the energy difference between the detachment threshold of the anion and the ground vibrational level of the DBS, is determined to be 209 ± 2 cm−1 (0.0259 ± 0.0002 eV). Fourteen vibrational levels of the DBS (labelled as 1–14) were observed in the spectrum. The seven below-threshold peaks (0–6), i.e. bound vibrational levels of the DBS, were observed as a result of R2PD. The eight above-threshold peaks (7–14), also known as vibrational Feshbach resonances, were due to single-photon excitations to the vibrational levels of the DBS of R-TFAE−, followed by vibrational autodetachment. The wavelengths, photon energies, assignments and comparisons with the calculated frequencies are given in Table 2.
144 cm−1 (2.4975 eV) should correspond to the ground state of the DBS. The binding energy of the DBS, defined as the energy difference between the detachment threshold of the anion and the ground vibrational level of the DBS, is determined to be 209 ± 2 cm−1 (0.0259 ± 0.0002 eV). Fourteen vibrational levels of the DBS (labelled as 1–14) were observed in the spectrum. The seven below-threshold peaks (0–6), i.e. bound vibrational levels of the DBS, were observed as a result of R2PD. The eight above-threshold peaks (7–14), also known as vibrational Feshbach resonances, were due to single-photon excitations to the vibrational levels of the DBS of R-TFAE−, followed by vibrational autodetachment. The wavelengths, photon energies, assignments and comparisons with the calculated frequencies are given in Table 2.
| Peak | Wavelength (nm) | Photon energya (cm−1) | Shift (cm−1) | Assignment | Theoretical frequency (cm−1) |
|---|---|---|---|---|---|
| a The experimental uncertainty was estimated to be ±3 cm−1. | |||||
| 0 | 496.42 | 20![[thin space (1/6-em)]](https://www.rsc.org/images/entities/char_2009.gif) 144 144 |
0 | DBS ground state | — |
| 1 | 495.40 | 20![[thin space (1/6-em)]](https://www.rsc.org/images/entities/char_2009.gif) 186 186 |
42 | 83′1 | 45 |
| 2 | 494.31 | 20![[thin space (1/6-em)]](https://www.rsc.org/images/entities/char_2009.gif) 230 230 |
86 | 81′1/83′2 | 85/90 |
| 3 | 493.30 | 20![[thin space (1/6-em)]](https://www.rsc.org/images/entities/char_2009.gif) 272 272 |
128 | 83′181′1/83′3 | 130/135 |
| 4 | 492.76 | 20![[thin space (1/6-em)]](https://www.rsc.org/images/entities/char_2009.gif) 294 294 |
150 | 83′180′1 | 156 |
| 5 | 492.28 | 20![[thin space (1/6-em)]](https://www.rsc.org/images/entities/char_2009.gif) 314 314 |
170 | 81′2/83′281′1/83′4 | 170/175/180 |
| 6 | 491.86 | 20![[thin space (1/6-em)]](https://www.rsc.org/images/entities/char_2009.gif) 331 331 |
187 | 83′182′181′1/83′382′1 | 184/189 |
| 7 | 491.02 | 20![[thin space (1/6-em)]](https://www.rsc.org/images/entities/char_2009.gif) 366 366 |
222 | 77′1 | 224 |
| 8 | 490.76 | 20![[thin space (1/6-em)]](https://www.rsc.org/images/entities/char_2009.gif) 377 377 |
233 | 76′1 | 229 |
| 9 | 490.42 | 20![[thin space (1/6-em)]](https://www.rsc.org/images/entities/char_2009.gif) 391 391 |
247 | 75′1 | 237 |
| 10 | 489.64 | 20![[thin space (1/6-em)]](https://www.rsc.org/images/entities/char_2009.gif) 423 423 |
279 | 83′176′1 | 274 |
| 11 | 489.40 | 20![[thin space (1/6-em)]](https://www.rsc.org/images/entities/char_2009.gif) 433 433 |
289 | 83′175′1 | 282 |
| 12 | 489.02 | 20![[thin space (1/6-em)]](https://www.rsc.org/images/entities/char_2009.gif) 449 449 |
305 | 73′1/81′177′1/83′277′1 | 307/309/314 |
| 13 | 488.73 | 20![[thin space (1/6-em)]](https://www.rsc.org/images/entities/char_2009.gif) 461 461 |
317 | 81′176′1/83′276′1 | 314/319 |
| 14 | 487.98 | 20![[thin space (1/6-em)]](https://www.rsc.org/images/entities/char_2009.gif) 493 493 |
349 | 83′181′177′1/83′377′1 | 354/359 |
3.5. R2PD photoelectron spectra
By tuning the detachment laser to the wavelength of peak 0 in Fig. 4, we obtained the R2PD photoelectron image and spectrum, as shown in Fig. 5a and b, respectively. The double arrow below the image represents the polarization of the detachment laser. The peak labelled as “DBS” at the low binding energy side represents direct R2PD from the zero-point level of the DBS. In addition, broad features (labelled as “ES” and “S0”) were observed in Fig. 5b at higher binding energies. By tuning the detachment laser to the wavelengths corresponding to the other six bound vibrational peaks of the DBS, we obtained nearly identical R2PD photoelectron images and spectra. All seven R2PD photoelectron spectra are compared in Fig. 5c. In addition to the sharp “DBS” peak, the weak broad band “ES” ranging from ∼0.2 eV to ∼1.5 eV binding energy and the long tail feature “S0” at the high binding energy side extending to ∼2 eV were observed. As indicated by the vertical dashed line in Fig. 5c, the “DBS” peaks in the seven R2PD spectra display the same binding energy at ∼0.03 eV, consistent with the DBS binding energy of 0.0259(2) eV accurately measured from the photodetachment spectrum in Fig. 4. The “ES” and “S0” features are due to relaxation from the DBS, as will be discussed in Section 4.1.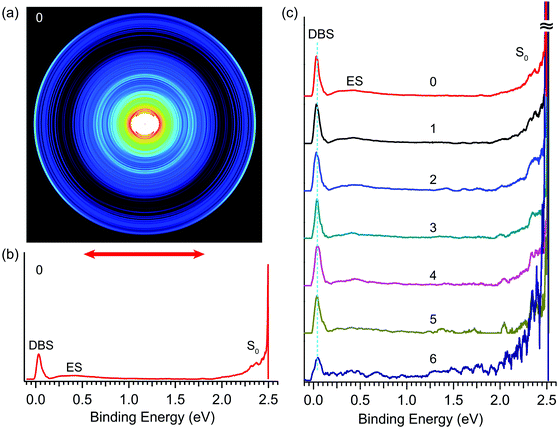 | ||
| Fig. 5 Resonant two-photon photoelectron images and spectra of R-TFAE− at detachment wavelengths corresponding to peaks 0–6 shown in Fig. 4. (a) The photoelectron image at peak 0 (496.42 nm, 2.4975 eV); (b) the R2PD photoelectron spectrum inverted from the image in (a): the three observed features are labelled as DBS, ES, and S0; (c) comparison of the seven R2PD photoelectron spectra, the peak numbers from Fig. 4 are indicated, see Table 2 for the wavelengths of peaks 1–6. | ||
3.6. Resonant photoelectron spectra
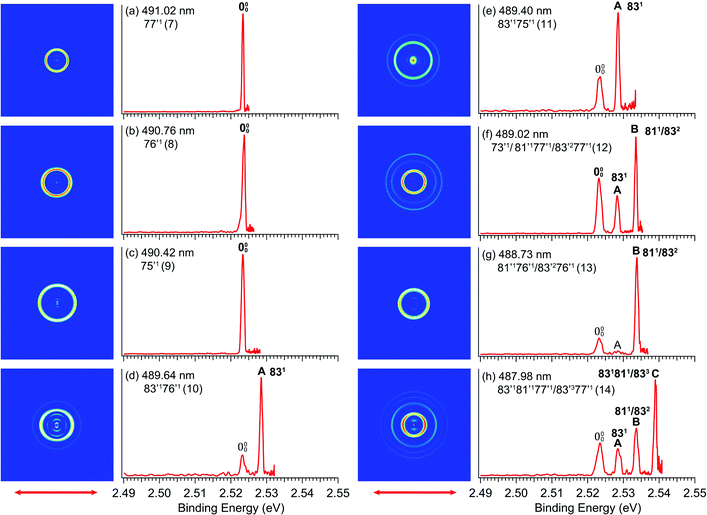
By tuning the detachment laser to the wavelengths corresponding to the above-threshold DBS vibrational peaks (7–14) in Fig. 4, we obtained eight resonantly-enhanced photoelectron images and spectra, as shown in Fig. 6. Two detachment channels contribute to the resonant photoelectron spectra: the direct non-resonant detachment process and the resonantly-enhanced vibrational autodetachment via the DBS. Compared to the non-resonant spectra in Fig. 3, one or more vibrational peaks are enhanced in the resonant photoelectron spectra due to the Δv = −1 vibrational autodetachment propensity rule, resulting in the highly non-FC behavior. The binding energies in eV and cm−1, shifts relative to the 0–0 peak, and the assignments of the observed vibrational peaks are summarized in Table 1, along with the results from the non-resonant high-resolution PES from Fig. 3. The binding energies for the 0–0 transition and peaks A, B, C are measured more accurately from the rPES. Resonant PES via the DBS usually yields much richer spectroscopic information including low frequency symmetry–forbidden vibrational modes.36,52–54 In the current study, no new vibrational peaks were observed because of two reasons: (1) the low symmetry of R-TFAE− (C1), which means all vibrational modes are symmetry-allowed and (2) the limited photon energy range in the PDS. However, the resonant PES gave more accurate binding energies for the enhanced vibrational peaks (including the 0–0 peak and peaks A, B, C), which are given in Table 1.4. Discussion
4.1. R2PD PES: adiabatic detachment and relaxation processes from the DBS
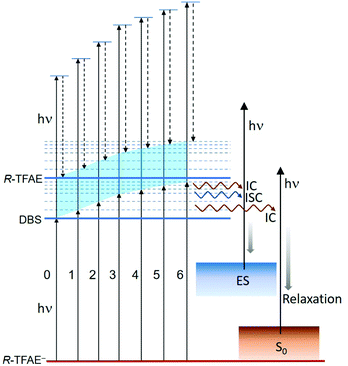
The seven bound vibrational levels (0–6) of the DBS observed in the photodetachment spectrum (Fig. 4) were due to one-color R2PD: the first photon excites the R-TFAE− anion to a specific vibrational level of the DBS, followed by detachment to the continuum by the second photon within the same 5 ns laser pulse. The assignments of these DBS vibrational levels (Table 2) are assisted by the calculated vibrational frequencies of R-TFAE and the FC simulations. Relaxation from the bound DBS vibrational levels could occur before the detachment by the second photon and can be revealed by the outgoing photoelectrons.32,63 The seven R2PD photoelectron spectra in Fig. 5 display similar, but somewhat complicated spectral features, suggesting relaxation processes have taken place before electron detachment by the second photon within the 5 ns laser pulse. The peak labelled as “DBS” is due to sequential two-photon detachment via the DBS, resulting in high kinetic energy electrons (low binding energies) corresponding to the outmost ring in the R2PD image (Fig. 5a). A distinct p-wave character is observed in the angular distribution, as expected from the s-like orbital of the DBS. This peak was the only signals expected if there were no relaxation before the absorption of the second photon.Furthermore, the binding energy of the “DBS” peak in the R2PD photoelectron spectra should increase as higher DBS vibrational levels are excited by the first photon. However, the observed binding energies of the “DBS” peak in the seven R2PD photoelectron spectra are identical within our experimental uncertainty, as indicated by the vertical dashed line in Fig. 5c. This observation implies an adiabatic detachment process from the DBS, during which the vibrational levels in the initial and final states do not change. The adiabatic detachment process is a direct consequence of the fact that the dipole-bound electron has little effect on the structure of the neutral core, i.e. the potential energy surface of the DBS is parallel to that of the neutral ground state. Thus, there is no change of structure and vibrational levels upon detachment of the dipole-bound electron by the second photon, as depicted schematically in Fig. 7 for the seven bound vibrational levels of the DBS. In other words, the initial vibrational energies in the DBS are carried to the neutral final states, a strictly adiabatic detachment process, as represented by the shaded area in Fig. 7. It should be pointed out that, for R2PD photoelectron spectra involving vibrational levels of valence-bound excited states, totally different FC-profiles were expected for different intermediate vibrational levels. This was first demonstrated vividly in the case of AuS−.65
Besides the expected “DBS” peak, several other broad features at higher binding energies, labelled as “ES” and “S0”, are observed in the R2PD photoelectron spectra (Fig. 5). These spectral features provide direct evidence that relaxation from the DBS bound vibrational levels has occurred during the 5 ns laser pulse. Similar spectral features were observed previously in R2PD photoelectron spectra via DBS.32,41 The diffuse and intense signals in the high binding energy side extending to around 2 eV labelled as “S0” are due to detachment from the rovibrational manifold of the ground electronic state of R-TFAE−, due to internal conversion (IC) from the DBS to the rovibrationally excited states of the anions followed by relaxation via intramolecular vibrational redistribution (IVR) and/or radiative processes,54 as shown schematically in Fig. 7. The weak and broad feature labelled as “ES” between 0.2 and 1 eV is attributed to detachment from low-lying electronically excited states of the R-TFAE− anion, populated by IC (to singlet states) or intersystem crossing (ISC) (to triplet states) from the DBS followed by IVR and radiative relaxations, as shown in Fig. 7. We investigated the low-lying excited electronic states of R-TFAE− using TDDFT calculations. The calculated vertical excitation energies of the first six electronically excited states of R-TFAE− are summarized in Table S3 (ESI†). The first five excited electronic states are bound below the detachment threshold of 2.5234 eV, three of which are triplet states. The excitation energies of these five excited states range from 1.39 to 1.83 eV. These valence-excited states of the R-TFAE− anion can be populated from the DBS via IC or ISC, followed by detachment from a second photon, giving rise to the weak broad feature designated as “ES” in the R2PD photoelectron spectra (Fig. 5c). DBS has been suggested as the “doorway” to the formation of valence-bound anions. The current observation provides further evidence for the fast conversion from DBS to valence-bound states.
It should also be pointed out that bound vibrational levels of the DBS require the absorption of two photons to be observed and the R2PD cross sections are usually very low in the PDS.15,66,67 However, the relative intensities of the seven bound vibrational peaks in Fig. 4 are unusually high, in fact, as high as the above-threshold DBS peaks, which involve only single-photon processes. The fast relaxation from the bound DBS levels to the low-lying valence-bound states in R-TFAE− is likely the reason, because the detachment cross sections from these valence excited states by the second photon are expected to be much higher. As a matter of fact, we have found that this has been the case whenever we observed fast relaxation processes from the bound DBS levels.32,41,54
4.2. PDS and rPES at the vibrational Feshbach resonances
Different from the R2PD spectra, the eight photoelectron spectra at the vibrational Feshbach resonances of the DBS are dominated by single-photon excitation followed by autodetachment (Fig. 6). Because the excess electron in the DBS has little effect to the neutral core, the geometry and vibrational frequencies of the DBS are identical to the ground state of the corresponding neutral, resulting in the Δv = −1 propensity rule for the vibrational autodetachment under the harmonic approximation,68,69i.e. only one vibrational quantum can be coupled to the DBS electron. Thus, selected vibrational peaks in rPES are enhanced in comparison to the non-resonant photoelectron spectra. Violation of the Δv = −1 propensity rule can often happen for low-frequency modes as a result of anharmonicity.68Guided by the theoretical frequencies for the neutral R-TFAE (Table S2, ESI†), and the enhanced vibrational peaks in rPES in the cases of the Fashbach resonances, we are able to assign all the vibrational levels observed in the photodetachment spectrum (Fig. 4), as given in Table 2. Besides excitations to fundamental vibrational levels of the DBS (peaks 1, 7–9), excitations to combinational vibrational levels (peaks 4, 10, 11) and overlapping vibrational levels (peaks 2, 3, 5, 6, 12–14) are also observed. In Table 2, the prime ′ is used to designate the vibrational modes of the DBS, even though they are the same as the corresponding neutral R-TFAE radical, due to the negligible perturbation of the neutral core by the dipole-bound electron. Because the overtone of the bending mode v83 (2v83 = 90 cm−1) is nearly degenerate with the fundamental frequency of mode v81 (85 cm−1) according to the calculated frequencies (Table S2, ESI†), some vibrational levels (peaks 2, 3, 5, 6, 12–14) contain several possibilities due to the indistinguishable frequencies of 83′2 and 81′1 within the experimental and theoretical uncertainties.
The assignments of the Feshbach resonances 7–9 to the fundamental vibrational levels of 77′1, 76′1 and 75′1, respectively, are based on the resonant photoelectron spectra (Fig. 6a–c), which display enhancement of the 0–0 transition following the Δv = −1 propensity rule. The calculated vibrational frequencies for the ν77, ν76, and ν75 modes are in good agreement with the experimental data (Table 2). In the resonant photoelectron spectra of peaks 10 (Fig. 6d) and 11 (Fig. 6e), the 831 level of the neutral (peak A) is significantly enhanced, indicating the 83′176′1 and 83′175′1 combinational levels of the DBS are excited, respectively. The enhancement of the 831 level was due to the coupling of the 76′1 (Fig. 6d) and the 75′1 (Fig. 6e) quanta to the DBS electron, whereas the energy of 83′1 (45 cm−1) is not large enough to induce autodetachment of the dipole-bound electron. Due to the ambiguity between 81′1 and 83′2, the Feshbach resonances 12–14 are assigned to overlapping vibrational levels (Fig. 6f–h). In the resonant photoelectron spectra corresponding to peaks 12 and 14, besides the expected enhanced peaks B (811/832) and C (831811/833), respectively, more final vibrational peaks seem to be enhanced due to the violation of the Δv = −1 propensity rule: peak A (831) in Fig. 6f, peaks A (831) and B (811/832) in Fig. 6h. The computed frequency for the ν73 mode (307 cm−1, Table S2, ESI†) agrees well with the excitation energy of peak 12 (305 cm−1, Table 2). Thus, 73′1 is likely excited in peak 12, consistent with the fact that this peak is the most intense transition in the photodetachment spectrum (Fig. 4). The excitation to the 73′1 DBS level should produce an enhanced 000 peak in the resonant photoelectron spectrum, which is borne out in Fig. 6f. The observed vibrational levels of the DBS and the autodetachment from the Feshbach resonances are schematically shown in Fig. 8. In total, frequencies for eight vibrational modes of the R-TFAE radical are obtained and compared with the calculated frequencies in Table 3. The displacement vectors for all the normal modes of R-TFAE are presented in Fig. S1 (ESI†).
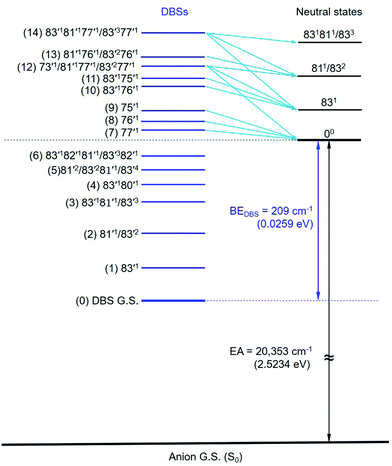 | ||
| Fig. 8 The observed vibrational levels of the DBS of R-TFAE− and the autodetachment processes from the vibrational Fashbach resonances to the neutral final states. The peak numbers in Fig. 4 are given in the parentheses. | ||
5. Conclusion
We report an investigation of a cryogenically-cooled complex anion, the enantiopure (R)-(−)-1-(9-anthryl)-2,2,2-trifluoroethanolate (R-TFAE−), using photoelectron spectroscopy, photodetachment spectroscopy, resonant two-photon detachment, and resonant photoelectron imaging. The electron affinity of the R-TFAE radical was accurately determined to be 2.5234 ± 0.0002 eV (20![[thin space (1/6-em)]](https://www.rsc.org/images/entities/char_2009.gif) 353 ± 2 cm−1). A dipole-bound state was observed 209 ± 2 cm−1 below the detachment threshold of R-TFAE− by photodetachment spectroscopy. Fifteen vibrational peaks of the DBS were observed and assigned, including seven below-threshold peaks and eight vibrational Feshbach resonances. Fundamental frequencies of eight vibrational modes of R-TFAE were measured experimentally. Resonant two-photon detachment via the bound vibrational levels of the DBS demonstrated strict adiabatic photodetachment behaviors by the second photon, during which the same vibrational energies in the DBS were carried to the neutral final states. Relaxation processes from the bound DBS levels to the ground state and low-lying excited states of the anion were also observed in the resonant two-photon photoelectron spectroscopy. The current study paves the way for potential pump–probe experiments to examine the dynamics of the DBS, as well as photoelectron circular dichroism using circularly polarized light.
353 ± 2 cm−1). A dipole-bound state was observed 209 ± 2 cm−1 below the detachment threshold of R-TFAE− by photodetachment spectroscopy. Fifteen vibrational peaks of the DBS were observed and assigned, including seven below-threshold peaks and eight vibrational Feshbach resonances. Fundamental frequencies of eight vibrational modes of R-TFAE were measured experimentally. Resonant two-photon detachment via the bound vibrational levels of the DBS demonstrated strict adiabatic photodetachment behaviors by the second photon, during which the same vibrational energies in the DBS were carried to the neutral final states. Relaxation processes from the bound DBS levels to the ground state and low-lying excited states of the anion were also observed in the resonant two-photon photoelectron spectroscopy. The current study paves the way for potential pump–probe experiments to examine the dynamics of the DBS, as well as photoelectron circular dichroism using circularly polarized light.
Conflicts of interest
There are no conflicts to declare.Acknowledgements
We thank Dr Y. Liu for helpful discussions. This work was supported by the Department of Energy, Office of Basic Energy Sciences, Chemical Sciences, Geosciences, and Biosciences Division under Grant DE-SC0018679 (to L. S. W.). The calculation was performed using computational resources and services provided by CCV of Brown University.References
- C. Desfrançois, H. Abdoul-Carime and J.-P. Schermann, Int. J. Mod. Phys. B, 1996, 10, 1339–1395 CrossRef.
- R. N. Compton and N. I. Hammer, Advances in Gas Phase Ion Chemistry, Elsevier Science, 1st edn, 2001 Search PubMed.
- K. D. Jordan and F. Wang, Annu. Rev. Phys. Chem., 2003, 54, 367–396 CrossRef CAS.
- J. Simons, J. Phys. Chem. A, 2008, 112, 6401–6511 CrossRef CAS.
- N. I. Hammer, R. J. Hinde, R. N. Compton, K. Diri, K. D. Jordan, D. Radisic, S. T. Stokes and K. H. Bowen, J. Chem. Phys., 2004, 120, 685–690 CrossRef CAS.
- G. Liu, M. Diaz-Tinoco, S. M. Ciborowski, C. Martinez-Martinez, S. Lyapustina, J. H. Hendricks, J. V. Ortiz and K. H. Bowen, Phys. Chem. Chem. Phys., 2020, 22, 3273–3280 RSC.
- R. L. Jackson, A. H. Zimmerman and J. I. Brauman, J. Chem. Phys., 1979, 71, 2088–2094 CrossRef CAS.
- R. L. Jackson, P. C. Hiberty and J. I. Brauman, J. Chem. Phys., 1981, 74, 3705–3712 CrossRef CAS.
- K. R. Lykke, R. D. Mead and W. C. Lineberger, Phys. Rev. Lett., 1984, 52, 2221–2224 CrossRef CAS.
- R. D. Mead, K. R. Lykke, W. C. Lineberger, J. Marks and J. I. Brauman, J. Chem. Phys., 1984, 81, 4883–4892 CrossRef CAS.
- A. S. Mullin, K. K. Murray, C. P. Schultz, D. M. Szaflarski and W. C. Lineberger, Chem. Phys., 1992, 166, 207–213 CrossRef CAS.
- K. Yokoyama, G. W. Leach, J. B. Kim, W. C. Lineberger, A. I. Boldyrev and M. Gutowski, J. Chem. Phys., 1996, 105, 10706–10718 CrossRef CAS.
- C. E. H. Dessent, J. Kim and M. A. Johnson, Acc. Chem. Res., 1998, 31, 527–534 CrossRef CAS.
- T. Pino, M. Tulej, F. Guthe, M. Pachkov and J. P. Maier, J. Chem. Phys., 2002, 116, 6126–6131 CrossRef CAS.
- H. T. Liu, C. G. Ning, D. L. Huang and L. S. Wang, Angew. Chem., Int. Ed., 2014, 53, 2464–2468 CrossRef CAS.
- D. B. Dao and R. Mabbs, J. Chem. Phys., 2014, 141, 154304 CrossRef.
- K. J. Mascaritolo, A. M. Gardner and M. C. Heaven, J. Chem. Phys., 2015, 143, 114311 CrossRef.
- E. Fermi and E. Teller, Phys. Rev., 1947, 72, 399–408 CrossRef CAS.
- P. Mikulski, T. Klahn and P. Krebs, Phys. Rev. A: At., Mol., Opt. Phys., 1997, 55, 369–377 CrossRef CAS.
- P. D. Burrow, G. A. Gallup, A. M. Scheer, S. Denifl, S. Ptasinska, T. Mark and P. Scheier, J. Chem. Phys., 2006, 124, 124310 CrossRef CAS.
- B. Boudaiffa, P. Cloutier, D. Hunting, M. A. Huels and L. Sanche, Science, 2000, 287, 1658–1660 CrossRef CAS.
- G. L. Gutsev and R. J. Bartlett, J. Chem. Phys., 1996, 105, 8785–8792 CrossRef CAS.
- R. N. Compton, H. S. Carman, C. Desfrançois, H. Abdoul-Carime, J. P. Schermann, J. H. Hendricks, S. A. Lyapustina and K. H. Bowen, J. Chem. Phys., 1996, 105, 3472–3478 CrossRef CAS.
- T. Sommerfeld, Phys. Chem. Chem. Phys., 2002, 4, 2511–2516 RSC.
- C. G. Bailey, C. E. H. Dessent, M. A. Johnson and K. H. Bowen, J. Chem. Phys., 1996, 104, 6976–6983 CrossRef CAS.
- D. L. Huang, H. T. Liu, C. G. Ning, P. D. Dau and L. S. Wang, Chem. Phys., 2017, 482, 374–383 CrossRef CAS.
- M. A. Yandell, S. B. King and D. M. Neumark, J. Chem. Phys., 2014, 140, 184317 CrossRef.
- A. Kunin, W. L. Li and D. M. Neumark, Phys. Chem. Chem. Phys., 2016, 18, 33226–33232 RSC.
- A. Kunin and D. M. Neumark, Phys. Chem. Chem. Phys., 2019, 21, 7239–7255 RSC.
- J. N. Bull, C. W. West and J. R. R. Verlet, Chem. Sci., 2016, 7, 5352–5361 RSC.
- J. N. Bull, C. S. Anstöter and J. R. R. Verlet, Nat. Commun., 2019, 10, 5820 CrossRef CAS.
- G. Z. Zhu, L. F. Cheung, Y. Liu, C. H. Qian and L. S. Wang, J. Phys. Chem. Lett., 2019, 10, 4339–4344 CrossRef CAS.
- D. H. Kang, J. Kim and S. K. Kim, J. Phys. Chem. Lett., 2021, 12, 6383–6388 CrossRef CAS.
- H. T. Liu, C. G. Ning, D. L. Huang, P. D. Dau and L. S. Wang, Angew. Chem., Int. Ed., 2013, 52, 8976–8979 CrossRef CAS.
- D. L. Huang, H. T. Liu, C. G. Ning, G. Z. Zhu and L. S. Wang, Chem. Sci., 2015, 6, 3129–3138 RSC.
- G. Z. Zhu and L. S. Wang, Chem. Sci., 2019, 10, 9409–9423 RSC.
- D. F. Yuan, Y. Liu, C. H. Qian, Y. R. Zhang, B. M. Rubenstein and L. S. Wang, Phys. Rev. Lett., 2020, 125, 073003 CrossRef CAS.
- Y. Lu, R. Tang and C. Ning, J. Phys. Chem. Lett., 2021, 12, 5897–5902 CrossRef CAS.
- D. H. Kang, S. An and S. K. Kim, Phys. Rev. Lett., 2020, 125, 093001 CrossRef CAS.
- A. Kastner, T. Ring, B. C. Kruger, G. B. Park, T. Schafer, A. Senftleben and T. Baubert, J. Chem. Phys., 2017, 147, 013926 CrossRef.
- D. F. Yuan, Y. Liu, C. H. Qian, G. S. Kocheril, Y. R. Zhang, B. M. Rubenstein and L. S. Wang, J. Phys. Chem. Lett., 2020, 11, 7914.28–7919.28 Search PubMed.
- M. Yamashita and J. B. Fenn, J. Phys. Chem., 1984, 88, 4451–4459 CrossRef CAS.
- J. B. Fenn, Angew. Chem., Int. Ed., 2003, 42, 3871–3894 CrossRef CAS.
- L. S. Wang, C. F. Ding, X. B. Wang and J. B. Nicholas, Phys. Rev. Lett., 1998, 81, 2667–2670 CrossRef CAS.
- L. S. Wang, C. F. Ding, X. B. Wang and S. E. Barlow, Rev. Sci. Instrum., 1999, 70, 1957–1960 CrossRef CAS.
- X. B. Wang, X. Yang, J. B. Nicholas and L. S. Wang, Science, 2001, 294, 1322–1325 CrossRef CAS.
- X.-B. Wang, X. Yang and L.-S. Wang, Int. Rev. Phys. Chem., 2002, 21, 472–498 Search PubMed.
- X. Yang, X. B. Wang, E. R. Vorpagel and L. S. Wang, Proc. Natl. Acad. Sci. U. S. A., 2004, 101, 17588–17592 CrossRef CAS.
- X. B. Wang and L. S. Wang, Rev. Sci. Instrum., 2008, 79, 073108 CrossRef.
- T. Waters, X. B. Wang and L. S. Wang, Coord. Chem. Rev., 2007, 251, 474–491 CrossRef CAS.
- L. S. Wang, J. Chem. Phys., 2015, 143, 040901 CrossRef.
- C. H. Qian, G. Z. Zhu, Y. R. Zhang and L. S. Wang, J. Chem. Phys., 2020, 152, 214307 CrossRef CAS.
- Y. Liu, G. Z. Zhu, D. F. Yuan, C. H. Qian, Y. R. Zhang, B. M. Rubenstein and L. S. Wang, J. Am. Chem. Soc., 2020, 142, 20240–20246 CrossRef CAS.
- Y. R. Zhang, D. F. Yuan, C. H. Qian and L. S. Wang, J. Chem. Phys., 2021, 155, 124305 CrossRef CAS.
- H. Y. Aboul-Enein and I. Ali, Chiral separations by liquid chromatography and related technologies, M. Dekker, New York, 2003 Search PubMed.
- C. H. Qian, G. Z. Zhu and L. S. Wang, J. Phys. Chem. Lett., 2019, 10, 6472–6477 CrossRef CAS.
- C. Lux, M. Wollenhaupt, T. Bolze, Q. Liang, J. Köhler, C. Sarpe and T. Baumert, Angew. Chem., Int. Ed., 2012, 51, 5001–5005 CrossRef CAS.
- G. A. Garcia, L. Nahon, S. Daly and I. Powis, Nat. Commun., 2013, 4, 2132 CrossRef.
- P. Krüger and K.-M. Weitzel, Angew. Chem., Int. Ed., 2021, 60, 17861–17865 CrossRef.
- I. León, Z. Yang, H. T. Liu and L. S. Wang, Rev. Sci. Instrum., 2014, 85, 083106 CrossRef.
- G. A. Garcia, L. Nahon and I. Powis, Rev. Sci. Instrum., 2004, 75, 4989–4996 CrossRef CAS.
- V. Dribinski, A. Ossadtchi, V. A. Mandelshtam and H. Reisler, Rev. Sci. Instrum., 2002, 73, 2634–2642 CrossRef CAS.
- M. J. Frisch, G. W. Trucks, H. B. Schlegel, G. E. Scuseria, M. A. Robb, J. R. Cheeseman, G. Scalmani, V. Barone, G. A. Petersson, H. Nakatsuji, X. Li, M. Caricato, A. Marenich, J. Bloino, B. G. Janesko, R. Gomperts, B. Mennucci, H. P. Hratchian, J. V. Ortiz, A. F. Izmaylov, J. L. Sonnenberg, D. Williams-Young, F. Ding, F. Lipparini, F. Egidi, J. Goings, B. Peng, A. Petrone, T. Henderson, D. Ranasinghe, V. G. Zakrzewski, J. Gao, N. Rega, G. Zheng, W. Liang, M. Hada, M. Ehara, K. Toyota, R. Fukuda, J. Hasegawa, M. Ishida, T. Nakajima, Y. Honda, O. Kitao, H. Nakai, T. Vreven, K. Throssell, J. A. Montgomery, Jr., J. E. Peralta, F. Ogliaro, M. Bearpark, J. J. Heyd, E. Brothers, K. N. Kudin, V. N. Staroverov, T. Keith, R. Kobayashi, J. Normand, K. Raghavachari, A. Rendell, J. C. Burant, S. S. Iyengar, J. Tomasi, M. Cossi, J. M. Millam, M. Klene, C. Adamo, R. Cammi, J. W. Ochterski, R. L. Martin, K. Morokuma, O. Farkas, J. B. Foresman and D. J. Fox, Gaussian 09, Revision D.01, Gaussian, Inc., Wallingford CT, 2016 Search PubMed.
- I. Pugliesi and K. Müller-Dethlefs, J. Phys. Chem. A, 2006, 110, 4657–4667 CrossRef CAS.
- H. T. Liu, D. L. Huang, Y. Liu, L. F. Cheung, P. D. Dau, C. G. Ning and L. S. Wang, J. Phys. Chem. Lett., 2015, 6, 637–642 CrossRef CAS.
- D. L. Huang, H. T. Liu, C. G. Ning and L. S. Wang, J. Phys. Chem. Lett., 2015, 6, 2153–2157 CrossRef CAS.
- G. Z. Zhu, C. H. Qian and L. S. Wang, Angew. Chem., Int. Ed., 2019, 58, 7856–7860 CrossRef CAS.
- R. S. Berry, J. Chem. Phys., 1966, 45, 1228–1245 CrossRef CAS.
- J. Simons, J. Am. Chem. Soc., 1981, 103, 3971–3976 CrossRef CAS.
Footnote |
| † Electronic supplementary information (ESI) available. See DOI: 10.1039/d1cp05219e |
| This journal is © the Owner Societies 2022 |

