In situ nanoscale visualization of solvent effects on molecular crystal surfaces†
Mikkel
Herzberg
 a,
Anders S.
Larsen
 a,
Tue
Hassenkam
 b,
Anders Ø.
Madsen
 a and
Jukka
Rantanen
 *a
*a
aDepartment of Pharmacy, University of Copenhagen, Universitetsparken 2, 2100 Copenhagen, Denmark. E-mail: jukka.rantanen@sund.ku.dk
bGlobe Institute, University of Copenhagen, Øster voldgade 5-7, 1350 Copenhagen, Denmark
First published on 8th April 2021
Abstract
Solvents can dramatically affect molecular crystals. Obtaining favorable properties for these crystals requires rational design based on molecular level understanding of the solid–solution interface. Here we show how atomic force microscopy combined with molecular dynamics simulations can be utilized for understanding critical surface properties, namely crystallinity and hydrophobicity, as crystals are exposed to water–ethanol mixtures. We report the formation of dynamic heterogeneous disordered surface (DHDS) layers at the solid–solution interface. The observed DHDS layer was affected by the solvent composition and a variation in the water–ethanol ratio caused significant changes in surface properties.
Careful selection of solvent can be used to control the habit1,2 and surface properties3,4 of molecular crystals. The habit, referring to the shape of crystals, is affected by the properties of crystallization medium and has dramatic consequences for the behaviour of the resulting crystals. The surface chemistry of molecular crystals can, on the other hand, also be modified during the final crystallization step using additives or changes in the solvent composition. Such changes in the crystallization environment will cause rearrangements in the intermolecular interactions at the solid–solution interface and in this way, alter the properties of the resulting crystal surface. A better understanding of the dynamics of solvent effects on molecular crystal surfaces is of great importance for the fine chemical, food and pharmaceutical industry, because surface properties are key parameters influencing processability, solubility and stability of particles.5 Surface specific information can be difficult to obtain with ensemble measurements and it can be even more difficult to characterize dynamic solid–solution interfaces. Characterization methods that have been used to investigate crystal surfaces exposed to liquids include ambient pressure X-ray photoelectron spectroscopy (APXPS),6 quartz crystal microbalance (QCM),7 vibrational spectroscopies such as infrared (IR),8 Raman9 and UV VIS10 as well as atomic force microscopy (AFM). Here we report how in situ AFM combined with molecular dynamics (MD) simulations can be utilized to investigate surface crystallinity and hydrophobicity as crystals are exposed to solvent mixtures. This has potentially interesting applications for crystal engineering purposes as important steps such as crystal growth and washing can be described as an interaction between the crystal surface and a liquid medium. A better understanding and control of these processes could vastly advance optimization of particle habit and resulting bulk powder behaviour.
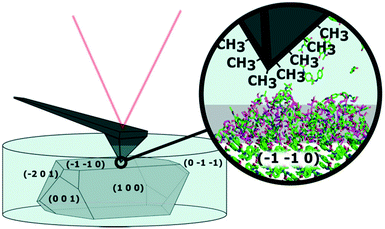
AFM is a well-suited technique for investigating solid–solution interfaces with nanoscale resolution. A schematic of an in situ AFM experiment, where a coated tip is used to measure a crystal surface is shown in Fig. 1. The morphology depiction is adapted from Finnie et al.11 and the indexing was performed using single crystal X-ray diffraction. An optical image of the setup is shown in Fig. S1.† We have an interest to visualize the dynamics at the solid–solution interface in situ and especially, the formation of a surface layer we have named dynamic heterogeneous disordered surface (DHDS) layer.
AFM is well-known for topographic images useful for visualization of surface roughness and determining polymorphic transformations.12,13 AFM can also probe local variations or changes in surface properties by obtaining force–distance curves. In this mode, the AFM tip is approaching the sample from a distance, while the force on the cantilever is monitored. Parameters like indentation and adhesion force can be extracted as shown in Fig. S2.† Changes in indentation on crystal surfaces have previously been correlated with different degrees of crystallinity as an AFM tip will indent further into a less well-ordered crystal lattice using a fixed force.14 If hydrophobic alkanethiols are attached to a gold-coated AFM tip, the adhesion force is related to the hydrophobicity of the surface in an aqueous environment. AFM has previously been used to characterize molecular crystal surfaces in situ using liquid cells12,15,16 and coated AFM tips have been used to probe the chemical properties of molecular crystal surfaces.3,4,12 Force maps, consisting of thousands of these force–distance curves extend the use of AFM as it enables nanoscale visualization of chemical properties on heterogeneous surfaces. Force maps of this type have previously been reported to obtain reliable and reproducible results.17
AFM provides very high resolution in the z-direction (<1 nm). The resolution in the xy-directions is not easily defined as it depends on the tip shape and surface roughness, but it is typically on the order of 10 nm. Even with this resolution it can be difficult to elucidate local molecular orientations or determine if solvent molecules are incorporated in crystal surfaces. MD simulations can provide a qualified guess for this information,18,19 so the method should be interpreted carefully and correlated with experimental results.20 A better understanding of the intermolecular rearrangements causing changes in surface properties would give a deeper understanding of the interaction between solvent molecules and crystal surfaces and might make it possible to predict the outcome of new experiments. Comparison with AFM results is ideal for this type of system because it bridges the gap between surface properties and molecular scale interactions. Results from the two methods have previously been compared to characterize the hydration layer of p-nitroaniline in water and octanol,21 but to the best of our knowledge it has not previously been utilized to elucidate the surface properties of a molecular crystal during solvent exposure. MD simulations are particularly useful for studying crystal surfaces exposed to liquids, because they are ideal for molecular scale systems with highly dynamic interactions.20 Especially the GROMACS package22 combined with the CHARMM force field23 is well suited for such systems and is therefore used in this study.
In this study, paracetamol exposed to saturated water–ethanol mixtures is used as a model system. A saturated solution was used in order to significantly slow down the dissolution of the crystal, when the solvent mixtures in the liquid cell were exchanged. It is well-known that paracetamol can form three different polymorphic forms depending on the crystallization conditions. It can form the stable form I, the metastable form II and the unstable form III. Paracetamol crystallizes into form I in both ethanol and water and this solvent selection therefore makes it possible to investigate how different solvent ratios can affect the surface chemistry without changing the polymorphic form. Paracetamol was recrystallized in water–ethanol mixtures containing 0%, 20% and 40% v/v ethanol. XRPD was used to confirm that all paracetamol samples had the same polymorphic form. This was done to ensure that no polymorphic transformations were induced during the experiment.
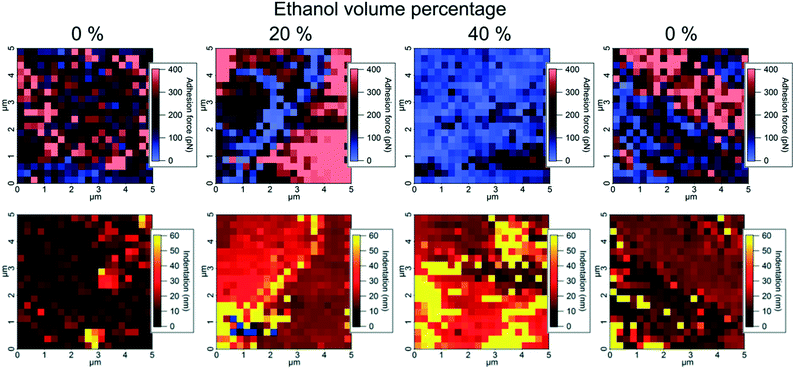
AFM force maps consisting of 20 × 20 force curves over a 5 × 5 μm area were obtained on the (−1−1 0) crystal face of one paracetamol crystal exposed to saturated water–ethanol mixtures containing 0%, 20%, 40% and 0% v/v ethanol by continuously exchanging the solution in the liquid cell between each experiment (Fig. 2). Indentation and adhesion force were extracted from the force curves as illustrated in Fig. S2.† The visualization of data in Fig. 2 reveals that sub-micrometre domains with different properties appear at the paracetamol surface. In most areas, adhesion force and indentation seem to be inversely related, but some smaller areas show both high adhesion force and indentation. It has previously been shown that adhesion force with a hydrophobic tip is a measure of the hydrophobicity of a surface in an aqueous environment,24 while indentation has been related to the structural integrity of a dry crystal surface.14 The domains were formed because of fluctuations in concentration close to the surface, probably influenced by nanoscale surface features.
 | ||
| Fig. 2 Atomic force microscopy force maps visualizing adhesion force with a hydrophobic tip (top) and indentation (bottom) on a paracetamol surface exposed to water–ethanol mixtures. | ||
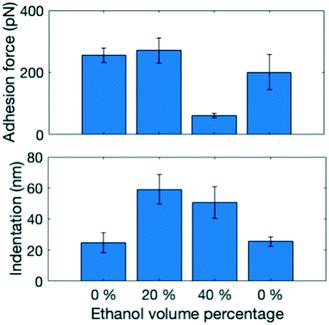
To compare the surface properties in the different solvent mixtures, five force maps were obtained in each solvent mixture at least 15 μm apart from each other to ensure a representative dataset (Fig. 3). Three different combinations of surface properties emerge: at 0% ethanol adhesion force is high and indentation is low, at 20% ethanol both are high and at 40% the adhesion force is low and indentation is high. Changes in surface properties were fully reversible, when the solvent was changed back to pure water. To understand the abrupt change in adhesion force, it is important to consider that it is influenced both by the surface properties and by the hydrophobicity of the solution. As more ethanol is added, the force required to pull the hydrophobic AFM tip back into the solution phase becomes lower. These effects balance each other out in the 20% ethanol case, but for 40% the solution effect dominates.
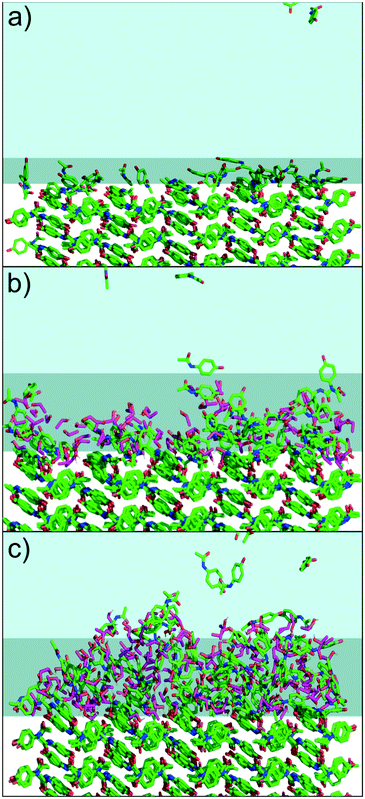
To further understand the intermolecular structure in the solid–solution interface, MD simulations were performed with 0%, 20% and 40% water–ethanol mixtures. The results are shown in Fig. 4. The MD simulations support the interpretation that the change in the indentation behavior is related to a formation of dynamic heterogeneous disordered surface (DHDS) layers. In the term DHDS layer, we refer to “dynamic”, because there is a constant movement of molecules in the layer, and between the DHDS layer and the solution phase and the solid phase. Similarly, we refer to “heterogeneous”, as the DHDS layer is a mixture of paracetamol, ethanol and water molecules and, “disordered”, because the long-range order cannot be observed in this layer. Most surfaces exposed to liquids could in principle be described similarly, but the magnitude is vastly different in this case considering the difference between the ethanol volume percentages in Fig. 3 and 4. The fractional mass density of the paracetamol molecules in the DHDS layer increased continuously during the formation until the end of the simulations which suggest that the system had equilibrated, see Fig. S4.† We did not expect sub-micron scale domains as periodic boundary conditions were used in the MD simulation. However, the formation of DHDS in the MD simulation, with molecules moving back and forth between the solution and the crystal surface, could explain why domains with certain properties spontaneously emerge in the experimental observation (Fig. 2). The MD simulations presented in Fig. 4 are cropped to better visualize the solid–solution interface. A full simulation box is shown in Fig. S3.† Additionally, dry crystals from the experiments were visualized using optical microscopy, scanning electron microscopy and AFM, see Fig. S5–S7.† These dried surfaces did not indicate any significant variations between crystals grown in 0%, 20% or 40% ethanol and the observed nanoscale surface features were characteristic terrace formed. Therefore, we did not expect surface topography to affect the results in Fig. 3, but it could influence where domains of surface properties as shown in Fig. 2 would emerge. We note that the present method could also be used in the opposite situation, to characterize recrystallization in situ at the surface of amorphous particles. This would be, however, significantly more complex because the physical contact during the AFM measurement can affect the crystal growth mechanism.
The solubility of paracetamol is 14.9 mg mL−1 in water and 209.91 mg mL−1 in ethanol.25 Therefore, crystal growth or dissolution could be induced during or after solvent exchanges, even though saturated solutions were used, because of fluctuations in concentration close to the surface. The Noyes Whitney equation26 is a well-established model for estimating the dissolution rate. A simplified version of this equation uses a rate constant k that is depending on diffusion coefficient, surface area, container volume and the term diffusion layer. The diffusion layer is not a physical entity, but a description of a zone of increased concentration expected to extend from a surface during dissolution. For our system, the diffusion layer thickness can be estimated to be approximately 6 nm. The equation and the values are shown in the ESI.† Compared to the results presented in Fig. 2, the diffusion zone is very local, and the molecules are not nearly as dense as in the DHDS layer, so we did not expect it to affect the AFM measurements significantly.
In summary we have demonstrated how AFM combined with MD simulations can be utilized for elucidating critical surface properties, in particular surface crystallinity and hydrophobicity during solvent exposure. We report the presence of DHDS layers on the (−1−1 0) surface of a paracetamol crystal exposed to water–ethanol mixtures, and we obtained different combinations of hydrophobicity and crystallinity by using saturated solvent mixtures. This has potentially interesting applications for crystal engineering purposes as molecular crystal surfaces can be manipulated in this way to obtain favorable properties. Finally, we acknowledge the Independent Research Fund Denmark [Grant No. 8022-00154B] and [Grant No. 8021-00339B] as well as the Villum Foundation [Grant No. 17387] for financial support.
Conflicts of interest
There are no conflicts of interest to declare.Notes and references
- T. R. Keel, C. Thompson, M. C. Davies, S. J. B. Tendler and C. J. Roberts, Int. J. Pharm., 2004, 280, 185–198 CrossRef CAS PubMed.
- C. Thompson, M. C. Davies, C. J. Roberts, S. J. B. Tendler and M. J. Wilkinson, Int. J. Pharm., 2004, 280, 137–150 CrossRef CAS PubMed.
- X. Sheng, M. D. Ward and J. A. Wesson, J. Am. Chem. Soc., 2003, 125, 2854–2855 CrossRef CAS PubMed.
- A. Danesh, M. C. Davies, S. J. Hinder, C. J. Roberts, S. J. B. Tendler, P. M. Williams and M. J. Wilkins, Anal. Chem., 2000, 72, 3419–3422 CrossRef CAS PubMed.
- A. Al-Khattawi, H. Alyami, B. Townsend, X. Ma and A. R. Mohammed, PLoS One, 2014, 9, e101369 CrossRef PubMed.
- H. Ali-Löytty, M. W. Louie, M. R. Singh, L. Li, H. G. Sanchez Casalongue, H. Ogasawara, E. J. Crumlin, Z. Liu, A. T. Bell, A. Nilsson and D. Friebel, J. Phys. Chem. C, 2016, 120, 2247–2253 CrossRef.
- J. Rickert, A. Brecht and W. Göpel, Anal. Chem., 1997, 69, 1441–1448 CrossRef CAS PubMed.
- M. I. Zaki, M. A. Hasan, F. A. Al-Sagheer and L. Pasupulety, Colloids Surf., A, 2001, 190, 261–274 CrossRef CAS.
- P. C. Howlett, N. Brack, A. F. Hollenkamp, M. Forsyth and D. R. MacFarlane, J. Electrochem. Soc., 2006, 153, A595–A606 CrossRef CAS.
- G. Agostini, E. Groppo, A. Piovano, R. Pellegrini, G. Leofanti and C. Lamberti, Langmuir, 2010, 26, 11204–11211 CrossRef CAS PubMed.
- S. D. Finnie, R. I. Ristic, J. N. Sherwood and A. M. Zikic, J. Cryst. Growth, 1999, 207, 308–318 CrossRef CAS.
- E. H. H. Chow, D.-K. Bučar and W. Jones, Chem. Commun., 2012, 48, 9210–9226 RSC.
- R. Thakuria, M. D. Eddleston, E. H. H. Chow, G. O. Lloyd, B. J. Aldous, J. F. Krzyzaniak, A. D. Bond and W. Jones, Angew. Chem., Int. Ed., 2013, 52, 10541–10544 CrossRef CAS PubMed.
- S. Ward, M. Perkins, J. Zhang, C. J. Roberts, C. E. Madden, S. Y. Luk, N. Patel and S. J. Ebbens, Pharm. Res., 2005, 22, 1195–1202 CrossRef CAS PubMed.
- K. M. Shakesheff, M. C. Davies, A. Domb, D. E. Jackson, C. J. Roberts, S. J. B. Tendler and P. M. Williams, Macromolecules, 1995, 28, 1108–1114 CrossRef CAS.
- A. Danesh, S. D. Connell, M. C. Davies, C. J. Roberts, S. J. B. Tendler, P. M. Williams and M. J. Wilkins, Pharm. Res., 2001, 18, 299–303 CrossRef CAS PubMed.
- M. Herzberg, S. Dobberschütz, D. Okhrimenko, N. E. Bovet, M. P. Andersson, S. L. S. Stipp and T. Hassenkam, EPL, 2020, 130, 36001 CrossRef CAS.
- X. Duan, C. Wei, Y. Liu and C. Pei, J. Hazard. Mater., 2010, 174, 175–180 CrossRef CAS PubMed.
- D. Toroz, R. B. Hammond, K. J. Roberts, S. Harris and T. Ridley, J. Cryst. Growth, 2014, 401, 38–43 CrossRef CAS.
- A. Nemkevich, H.-B. Bürgi, M. A. Spackman and B. Corry, Phys. Chem. Chem. Phys., 2010, 12, 14916–14929 RSC.
- P. Spijker, T. Hiasa, T. Musso, R. Nishioka, H. Onishi and A. S. Foster, J. Phys. Chem. C, 2014, 118, 2058–2066 CrossRef CAS.
- S. Pronk, S. Pall, R. Schulz, P. Larsson, P. Bjelkmar, R. Apostolov, M. R. Shirts, J. C. Smith, P. M. Kasson, D. van der Spoel, B. Hess and E. Lindahl, Bioinformatics, 2013, 29, 845–854 CrossRef CAS PubMed.
- K. Vanommeslaeghe, E. Hatcher, C. Acharya, S. Kundu, S. Zhong, J. Shim, E. Darian, O. Guvench, P. Lopes, I. Vorobyov and A. D. Mackerell Jr., J. Comput. Chem., 2010, 31, 671–690 CAS.
- T. Hassenkam, L. L. Skovbjerg and S. L. S. Stipp, Proc. Natl. Acad. Sci. U. S. A., 2009, 106, 6071 CrossRef CAS PubMed.
- R. A. Granberg and Å. C. Rasmuson, J. Chem. Eng. Data, 1999, 44, 1391–1395 CrossRef CAS.
- A. A. Noyes and W. R. Whitney, J. Am. Chem. Soc., 1897, 19, 930–934 CrossRef.
Footnote |
| † Electronic supplementary information (ESI) available. See DOI: 10.1039/d1ce00209k |
| This journal is © The Royal Society of Chemistry 2021 |


