The wavelength-dependent optical properties of weakly absorbing aqueous aerosol particles†
Alison
Bain
 and
Thomas C.
Preston
 *
*
Department of Atmospheric and Oceanic Sciences and Department of Chemistry, McGill University, 805 Sherbrooke Street West, Montreal, QC H3A 0B9, Canada. E-mail: thomas.preston@mcgill.ca
First published on 26th June 2020
Abstract
The refractive index (RI) is a key quantity in calculating many aerosol properties required for climate models. To accurately describe the RI of aerosol, the wavelength and temperature dependence as well as the variation with aerosol water content must be considered. Aside from water, aged ambient aerosol can contain both inorganic salts and a myriad of organic molecules. Determining the optical properties of each organic molecule and their contribution to the aerosol as a whole would be an incredibly time consuming and, in many cases, intractable task. Using single aerosol particle spectroscopy measurements and an effective oscillator model, we are able to measure parameters that can be used to accurately calculate the wavelength-dependent RI of mixed organic–inorganic aqueous aerosol particles. Measured oscillator parameters are presented for a number of atmospherically relevant inorganic ions and surrogate organic species. Finally, the effect of temperature on the oscillator parameters is investigated.
Hygroscopic aerosol in the atmosphere undergoes changes in composition as it travels through air of varying relative humidity (RH) by taking up or losing water to remain in equilibrium with its surroundings. This change in composition alters aerosol optical properties as the concentration of solute changes.1 Refractive index (RI) is an important parameter when calculating the scattering and absorption of electromagnetic radiation by aerosol. Due to the broad spectrum of the Sun, it is necessary to ascertain the RI over the full visible spectrum.2 Although the RI is a complex quantity with the real part describing scattering and the imaginary part describing absorption, the imaginary part of the RI for weakly absorbing hygroscopic aerosol in the visible region is often on the order of 10−9–10−8 and is commonly approximated as zero.3,4
The real and imaginary parts of the RI are linked through a causal connection described by the Kramers–Kronig relation.5 Even in a weakly absorbing medium, the real part of the RI is tied to absorption. For instance, it is the tail of strong electron transitions in the far-ultraviolet (UV) which gives rise to the RI in the visible region for weakly absorbing aqueous solutions.4,6 These far-UV transitions can be observed spectroscopically thanks to advances in far-UV spectroscopy which overcome the strong absorption at short wavelengths (140–200 nm) and allow for the characterization of electronic transitions, e.g. Rydberg and π–π* transitions in liquids and solids.7 We have previously shown that for the purposes of calculating the RI of aqueous solutions in the visible region, all of these transitions can be accurately represented with a single effective oscillator that describes absorption of light at UV energies or greater. For solute α, the oscillator is characterized by a resonant wavenumber, ![[small nu, Greek, tilde]](https://www.rsc.org/images/entities/i_char_e0e1.gif) 0,α, a constant,
0,α, a constant, ![[B with combining tilde]](https://www.rsc.org/images/entities/i_char_0042_0303.gif) α, and a full-width at half-maximum,
α, and a full-width at half-maximum,  . Only
 ![[small nu, Greek, tilde]](https://www.rsc.org/images/entities/i_char_e0e1.gif) 0,α and
0,α and ![[B with combining tilde]](https://www.rsc.org/images/entities/i_char_0042_0303.gif) α are required to calculate the real part of the RI, n(ν), which, for an aqueous solution containing J solutes, is
α are required to calculate the real part of the RI, n(ν), which, for an aqueous solution containing J solutes, is
 | (1) |
Mie resonance spectroscopy measurements on single, optically trapped particles were taken using two previously described setups3,8 and used here to determine the wavelength-dependent RI of many different binary aqueous droplets across a range of RHs. Experimental details are provided in the ESI.† Mie resonance peaks from either broadband scattering or cavity-enhanced Raman scattering (CERS) spectra were fitted to obtain droplet size and RI using the MRFIT algorithm.9 With these single particle RI measurements, we were able to fit oscillator parameters for inorganic ions by simultaneously minimizing the error across all measurements using a modified version of our previous fitting scheme.4 Hygroscopic and low volatility solutes of either direct atmospheric relevance or relevance as surrogates were chosen for this study. The retrieved parameters for both organic solutes and inorganic ions are tabulated in Table 1. With the exception of Li+, all of the ions in Table 1 are of tropospheric relevance.10
| Species |
![[B with combining tilde]](https://www.rsc.org/images/entities/i_char_0042_0303.gif) α
(μm−1)
α
(μm−1) |
![[small nu, Greek, tilde]](https://www.rsc.org/images/entities/char_e0e1.gif) 0,α (μm−1) 0,α (μm−1) |
Species |
![[B with combining tilde]](https://www.rsc.org/images/entities/i_char_0042_0303.gif) α
(μm−1)
α
(μm−1) |
![[small nu, Greek, tilde]](https://www.rsc.org/images/entities/i_char_e0e1.gif) 0,α (μm−1)
0,α (μm−1) |
|---|---|---|---|---|---|
| NH4+ | 3.75 | 5.93 | Br− | 7.10 | 8.69 |
| Ca2+ | 8.81 | 8.95 | NO3− | 5.86 | 8.41 |
| Li+ | 4.96 | 7.30 | H+ | 0.00 | 0.00 |
| Mg2+ | 7.41 | 7.12 | Malonic acid | 6.82 | 9.76 |
| Na+ | 6.40 | 9.70 | Glutaric acid | 6.99 | 9.64 |
| K+ | 5.79 | 9.60 | Citric acid | 7.80 | 10.37 |
| Cl− | 9.59 | 11.10 | Tartaric acid | 7.83 | 10.35 |
| HSO4− | 5.19 | 7.48 | Sucrose | 9.26 | 11.49 |
| SO42− | 12.37 | 15.95 | Mannose | 8.80 | 10.91 |
In Fig. 1, we compare the n(ν) calculated using eqn (1) and the appropriate ![[small nu, Greek, tilde]](https://www.rsc.org/images/entities/i_char_e0e1.gif) 0,α and
0,α and ![[B with combining tilde]](https://www.rsc.org/images/entities/i_char_0042_0303.gif) α from Table 1 to a wide range of measurements,11,12 including those taken here, at λ = 0.589 μm (the sodium D-line, the wavelength where the RI is typically measured with an Abbe refractometer). The agreement is excellent, although in some cases discrepancies are seen between the calculation and the single particle measurements at high mass fractions. As these cases are above the bulk solubility limit, these metastable droplets may have undergone a phase change and the measurements may no longer be representative of a well-mixed solution leading to the observed differences. For example, KNO3 has been found to dry slowly, never undergoing efflorescence but becoming highly concentrated and MgSO4 forms a gel under low RH conditions.13,14
α from Table 1 to a wide range of measurements,11,12 including those taken here, at λ = 0.589 μm (the sodium D-line, the wavelength where the RI is typically measured with an Abbe refractometer). The agreement is excellent, although in some cases discrepancies are seen between the calculation and the single particle measurements at high mass fractions. As these cases are above the bulk solubility limit, these metastable droplets may have undergone a phase change and the measurements may no longer be representative of a well-mixed solution leading to the observed differences. For example, KNO3 has been found to dry slowly, never undergoing efflorescence but becoming highly concentrated and MgSO4 forms a gel under low RH conditions.13,14
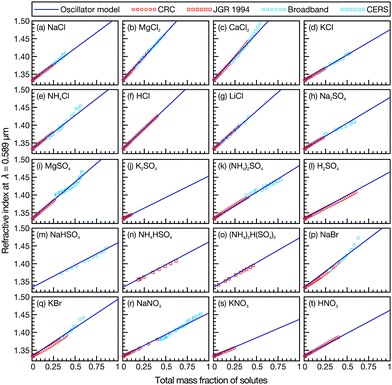 | ||
| Fig. 1 Comparison between bulk refractometer measurements (red points), single particle measurements (blue points), and effective oscillator calculation (solid line) for various aqueous inorganic solutions as a function of mass fraction of solute. All RI measurements are at λ = 0.589 μm. Bulk measurements are from either ref. 11 (labeled ‘CRC’) or ref. 12 (labeled ‘JGR 1994’). | ||
Evaluating the accuracy of the wavelength-dependent calculations is more challenging as there is a dearth of suitable measurements in the literature. However, aqueous NaCl is the exception and its wavelength-dependent RI has been well-studied. In Fig. 2a, we compare the RI of aqueous NaCl calculated using the effective oscillator model (eqn (1) and the parameters for Na+ and Cl− in Table 1) to previous RI results for the same system. Fig. S2 in the ESI† shows the percent difference between the previous results and the oscillator model. Discrepancies appear at low water activities (high mass fractions of solute) and at short wavelengths. With the exception of the parameterization from Cotterell et al. at water activities of 0.5 and 0.6, the oscillator model agrees with the previous aqueous NaCl results to within 1%. In Fig. 2b, we consider a solution with more species present (a 1![[thin space (1/6-em)]](https://www.rsc.org/images/entities/char_2009.gif) :
:![[thin space (1/6-em)]](https://www.rsc.org/images/entities/char_2009.gif) 1 molar mixture of MgSO4 and MgCl2). The oscillator model calculation matches extremely well with our CERS measurements over a wide range of water activities, demonstrating its potential for wavelength-dependent RI calculations of complex multicomponent inorganic mixtures using mass fractions and parameters from Table 1.
1 molar mixture of MgSO4 and MgCl2). The oscillator model calculation matches extremely well with our CERS measurements over a wide range of water activities, demonstrating its potential for wavelength-dependent RI calculations of complex multicomponent inorganic mixtures using mass fractions and parameters from Table 1.
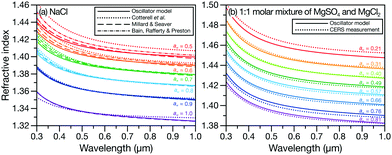 | ||
Fig. 2 Comparison between the wavelength-dependent RI at various water activities, aw, for (a) aqueous NaCl calculated using the effective oscillator model and parameterizations from ref. 4, 15 and 16, and (b) aqueous 1![[thin space (1/6-em)]](https://www.rsc.org/images/entities/char_2009.gif) : :![[thin space (1/6-em)]](https://www.rsc.org/images/entities/char_2009.gif) 1 molar mixture of MgSO4 and MgCl2 calculated using the effective oscillator model and single particle CERS measurements. For the effective oscillator calculation, mass fractions here and in Fig. 3c were determined from water activities using the AIOMFAC model.17,18 1 molar mixture of MgSO4 and MgCl2 calculated using the effective oscillator model and single particle CERS measurements. For the effective oscillator calculation, mass fractions here and in Fig. 3c were determined from water activities using the AIOMFAC model.17,18 | ||
Next, we consider organic solutes. It has been estimated that more than 10![[thin space (1/6-em)]](https://www.rsc.org/images/entities/char_2009.gif) 000 unique organic compounds have been measured in the atmosphere.19 Volatile organic compounds (VOCs) emitted either biogenically or anthropogenically undergo oxidation in the atmosphere principally by hydroxyl radicals, ozone, nitrate radicals or photolysis. The oxidant, as well as the temperature and RH all play a role in the subsequent reaction pathway; with different conditions often leading to different products. The oxidation of VOCs generates more polar organic molecules containing functional groups such as alcohols, aldehydes, carboxylic acids and ketones making these molecules less volatile and more water soluble than their precursors. These oxidized organics can then condense to form secondary organic aerosol (SOA).20 As thousands of unique oxidized molecules can make up the organic fraction of aerosol,21 it is a near impossible task to determine how each of these molecules affects aerosol properties, including the aerosol optical properties necessary for climate modeling. Aerosol mass spectrometry allows for the rapid determination of aerosol properties, but detailed structural information requires time consuming molecular separation.20
000 unique organic compounds have been measured in the atmosphere.19 Volatile organic compounds (VOCs) emitted either biogenically or anthropogenically undergo oxidation in the atmosphere principally by hydroxyl radicals, ozone, nitrate radicals or photolysis. The oxidant, as well as the temperature and RH all play a role in the subsequent reaction pathway; with different conditions often leading to different products. The oxidation of VOCs generates more polar organic molecules containing functional groups such as alcohols, aldehydes, carboxylic acids and ketones making these molecules less volatile and more water soluble than their precursors. These oxidized organics can then condense to form secondary organic aerosol (SOA).20 As thousands of unique oxidized molecules can make up the organic fraction of aerosol,21 it is a near impossible task to determine how each of these molecules affects aerosol properties, including the aerosol optical properties necessary for climate modeling. Aerosol mass spectrometry allows for the rapid determination of aerosol properties, but detailed structural information requires time consuming molecular separation.20
Attenuated total reflection far-UV (ATR-FUV) spectra of linear hydrocarbons and isomers of C6H14 (see Fig. 4 in ref. 7) show maximum absorptions at wavelengths ≈150 nm with a slight red shift and increase in peak intensity with increased molar mass. ATR-FUV spectra of aliphatic and branched ketones show a shift in peak intensity to ≈160 nm as does methanol. Unfortunately, there are only examples of ATR-FUV spectra for few classes of organic molecules. Nevertheless, these examples demonstrate that the far-UV transitions of organic molecules of similar size and functionality are alike. As these transitions govern RI in the visible region, this observation suggests that they will also have similar RIs. Efforts have previously been made to predict the RI of SOA based on quantitative structural properties22 and to predict the RI of pure component organics using group contribution models.23–25 However, these models predict the RI at a single wavelength, neglecting dispersion, and consider only dry conditions. It would be beneficial to determine the RI of the organic fraction over a range of water contents and over the full visible spectrum using only these predictors routinely determined for ambient aerosol.
In Fig. 3a, the RI at λ = 0.589 μm for three classes of organic molecules are plotted as function of solute mass fraction in water. Many of the molecules in the three groups highlighted in Fig. 3a are often chosen as surrogate species for the organic material that is present in SOA.26–28 When their RIs are plotted as a function of solute mass fraction, these molecules become grouped by their listed classes (with a couple of exceptions). Fig. 3b indicates that this should also apply to the wavelength-dependent RI. We compare oscillator calculations using parameters from aqueous sucrose and aqueous mannose measured here and see that, when their mass fractions are the same, the plotted curves are nearly identical. However, in Fig. 3a we also see that tartaric and malic acid are not grouped with the other 12 dicarboxylic acids. This is likely because, unlike those other dicarboxylic acids, tartaric and malic acid also contain hydroxyl groups. Therefore, using representative species for groups of components in a complex organic mixture can be a suitable approach for RI calculations but the classification of molecules needs to be carefully considered. Alternatively, a group contribution approach could be developed but that is beyond the scope of the current work. Fig. 3c shows the measured and calculated wavelength-dependent RI of an aqueous organic–inorganic droplet (containing sucrose, Na+, and Cl−). There is a very close match between the measurement and the effective oscillator calculation when the correct sucrose–NaCl mixing ratio is used in the model. The calculated RI for both aqueous sucrose and aqueous NaCl are also shown to emphasize that ignoring either the organic or inorganic component in the aqueous organic–inorganic calculation will not yield an accurate prediction of the RI.
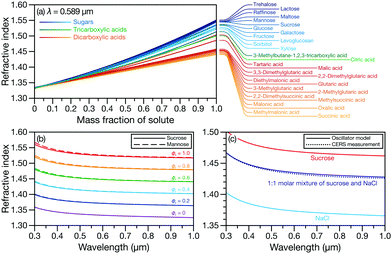 | ||
Fig. 3 (a) Comparison between the RI at λ = 0.589 μm for organic solutes in water. Measurements in (a) were taken from various sources11,26–28 and were either plotted using the reported parameterization or fitted here as a function of solute mass fraction. Comparison between the wavelength-dependent RI for (b) aqueous sucrose and aqueous mannose at various solute mass fractions, ϕs, and (c) aqueous 1![[thin space (1/6-em)]](https://www.rsc.org/images/entities/char_2009.gif) : :![[thin space (1/6-em)]](https://www.rsc.org/images/entities/char_2009.gif) 1 molar mixture of sucrose and NaCl calculated using the effective oscillator model and single particle CERS measurements at a water activity of 0.81. 1 molar mixture of sucrose and NaCl calculated using the effective oscillator model and single particle CERS measurements at a water activity of 0.81. | ||
We now apply the effective oscillator model to waters found in oceans and atmospheric aerosol by considering the specific examples of brine and polar stratospheric aerosol. In both cases, we will need to consider the effect of temperature on the RI. If we assume that its main effect will be on ![[B with combining tilde]](https://www.rsc.org/images/entities/i_char_0042_0303.gif) α rather than
α rather than ![[small nu, Greek, tilde]](https://www.rsc.org/images/entities/i_char_e0e1.gif) 0,α, then we can expand
0,α, then we can expand ![[B with combining tilde]](https://www.rsc.org/images/entities/i_char_0042_0303.gif) α as a first-order Taylor series around the temperature where the oscillator parameter was measured, T0, to yield
α as a first-order Taylor series around the temperature where the oscillator parameter was measured, T0, to yield ![[B with combining tilde]](https://www.rsc.org/images/entities/i_char_0042_0303.gif) α(T) =
α(T) = ![[B with combining tilde]](https://www.rsc.org/images/entities/i_char_0042_0303.gif) α(T0) +
α(T0) + ![[B with combining tilde]](https://www.rsc.org/images/entities/i_char_0042_0303.gif) α′(T0)(T − T0), where
α′(T0)(T − T0), where ![[B with combining tilde]](https://www.rsc.org/images/entities/i_char_0042_0303.gif) α(T0) corresponds to the values listed in Table 1 and, in this work,
α(T0) corresponds to the values listed in Table 1 and, in this work, ![[B with combining tilde]](https://www.rsc.org/images/entities/i_char_0042_0303.gif) α′(T0) will simply be set to
α′(T0) will simply be set to ![[B with combining tilde]](https://www.rsc.org/images/entities/i_char_0042_0303.gif) α′(T0) = κ
α′(T0) = κ![[B with combining tilde]](https://www.rsc.org/images/entities/i_char_0042_0303.gif) α(T0) where κ is a constant. As will be demonstrated, for the atmospheric and oceanic systems considered here, this is the only modification to the oscillator model that is needed to satisfactorily account for the effect of temperature on the calculated RI.
α(T0) where κ is a constant. As will be demonstrated, for the atmospheric and oceanic systems considered here, this is the only modification to the oscillator model that is needed to satisfactorily account for the effect of temperature on the calculated RI.
In Fig. 4, the composition29 and RI30 of sea ice brine at sub-zero temperatures are shown. The multicomponent solution contains six different ions whose mass fractions change with temperature (Fig. 4a). In Fig. 4b, it can be seen that if the temperature dependence is ignored, the oscillator model calculations are systematically too small. However, if a temperature dependence is included in the model, the agreement is excellent.
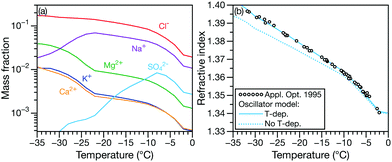 | ||
| Fig. 4 (a) Mass fraction of inorganic ions in sea-water29 and (b) corresponding RI measurements at λ = 0.589 μm.30 In (b) the RI calculated using the effective oscillator model is shown without (dotted line) and with (solid line) a temperature dependence (κ = −0.0010 K−1). | ||
Polar stratospheric clouds are primarily composed of supercooled particles containing H2O, H2SO4, and HNO3.31Fig. 5 compares measurements32 for one such ternary solution at four different wavelengths to oscillator calculations for temperatures from −60 °C to 30 °C. The model has satisfactory agreement with the experimental data in the visible region but becomes inaccurate in the UV (similar to the results in Fig. 2a).
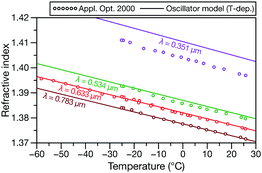 | ||
| Fig. 5 RI measurements at four different wavelengths for an aqueous solution containg H2SO4 and HNO3 (ϕH2SO4 = 0.1741 and ϕHNO3 = 0.1741) from ref. 32 compared to the temperature-dependent effective oscillator model (κ = −0.0015 K−1). | ||
In summary, with oscillator parameters that are measured using Mie resonance spectroscopy and presented here, the effective oscillator model can be used to accurately calculate the wavelength-dependent and temperature-dependent RI for weakly absorbing aqueous media containing both inorganic ions and organic solutes. Mixing rules based on mass fractions allow for the straightforward calculation of the wavelength-dependent RI of multicomponent aqueous inorganic–organic solutions. The focus of our attention and results has been on aqueous systems that are relevant to hygroscopic tropospheric and stratospheric aerosol particles but we have also considered one case that is relevant to the liquid water phase in sea ice. Therefore, the effective oscillator model from this work could also be applied without any modifications to waters in oceans, rivers, and lakes. We plan to more fully explore temperature effects on the RI in future work.
T. C. P. acknowledges support from the Natural Sciences and Engineering Research Council of Canada (NSERC). A. B. and T. C. P. would like to thank Andreas Zuend for providing AIOMFAC calculations for aqueous sucrose and NaCl used in Fig. 3c. We would also like to thank Chen Cai for providing us with the data sets from ref. 33 that we fitted to determine the oscillator parameters for glutaric and malonic acid.
Conflicts of interest
There are no conflicts to declare.References
- J. S. Walker, J. B. Wills, J. P. Reid, L. Wang, D. O. Topping, J. R. Butler and Y. H. Zhang, J. Phys. Chem. A, 2010, 114, 12682–12691 CrossRef CAS PubMed.
- M. J. Alvarado, C. R. Lonsdale, H. L. MacIntyre, H. Bian, M. Chin, D. A. Ridley, C. L. Heald, K. L. Thornhill, B. E. Anderson, M. J. Cubison, J. L. Jimenez, Y. Kondo, L. K. Sahu, J. E. Dibb and C. Wang, Atmos. Chem. Phys., 2016, 16, 9435–9455 CrossRef CAS.
- A. Rafferty and T. C. Preston, Phys. Chem. Chem. Phys., 2018, 20, 17038–17047 RSC.
- A. Bain, A. Rafferty and T. C. Preston, Geophys. Res. Lett., 2019, 46, 10636–10645 CrossRef CAS.
- V. Lucarini, J. J. Saarinen, K.-E. Peiponen and E. M. Vartiainen, Kramers-Kronig relations in optical materials research, Springer Science & Business Media, 2005, vol. 110 Search PubMed.
- J. Gienger, H. Groß, J. Neukammer and M. Bär, Appl. Opt., 2016, 55, 8951–8961 CrossRef CAS PubMed.
- Y. Ozaki and I. Tanabe, Analyst, 2016, 141, 3962–3981 RSC.
- L. J. N. Lew, M. V. Ting and T. C. Preston, Appl. Opt., 2018, 57, 4601–4609 CrossRef CAS PubMed.
- T. C. Preston and J. P. Reid, J. Opt. Soc. Am. A, 2015, 32, 2210–2217 CrossRef PubMed.
- A. W. Stelson, Environ. Sci. Technol., 1990, 24, 1676–1679 CrossRef CAS.
- J. R. Rumble, CRC handbook of chemistry and physics, CRC Press, 100th edn, 2019 Search PubMed.
- I. N. Tang and H. R. Munkelwitz, J. Geophys. Res., 1994, 99, 18801–18808 CrossRef.
- E. J. Freney, S. T. Martin and P. R. Buseck, Aerosol Sci. Technol., 2009, 43, 799–807 CrossRef CAS.
- J. F. Davies and K. R. Wilson, Anal. Chem., 2016, 88, 2361–2366 CrossRef CAS PubMed.
- R. Millard and G. Seaver, Deep Sea Res., Part I, 1990, 37, 1909–1926 CrossRef.
- M. I. Cotterell, R. E. Willoughby, B. R. Bzdek, A. J. Orr-Ewing and J. P. Reid, Atmos. Chem. Phys., 2017, 17, 9837–9851 CrossRef CAS.
- A. Zuend, C. Marcolli, B. P. Luo and T. Peter, Atmos. Chem. Phys., 2008, 8, 4559–4593 CrossRef CAS.
- A. Zuend, Aerosol Inorganic–Organic Mixtures Functional groups Activity Coefficients (AIOMFAC) website and online model, 2019, https://aiomfac.lab.mcgill.ca, last accessed: 2019-11-28.
- A. H. Goldstein and I. E. Galbally, Environ. Sci. Technol., 2007, 41, 1514–1521 CrossRef CAS PubMed.
- M. Hallquist, J. C. Wenger, U. Baltensperger, Y. Rudich, D. Simpson, M. Claeys, J. Dommen, N. M. Donahue, C. George, A. H. Goldstein, J. F. Hamilton, H. Herrmann, T. Hoffmann, Y. Iinuma, M. Jang, M. E. Jenkin, J. L. Jimenez, A. Kiendler-Scharr, W. Maenhaut, G. McFiggans, T. F. Mentel, A. Monod, A. S. Prévôt, J. H. Seinfeld, J. D. Surratt, R. Szmigielski and J. Wildt, Atmos. Chem. Phys., 2009, 9, 5155–5236 CrossRef CAS.
- C. George, M. Ammann, B. D'Anna, D. J. Donaldson and S. A. Nizkorodov, Chem. Rev., 2015, 115, 4218–4258 CrossRef CAS PubMed.
- H. Redmond and J. E. Thompson, Phys. Chem. Chem. Phys., 2011, 13, 6872–6882 RSC.
- F. Gharagheizi, P. Ilani-Kashkouli, A. Kamari, A. H. Mohammadi and D. Ramjugernath, J. Chem. Eng. Data, 2014, 59, 1930–1943 CrossRef CAS.
- C. Cai, A. Marsh, Y. H. Zhang and J. P. Reid, Environ. Sci. Technol., 2017, 51, 9683–9690 CrossRef CAS PubMed.
- R. Bouteloup and D. Mathieu, Phys. Chem. Chem. Phys., 2018, 20, 22017–22026 RSC.
- D. M. Lienhard, D. L. Bones, A. Zuend, U. K. Krieger, J. P. Reid and T. Peter, J. Phys. Chem. A, 2012, 116, 9954–9968 CrossRef CAS PubMed.
- D. M. Lienhard, A. J. Huisman, U. K. Krieger, Y. Rudich, C. Marcolli, B. P. Luo, D. L. Bones, J. P. Reid, A. T. Lambe, M. R. Canagaratna, P. Davidovits, T. B. Onasch, D. R. Worsnop, S. S. Steimer, T. Koop and T. Peter, Atmos. Chem. Phys., 2015, 15, 13599–13613 CrossRef CAS.
- C. Cai, R. E. Miles, M. I. Cotterell, A. Marsh, G. Rovelli, A. M. Rickards, Y. H. Zhang and J. P. Reid, J. Phys. Chem. A, 2016, 120, 6604–6617 CrossRef CAS PubMed.
- C. Richardson, J. Glaciol., 1976, 17, 507–519 CrossRef CAS.
- G. A. Maykut and B. Light, Appl. Opt., 1995, 34, 950–961 CrossRef CAS PubMed.
- J. Schreiner, C. Voigt, A. Kohlmann, F. Arnold, K. Mauersberger and N. Larsen, Science, 1999, 283, 968–970 CrossRef CAS PubMed.
- U. K. Krieger, T. Peter, B. Luo, U. Weers and J. C. Mössinger, Appl. Opt., 2000, 39, 3691–3703 CrossRef CAS PubMed.
- C. Cai, D. J. Stewart, J. P. Reid, Y.-H. Zhang, P. Ohm, C. S. Dutcher and S. L. Clegg, J. Phys. Chem. A, 2015, 119, 704–718 CrossRef CAS PubMed.
Footnote |
| † Electronic supplementary information (ESI) available. See DOI: 10.1039/d0cc02737e |
| This journal is © The Royal Society of Chemistry 2020 |
