 Open Access Article
Creative Commons Attribution 3.0 Unported Licence
Carbon nanodots from orange peel waste as fluorescent probes for detecting nitrobenzene†
Cinzia
Michenzi
 *a,
Anacleto
Proietti
a,
Marco
Rossi
 a,
Claudia
Espro
b,
Viviana
Bressi
b,
Fabrizio
Vetica
 c,
Beatrice
Simonis
d and
Isabella
Chiarotto
 *a
*a
aDepartment of Basic and Applied Sciences for Engineering (SBAI), Sapienza University of Rome, Via Castro Laurenziano, 7, 00161 Rome, Italy. E-mail: cinzia.michenzi@uniroma1.it
bDepartment of Engineering, University of Messina, Contrada di Dio–Vill. S. Agata, I-98166 Messina, Italy
cDepartment of Chemistry, Sapienza University of Rome, Piazzale Aldo Moro, 5, 00185 Rome, Italy
dInstitute for Biological Systems of Italian National Research Council (ISB-CNR), Secondary Office of Rome-Reaction Mechanisms c/o Department of Chemistry, Sapienza University of Rome, Piazzale Aldo Moro 5, 00185 Rome, Italy
First published on 2nd February 2024
Abstract
Nitro aromatic compounds have been recognized as hazardous and carcinogenic substances for more than three decades. However, even today, they persist as pervasive pollutants in water, soil, and air. Consequently, the development of innovative, user-friendly, and dependable platforms for their rapid and efficient detection remains crucial from both environmental and health perspectives. In this study, we explore the conversion of biomass waste into valuable nanomaterials, specifically carbon dots. These bio-derived carbon dots exhibit promising photoluminescence properties and are effectively utilized as fluorescent chemical probes for the detection of nitrobenzene, all without the need for additional late-stage functionalization or surface modification. The insights gained from this research can contribute to the development of an environmentally friendly and sustainable approach to nitrobenzene detection. Notably, our research highlights that unmodified carbon dots in an aqueous solution can detect low concentrations of nitrobenzene.
Sustainability spotlightNitrobenzene is a nitroaromatic compound used in many industry processes; it is extremely toxic for human health and also hazardous to aquatic environments, so its presence in water reservoirs and marine ecosystems should be considered a global issue. In accordance with UN Sustainable Development Goals aimed at addressing eutrophication and promoting the conservation of aquatic life (SDG14), while also ensuring access to clean water for all (SDG6), this study demonstrates the utility of carbon dots derived from orange peel waste in efficiently detecting nitrobenzene in aqueous media through their fluorescence properties. Furthermore, the described methodology has a low environmental impact (aligned with SDG13) as it involves the conversion of biomass into nanoparticles through a simple electrochemical procedure (SDG12). This is obtained without the use of any organic solvents and allows for sensing without any chemical functionalization. |
Introduction
Nitro aromatic compounds (NACs) have been identified as toxic and cancerogenic substances for over 30 years, and yet they continue to persist as pervasive pollutants in water, soil, and air even in the present day.1 This is due to the extensive use of NACs in various industrial processes, such as pesticides,2 rubber,3 dyes,4 explosives,5 and pharmaceutical production.6 They are also dispersed into the environment by diesel and gasoline engines emission, among other sources.7 Furthermore, their chemical properties make their degradation and disposal particularly problematic.8 Nitrobenzene (NB) is a nitroaromatic compound known for inducing multi-organ toxicity through various exposure routes and displaying a propensity for bioaccumulation. It finds extensive application as an intermediate in the manufacturing of anilines and as a solvent in industrial syntheses.9 As a result of its widespread use in manufacturing, the presence of NB in water bodies is common. Consequently, there is an urgent demand for innovative tools to detect its presence. Therefore, the scientific community is actively dedicated to an ongoing effort aimed at developing materials and techniques for the straightforward and cost-effective detection of NACs.10,11In recent years, there has been a significant emphasis on the development of sustainable processes for reusing industrial materials and biomass waste, with the goal of transforming them into valuable products and materials. Considering both economic and environmental aspects, industrial and agricultural process waste offers a compelling opportunity due to its cost-effectiveness and the potential to reclaim valuable by-products for recycling and reuse. Agro-industrial waste can produce significant quantities of valuable organic compounds that can be reused such as fuel, chemicals, power generation, electricity and others.12 In the production of orange juice, substantial amounts of solid waste are generated. Effectively addressing these residues presents a substantial challenge for the sustainable recovery of natural resources.13,14
In the last two decades, a distinct category of carbon nanomaterials has captured significant attention within the scientific community, for both nanomaterial sciences and biomass reconversion: carbon quantum dots (CDs). These nanomaterials represent an innovative class of nanoparticles with a broad spectrum of applications.15 CDs have attracted significant attention owing to their fluorescence properties, chemical stability, minimal toxicity, environmental friendliness, affordability, and strong biocompatibility.16 Due to their unique properties, CDs find applications in various fields, including biomedicine, catalysis, and chemical sensing for a diverse range of analytes such as cations, anions, and small molecules.17 The synthetic methods used for preparing CDs may involve the utilization of biomass or renewable natural resources derived from sources such as plants, vegetables, fruits, beverages, juices, and organic waste in general.18
These precursors serve as excellent resources for CD synthesis due to their eco-friendly nature, cost-effectiveness, and abundant availability as carbon sources. Consequently, producing CDs from natural resources offers a promising means of converting low-value waste into high-value products. Moreover, the diverse composition of biomass yields CDs with various functional groups, thereby enhancing their water solubility and photoluminescence properties.19 Hence, CDs derived from biomass exhibit remarkable water solubility attributed to their inherent functionality.20 They also exhibit strong fluorescence without the need for additional surface treatment and display variable quantum yields, typically falling within the range of 2% to 6%, and in some instances, reaching up to 20%.21
We have recently directed our research focus towards the electrochemical (EC) valorization of high-value molecules that remain within biomass. This involves the bottom-up synthesis of CDs through electrochemical methods.22,23 Specifically, by utilizing the aqueous solution produced through the hydrothermal carbonization of these agri-food waste materials, we have successfully showcased the feasibility of obtaining CDs with high yields using a straightforward, reproducible, and environmentally friendly electrochemical bottom-up approach. We employed these high-quality CDs as effective catalysts for Knoevenagel condensation23 and utilized them to modify electrodes, resulting in the development of electrochemical sensors for the detection of nitrobenzene in wastewater.22
Indeed, the electrochemical (EC) approach serves as an efficient and easily reproducible method for synthesizing high-quality CDs.24 The popularity of electricity as an inexpensive and easily adjustable reagent in electrochemical redox processes is further augmented by the effective conversion of biomass through a circular chemistry approach.25 Therefore, within the realm of CD production from biomass waste, our EC method stands out as a highly innovative and unprecedented application where biomass components such as alcohols, phenols and 5-HMF are harnessed as precursors for their valorization.25,26
The objective of this study is to utilize the intrinsic photoluminescence (PL) characteristics of CDs obtained from waste materials to facilitate the straightforward detection of NB in water, without requiring any subsequent surface modifications. To enable a meaningful comparison, our developed method will be evaluated in conjunction with other instrumental techniques that employ CDs for the detection of nitrobenzene.
Experimental
Materials and methods
All reagents, used in this paper, were analytical-grade reagents purchased from Sigma-Aldrich and were used as received. Ultrapure water (18.2 MΩ cm−1) from a Milli-Q ultrapure system was used in this study.Fluorescence and UV-vis absorption measurements
Fluorescence measurements were performed with a Fluoromax-3 Horiba Jobin–Yvon fluorometer (T = 25 °C). All collected data were corrected by means of a built-in program to counterbalance the decay in sensitivity in the near infrared region and divided using the corrected reference detector; the nanomaterial water dispersions were analyzed at a concentration of 100 ng mL−1 exciting the samples at a fixed wavelength of 370 nm.UV-vis absorption spectra were obtained with an Agilent 8453 spectrophotometer and Agilent ChemStation for UV-visible spectroscopy. Five distinct concentrations of CD aqueous solutions were prepared (80, 70, 60, 50 and 40 μg mL−1) and 2.5 mL of each solution were transferred into a quartz cuvette in order to collect the UV-vis absorption spectrum.
CD synthesis and characterization
The electrochemical synthesis of CDs is performed in a glass vial by adding 2.5 mL (0.121 g mL−1) of aqueous solution obtained from hydrothermal carbonization of orange peel waste at 180 °C for 1 hour and 2.5 mL of ammonia 30%.22 A static potential (8 V) is applied at the mixture through two platinum spiral wires (1 cm2 apparent area) and a stabilizer (DC) power supply (KERT KAT4VD 1–30 VDC 4 A) for 2.5 h at room temperature (25 °C). After that, the crude product is centrifuged for 10 minutes at 6000 rpm (ALC Centrifugette 4206) and then the supernatant is dialyzed using a dialysis membrane (MWCO 0.1–0.5 kD) against ultrapure water for 72 h changing it every 24 h. At last CDs are isolated evaporating water at reduced pressure. The CD samples underwent characterization using various techniques. All data related to this characterization were previously reported.22,23Raman spectra were collected using a confocal in Via™ Raman spectrometer (from Renishaw), with 250 mm focal length. The specimens were analyzed at room temperature in the 180–1940 cm−1 spectral range focusing the analysis of interest between 1000 and 1900 cm−1. The signal is dispersed using a holographic grating of 1800 mm−1 and collected using a Peltier-cooled CCD detector. The laser source used to excite the sample is manufactured by Renishaw and has a wavelength of 532.1 nm with an output power of 50 mW. The laser beam was focused onto the sample through a 100 × N-Plan objective (NA = 0.88, WD = 0.33 mm). The acquired Raman spectra were processed using the software WiRE™ 4.4 to normalize the spectra and to remove the baseline for fitting procedures and to obtain peak positions the software Origin 2021 Pro was used. The laser power impinging on the samples was set to 2.5 mW with an exposure time of 1 s and 30 accumulations. The peak positions were calibrated using both an internal and an external reference of silicon.
Quantum yield
The quantum yield (QY) of the CDs was determined based on a previously established procedure.27 Typically, quinine sulfate (literature quantum yield 0.54) in 0.1 M H2SO4 aqueous solution was used as the reference.28 In order to minimize reabsorption effects, the aqueous suspension of CDs and the aqueous solution of the reference sample were diluted to keep the UV absorption suitable intensity below 0.1 for both, at the excitation wavelength 370 nm. The QY of the CDs was calculated using the eqn (1) below: | (1) |
Detection test of small molecules using CD PL properties
A standard solution of 50 mL of CDs (30 μg mL−1) in distilled water was prepared. The concentration was chosen to keep the UV absorption below 0.1. Standard solutions of each single analyte 4-nitrobenzoic acid (4NBAc), 4-nitrotoluene (4NT), 4-nitrophenol (4NP), 4-nitrobenzaldehyde (4NBA), 1,4-dinitrobenzene (1,4DNB), nitrobenzene (NB) and 4-chloronitrobenzene (4ClNB) at a concentration of 210 μM were prepared; 2 mL of the standard CD solution (STD-CDs) were transferred to a vial after 15 minutes of sonication. A total of eight vials were prepared, one for the blank/control and the others for each analyte. A standard solution (100 μL) of analyte was added to the corresponding CD solution, adding only 100 μL of water for the control sample. Each of the obtained solutions contained a 10 μM concentration of one analyte. The obtained solutions were stirred at room temperature for 15 minutes, before recording the emission fluorescence spectra.To evaluate the sensitivity for NB different aliquots of the standard solution (210 μM) were added to 2.5 mL of STD-CD solution (27.5 μg mL−1), to investigate a range of concentrations of the analyte from 0.16 μM to 36.6 μM (0.16, 0.59, 1, 2, 3.96, 8.70, 17.55 and 36.6 μM). The PL spectrum was recorded after each addition. Maximum fluorescence values at λ = 438 nm observed at different analyte concentrations (F) have been normalized with the PL intensity at 438 nm of the blank sample prepared following the same procedure but adding water instead of analyte standard solution (F0). To calculate the standard deviation every measure has been repeated three times. To evaluate the impact of ionic strength, we monitored PL emission intensity by increasing concentrations of NaCl up to 1.64 mM. This approach aims to more accurately replicate the conditions of the real seawater sample. So in a vial with 2 mL of STD-CDs and in the presence of 10 μM of NB an increasing amount of a standard solution of NaCl (40 mM) has been added investigating a concentration range from 0 to 1.65 mM of NaCl (0, 0.19, 0.38, 0.75 and 1.64 mM). Once again, each spectrum has been recorded three times, and the fluorescence intensity at 438 nm (F) for various concentrations has been normalized with the PL intensity of the blank sample (F0). Additionally, a selectivity test for NB in the presence of NaCl and KCl was performed by preparing two vials containing 2.5 mL of the same STD-CD solution and adding respectively: a standard solution of nitrobenzene, to reach a final concentration of 10 μM; a standard solution of all previously used analytes, except 2NBAc, with the addition of KCl and NaCl to reach a final concentration of all compounds of 10 μM. The PL spectra of these two vials together with an additional control sample were then recorded and every spectrum has been recorded three times. To examine the influence of pH on the fluorescence intensity of the CDs in the design of the NB detection process, CD solutions with varying pH values, ranging from 3 to 11, were prepared using NaOH (0.1 M) and HCl (0.1 M). The PL intensity at 438 nm was recorded at each pH (F) and normalized with that of the control sample (F0). Each measurement was repeated three times.
Lastly, the sensor's stability was evaluated by monitoring the fluorescence emission at 438 nm through PL measurements taken three times every 15 minutes over an hour after adding 100 μL of NB standard solution to 2 mL of STD-CDs.
Results and discussion
Our research is motivated by a growing concern for environmental issues, leading to the development of more eco-friendly methods for synthesizing CDs. It is essential to emphasize that we did not employ volatile organic solvents (VOCs) in this process; we utilized an aqueous solution primarily composed of raw materials diluted with ammonia.22 Moreover, the water solubility of the obtained CDs enables us to eliminate the need for VOCs both during their production and in subsequent applications. In this study, we investigated an agri-food waste CD-based fluorescent sensor for detecting NB in aqueous solutions. The electrosynthesis of CDs and the sensing application are summarized in Fig. 1.We carefully chose the optimal electrochemical setup, informed by existing literature reports.25 We adopted an undivided cell approach, utilizing two Pt spirals as electrodes (without a reference electrode) and opted for potentiostatic electro-oxidation under direct current (DC), regulated by a straightforward power supply. As previously detailed in our prior work, the electrosynthesis of CDs was achieved under potentiostatic conditions at 8 V for 2.5 hours.23 This setup is cost-effective and readily accessible compared to the galvanostatic mode. It ensures straightforward operation and precise control over the current passing through the system. Nevertheless, under galvanostatic conditions, the bottom-up electrochemical process resulted in the synthesis of CDs with yields comparable in size and shape to those obtained under potentiostatic conditions.23 Under these conditions, the mass yield (MY) of the CDs obtained through the potentiostatic procedure was 37%. The MY of CDs was calculated using the following eqn (2):
 | (2) |
The Raman spectrum exhibits distinct features within the first-order spectral range (1000–1800 cm−1), as depicted in Fig. 2. These features include the well-known graphite band (G-band), which is centered at approximately 1586 cm−1. This band is associated with the in-plane vibrational modes of carbon atoms within graphene sheets possessing E2g2 symmetry, as reported in previous studies.29 Additionally, a D-band appears at 1312 cm−1, indicating the presence of structural defects and heteroatoms.30
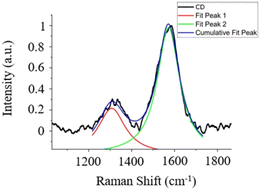 | ||
| Fig. 2 The Raman spectrum of the CDs under investigation, with the corresponding spectral fitting results. | ||
The concurrent presence of both the G-band and the D-band provides compelling evidence that the CDs primarily consist of an amorphous carbon material.31
Through the conducted fitting procedure, it becomes feasible to extract the intensity values of both the D-band and G-band, alongside other pertinent parameters of interest, as detailed in Table S1 (ESI†).
Notably, the integrated intensity ratio between these bands, denoted as ID/IG, can be employed for the determination of the structural properties of CDs, in accordance with the Tuinstra and Koenig law (TK law).32 In this context, an ID/IG ratio of approximately 0.443 is obtained, indicating the nanocrystalline nature of the synthesized CDs. Subsequently, in accordance with the TK law, an La value of approximately 43.4 nm is derived.33
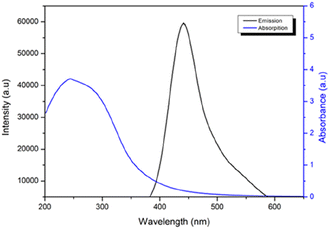
The spectra of fluorescence (PL) and UV-vis absorption were analyzed to investigate the optical properties of CDs. From an application perspective, the robust PL emission intensity of nanoparticles is one of the most frequently utilized characteristics of CDs. The nanoparticles synthesized using the electrochemical technique displayed intense fluorescence under UV light (λmax exc = 370 nm).
Fig. 3 displays the UV-vis and PL spectra of CDs. Similar photoluminescent properties of CDs have been documented in the literature, and these are attributed to the size of the nanomaterial, the presence of sp2 sites, the aromatic conjugate structure, and structural defects.34 The UV-vis spectrum of the CDs reveals an absorption band at approximately 250 nm, which corresponds to the π–π* transition of the aromatic sp2 domains (Fig. S1 in the ESI†).
To obtain a comprehensive understanding of the optical CD properties, we performed measurements and calculations to determine their QY. The results yielded a QY of 2.2%, which falls within a moderate range. Notably, this QY value is consistent with the typical range observed for CDs produced from biomass.35
Drawing from the photoluminescence characteristics of the carbonaceous bio-derivatives we obtained, as well as the growing interest in CDs for sensing and bioimaging applications, we envisioned a potential use for these bio-based nanoparticles as fluorescent chemical probes for nitroaromatic compounds.36–38
Derived carbon dots as fluorescent chemical probes
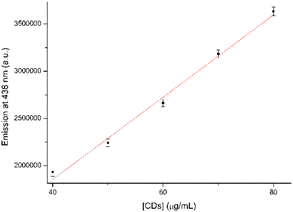
Our investigation began with the calibration of the fluorescence emission of the CDs, which was conducted at 438 nm (λmax of emission achieved upon excitation at 370 nm) (Fig. 4).The experiment was initiated with the preparation of a standard solution of CDs, which was subsequently divided into aliquots for each specific analyte.
In the initial testing phase, the concentration of CDs, that may offer better analytical properties and higher sensitivity, was evaluated. The best result was acquired with a CD concentration of 30 μg mL−1. The results of fluorescence values versus CD concentration are reported in Fig. S2 in the ESI.† Therefore, various analytes were examined at a concentration of 10 μM in a CD solution containing 30 μg mL−1. The analytes in question included 4NBAc, 4NT, 4NP, 4NBA, 1,4DNB, NB, and 4ClNB. The summarized results are displayed in Fig. 5a, with a comparison to the blank control sample. It is noteworthy that no Stokes's shifts in the λmax of emission were observed; however, all seven analytes induced a modification in the emission intensity (Fig. 5b and S3 in the ESI†).
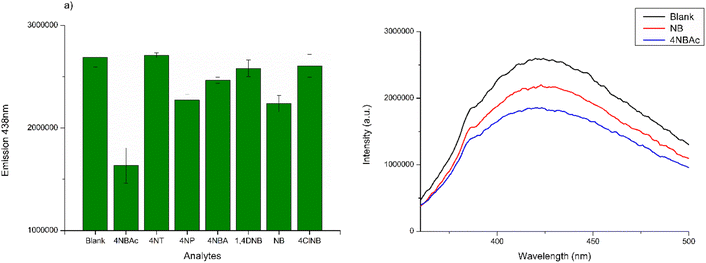 | ||
| Fig. 5 (a) PL emissions at λmax of CD aqueous solution treated with different nitro compounds; (b) comparative analysis of PL emission spectra in CD solution compared to NB and NBAc solutions. | ||
The selectivity was examined by monitoring the change in fluorescence intensity of CDs in the presence of various nitroaromatic compounds 4NBAc, 4NT, 4NP, 4NBA, 1,4DNB, NB, and 4ClNB. As presented in Fig. 5b, the fluorescence of CDs is not evidently quenched by the above species except for NB and 4NBAc, which demonstrates the good specificity of the fluorescent probe towards these two nitroaromatic compounds. However, we opted to delve deeper into the behavior of CDs when exposed to NB, providing us with the opportunity to compare our findings with those obtained from our electrochemical sensor designed for NB detection.22 Additionally, it is important to note that 4NBAc poses fewer environmental and health hazards compared to NB, with its main concern being potential eutrophication.39 In contrast, nitrobenzene is a notable toxic groundwater contaminant and an explosive compound.40
To thoroughly investigate the sensing properties of CDs for NB, we established a calibration curve by incrementally adding varying quantities of a standard NB solution (210 μM) to 2.5 mL of a CD aqueous solution (27.5 μg mL−1). Following each addition, we recorded a PL spectrum, covering a concentration range spanning from 0.16 μM to 36.6 μM (Fig. 6a).
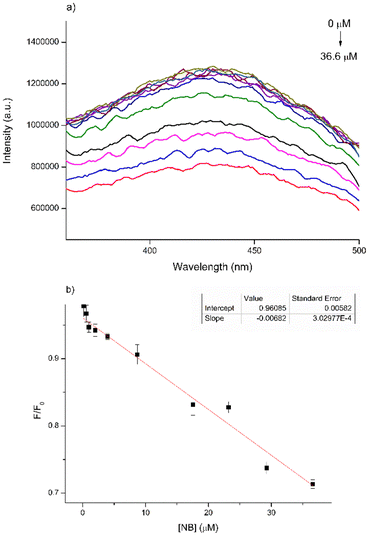 | ||
| Fig. 6 (a) Variation of PL emission curves of CD standard solution with increasing NB; (b) Stern–Volmer plot of CD solution PL emission at 438 nm versus the NB concentration. | ||
To ensure that the fluorescence intensity values remain unaffected by variations in the CD concentration arising from the increasing volume of analyte in the solution, we presented the trend of maximum fluorescence intensity (λ = 438 nm) as F/F0versus the concentration of NB. This representation follows the Stern–Volmer plot, where F denotes the maximum PL intensity recorded for the samples and F0 represents the fluorescence intensity of the blank sample (Fig. 6b).
The results obtained underscored a gradual reduction in PL intensity as the concentration of NB increased, exhibiting a linear relationship with a high correlation coefficient (R2 = 0.96085). The limit of detection (LOD) was subsequently determined to be 14 μM. The LOD is defined as the lowest concentration of the analyte (such as metals or drugs) that can be reliably detected and is calculated as 3σ m−1, where σ represents the standard deviation and m is the slope.41 It is feasible to determine the quenching constant (Ksv) from the Stern–Volmer curve using the equation: F0/F = 1 + Ksv[Q], where F0 and F denote the fluorescence emission intensity in the absence and presence of NB, respectively and Q represents the concentration of NB. The calculated Ksv value is 1.38 × 10³ M−1. However, when we repeated these measurements using a higher concentration of CDs (80 μg mL−1), the results proved inconsistent, displaying an unexpected and non-conforming variation in PL intensity (Fig. S4†). This erratic behavior is likely due to self-quenching phenomena occurring in conjunction with the interaction of CDs with PhNO2, which interferes with the fluorescence measurements.
Numerous fluorescent probes discussed in the literature involve complex and time-intensive synthesis processes, require functionalization with metal ions,42 or lanthanides,43 and often exhibit insolubility in water. Consequently, PL investigations are typically conducted in organic solvents.44,45 In contrast, bio-waste-derived CDs offer a more convenient and environmentally friendly solution, as they perform effectively without the need for chemical modification and are compatible with aqueous media (Table 1).
| Catalyst | Synthetic procedures | PL investigations | ||||
|---|---|---|---|---|---|---|
| °C, time | Solvent | Solvent | K sv | LODb | Ref. | |
| a K sv: Stern–Volmer quenching constant. b LOD: the limit of detection. c Static potential (8 V) Pt/Pt spiral wires (1 cm2 apparent area) for 2.5 h at 25 °C. | ||||||
| [Zn(L)0.5(bpb)0.5(H2O)2]n | 95 °C, 3 days | DMF, HNO3 | EtOH | 8.538 × 10⁴ M−1 | 0.2 mg | 42 |
| CDs@Eu-MOF/PVDF | 140 °C, 2 days | H2O, MeOH | MeOH | 3.46 × 10³ M−1 | 0.1598 mg L−1 | 43 |
| {Zn2(L)2(DMF)2H2O}n | 75 °C, 2 days | DMF, H2O | DMF | — | 1.19 mg mL−1 | 44 |
| Eu2Ti4(μ2-O)2(μ3-O)4(phen)2(tbza)10·4CH3CN | 80 °C, 1 day | CH3CN | DCM | 0.095 ppm−1 | 85.4 nM | 45 |
| CDs | H2O | H2O | 1.38 × 10³ M−1 | 14 μM | This work | |
In our prior research, we effectively engineered a remarkably sensitive electrochemical sensor by enhancing a screen-printed carbon electrode with CDs derived from an aqueous solution of orange peel waste. This modified sensor demonstrated proficiency in detecting NB in water.22 However, it is important to note that such analyses demand costly and complex instrumentation. Conversely, a fluorometer provides a more straightforward and user-friendly alternative, facilitating the convenient and rapid recording of spectra with only a slight compromise in sensitivity.
Effect of pH and ionic strength on the PL emission intensity: stability of CDs
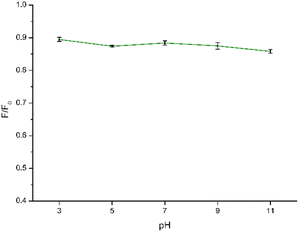
In the context of using CDs as fluorescent sensors, ensuring the PL stability of the CD solution under diverse conditions is crucial, as real-world environmental factors may impact CD applications. Hence, to gain more information on the stability of CDs under different conditions, we studied the influence of pH and ionic strength on the synthesized CDs. The impact of pH on the sensing capabilities of CDs towards NB was investigated by examining the relationship between F/F0 where F0 and F correspond to the fluorescence intensity of CDs in the absence and presence of NB, respectively. As depicted in Fig. 7 and in Fig. S5† the quenching efficiency remains consistent within a narrow range of values within the pH range of 3–11. Consequently, variations in pH had minimal impact on the sensing performance, allowing for the detection process to be carried out across a broad pH range. Finally, a pH of 7.0 was chosen for the subsequent experiments to obtain the detection results.To further explore the feasibility of the proposed method, the synthesized CDs were applied to detect NB in a solution with a high concentration of NaCl to simulate a real seawater sample. Regarding the NaCl concentration, increasing concentrations of NaCl up to 1.64 mM were used to better simulate the conditions of the real sample. The results are shown in Fig. 8 and S6.† It can be seen that the fluorescence of NB in the concentration range appears to be very little affected by the ionic strength of the solution. Therefore, the prepared CDs showed application potential for the detection of NB in real samples.
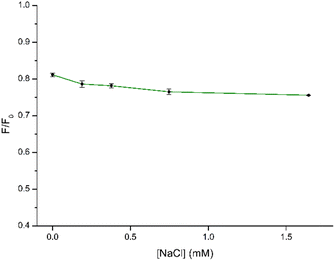 | ||
| Fig. 8 Stability of the quenching efficiency by CDs (30 μg mL−1) in the presence of NB (10 μM) at increasing concentrations of NaCl. | ||
Moreover, to assess the feasibility of employing our CDs as sensors for NB in intricate matrices, we prepare a solution containing a mixture of all previously tested analytes (excluding 4NBAc) in addition to NaCl and KCl. The presented data demonstrate that the presence of various potential interfering species, as well as high ionic strength, has only a minimal impact on fluorescence detection when compared to pure NB in distilled water (Fig. 9). These results underscore the promising direct application of the prepared CDs for detecting NB in complex aqueous samples.
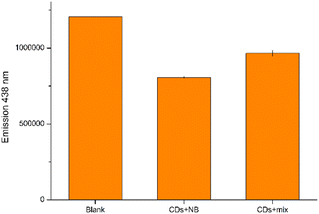 | ||
| Fig. 9 Direct detection of NB in a complex sample; the mixed solution is composed of 10 μM of NB, 4NT, 4NP, 4NBA, 1,4DNB, 4CINB, NaCl and KCl. | ||
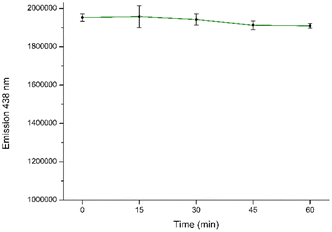
To assure the accuracy of the following analytical procedure, the effect of incubation time on the fluorescence intensity of the CD aqueous solution system was investigated. The interaction time stability at different incubation times for detection was assessed by tracking the fluorescence intensity of CDs in the presence of NB. It is evident that a consistent fluorescence intensity is maintained for up to 60 minutes after the initial measurement (Fig. 10 and S7†).
Quenching mechanism of the CDs-NB system
To understand the fluorescence detection mechanism of NB with CDs, we investigated the optical properties of both CDs and NB. As depicted in Fig. 11, the intersections between the absorption spectrum of NB and the fluorescence excitation and emission spectra of CDs suggest that the reduction in fluorescence may be ascribed to different quenching mechanisms.46 Choudhury et al.47 conducted a study on the photophysics and luminescence quenching of carbon dots derived from a bioresource and glycerol. Through Stern–Volmer analysis utilizing steady-state and time-resolved emission measurements, the findings indicated the engagement of both transient quenching and dynamic quenching mechanisms in the interaction between carbon dots and nitrobenzene. They conducted an extensive study, encompassing fluorescence spectra and fluorescence lifetime measurements across a NB concentration range of 0 to 4.5 mM. CDs synthesized by us demonstrate comparable optical properties, suggesting that the observed decline in fluorescence intensity is attributable to the same behavior. Moreover, we investigated the interaction of CDs with NB in a concentration range greatly lower (0 to 36.6 μM).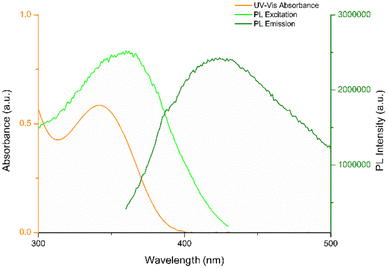 | ||
| Fig. 11 UV-vis absorption spectrum of aqueous solution of NB (1 μM) and PL excitation and emission spectra of STD-CDs (30 μg mL−1). | ||
Therefore, our results suggest that unmodified CDs, synthesized conveniently from waste materials, function as an efficient fluorescent probe for detecting nitrobenzene in water media, even at concentrations three orders of magnitude lower.
Process efficiency metrics (PEMs) for the developed protocol
The large-scale production of CDs from biomass waste is an increasingly significant area of interest. Currently, much of the research is conducted at the laboratory scale. However, the upscaling of production utilizing waste precursors to manufacture CDs is a compelling subject; it has the potential to address parameters related to circular chemistry, making it a promising route worth investigating.After determining the optimal synthesis protocol, which combines hydrothermal treatment and electrochemical methods for utilizing orange peel waste, we proceeded to calculate the process energy metric (PEM) associated with the developed electrochemical methodology. This assessment is particularly significant within the context of the circular economy, as it aims to offset the energy loss incurred during waste treatment with more environmentally sustainable processes, all while generating valuable products and materials, such as fluorescent carbon dots for sensing applications.
Our attention was directed towards four key metrics: mass intensity (MI), mass productivity (MP), reaction mass efficiency (RME), and environmental impact factor (E-factor).48–50
The summarized results are presented in Table 2.
| Common green chemistry process metrics | Common abbreviation | Formula | Optimum value | Valuea (this work) |
|---|---|---|---|---|
| a The complete eqn (S1)–(S4) with the relative calculation are reported in the ESI. b PEM is reported in ref. 48. c PEM is reported in ref. 49. | ||||
| Mass intensityb | MI |

|
1 | 9 |
| Mass productivityb | MP |

|
100% | 11% |
| Reaction mass efficiencyb | RME |

|
100% | 37% |
| Environmental impact factorc | E-Factor |

|
0 | 8 |
It is crucial to consider that the initial material consists of a blend of raw materials obtained from biowaste. The synthesis of carbon dots from biomass typically yields modest results with a moderate process energy metric (PEM). In terms of mass intensity (MI), our calculations were based on the quantity of raw material in the aqueous solution and the amount of NH3 utilized for electrolysis. This yielded a value of nine, whereas the ideal value should be one. While we did not achieve the optimal result, the outcome remains acceptable, especially when considering that the primary component involved is ammonia rather than the raw material derived from biomass. This same perspective holds true for mass productivity and RME.
In contrast, the E-factor parameter yielded a satisfactory value of eight (with the optimum value being one). Notably, literature data often indicate E-factors in the range of 5–50 for industrial processes related to fine chemical production. Considering CD chemo sensors as fine chemicals, our results fall within the lower end of this range, underscoring the environmentally friendly aspects of the developed electrochemical process.
Conclusions
Transforming biomass waste into multifunctional and versatile nanomaterials such as CDs could mark a significant stride toward circular economy practices. Biomass wastes are an excellent choice as carbon precursors because of their extensive availability, abundance, chemical composition, and eco-friendly characteristics. Here, we presented an additional successful application of CDs produced from biomass by electrochemical bottom-up synthesis. Building on the positive results of using them in electrochemical detection of nitrobenzene and their great fluorescent properties we have evaluated orange peel waste derived-CDs as fluorescent probes for NB. Our primary emphasis remains on advancing a green and eco-friendly approach. In fact, we have demonstrated that an aqueous solution of unmodified CDs is effective for detecting the presence of nitrobenzene at low concentrations. As proof of the sustainability of our protocol, we have computed process efficiency metrics and obtained intriguing results, especially given that our starting material is an industrial byproduct. We have demonstrated the effective utilization of biomass waste as a viable raw material for synthesizing CDs that yield excellent results across various applications.Data availability
Data will be made available on request.Author contributions
Cinzia Michenzi: validation, visualization, investigation, writing – original draft, writing review & editing. Claudia Espro: conceptualization, methodology, supervision, writing – original draft. Viviana Bressi: validation, visualization, investigation. Anacleto Proietti: investigation, writing – original draft. Marco Rossi: resources, writing – review & editing. Fabrizio Vetica: visualization, investigation. Beatrice Simonis: resources. Isabella Chiarotto: conceptualization, methodology, supervision, writing – original draft writing – review & editing.Conflicts of interest
There are no conflicts to declare.Acknowledgements
The authors acknowledge the Sapienza University of Rome for financial support (project grant no. RM120172A8223162) and Center on Nanotechnologies Applied to Engineering of Sapienza (CNIS). The authors acknowledge funding from the European Union (Next Generation EU), through the project MUR-PNRR SAMOTHRACE (ECS00000022). C. Michenzi thanks the Italian Ministry of University and Research (MUR) for a PhD position (D.M. no. 1061/2021) within the EU-funding National Operational Program (PON) on Research and Innovation 2014–2020.Notes and references
-
C. Michenzi, A. Proietti, M. Rossi, C. Espro, V. Bressi, F. Vetica, B. Simonis and I. Chiarotto, Diesel and gasoline engine exhausts and some nitroarenes, IARC, 1989, vol. 46 Search PubMed
.
- P. K. Arora and H. Bae, J. Chem., 2014, 265140, DOI:10.1155/2014/265140
.
- T. Carreon, M. J. Hein, K. W. Hanley, S. M. Viet and A. M. Ruder, Occup. Environ. Med., 2014, 71(3), 175–182, DOI:10.1136/oemed-2013-101873
.
- R. G. Saratale, G. D. Saratale, J. S. Chang and S. P. Govindwar, J. Taiwan Inst. Chem. Eng., 2011, 42(1), 138–157, DOI:10.1016/j.jtice.2010.06.006
.
-
R. Meyer, J. Kohler and A. Homburg, Explosives, Wiley Online Books, 7th edn, 2016, DOI:10.1002/9783527689583
.
- M. Wainwright, Dyes Pigm., 2008, 76(3), 582–589, DOI:10.1016/j.dyepig.2007.01.015
.
- P. Kovacic and R. Somanathan, J. Appl. Toxicol., 2014, 34, 810–824, DOI:10.1002/jat.2980
.
- Y. Zhang, Q. Yang, X. Li, C. Miao, Q. Hou and S. Ai, CrystEngComm, 2020, 22, 5690–5697, 10.1039/D0CE00835D
.
-
L. Davies, Enviromental Health Criteria Nitrobenzene, IPCS World Health Organization, 2003 Search PubMed
.
- J. Wang, Y. Yang, G. Sun, M. Zheng and Z. Xie, Environ. Res., 2019, 177, 10862, DOI:10.1016/j.envres.2019.108621
.
- M. Zulfajri, A. Rasool and G. G. Huang, New J. Chem., 2020, 44, 10525–10535, 10.1039/D0NJ02134B
.
- P. R. Yaashikaa, P. S. Kumar and S. Varjani, Bioresour. Technol., 2022, 343, 126126, DOI:10.1016/j.biortech.2021.126126
.
- FAS-USDA – Foreign Agricultural Service-United States Department of Agriculture, Citrus: World Markets and Trade, available online: https://apps.fas.usda.gov/psdonline/circulars/citrus.pdf, accessed on 20 March 2022.
- K. Rezzadori, S. Benedetti and E. R. Amante, FBP, 2012, 90, 606–614, DOI:10.1016/j.fbp.2012.06.002
.
- J. Liu, R. Li and B. Yang, ACS Cent. Sci., 2020, 6, 2179–2195, DOI:10.1021/acscentsci.0c01306
.
- S. Y. Lim, W. Shen and Z. Gao, Carbon quantum dots and their applications, Chem. Soc. Rev., 2015, 44, 362–381, 10.1039/C4CS00269E
.
- P. Das, P. P. Maity, S. Ganguly, S. Ghosh, J. Baral, M. Bose, S. Choudhary, S. Gangopadhyay, S. Dhara, A. K. Das, S. Banerjee and N. C. Das, Int. J. Biol. Macromol., 2019, 132, 316–329, DOI:10.1016/j.ijbiomac.2019.03.224
.
- H. S. Shahraki, A. Ahmad and R. Bushra, FlatChem, 2022, 31, 100310, DOI:10.1016/j.flatc.2021.100310
.
- R. B. González-González, L. Y. Martínez-Zamudio, J. A. Rodríguez Hernández, G. M. González-Meza, R. Parra-Saldívar and H. M. N. Iqbal, Environ. Res., 2023, 117180, DOI:10.1016/j.envres.2023.117180
.
- P. Singh, Arpita, S. Kumar, P. Kumar, N. Kataria, V. Bhankar, K. Kumar, R. Kumar, C.-T. Hsieh and K. S. Khoo, Nanoscal., 2023, 15, 16241–16267, 10.1039/D3NR01966G
.
- R. Atchudan, T. N. J. I. Edison, M. Shanmugam, S. Perumal, T. Somanathan and Y. R. Lee, Phys. E, 2021, 126, 114417, DOI:10.1016/j.physe.2020.114417
.
- V. Bressi, I. Chiarotto, A. Ferlazzo, C. Celesti, C. Michenzi, T. Len, D. Iannazzo, G. Neri and C. Espro, ChemElectroChem, 2023, e202300004, DOI:10.1002/celc.202300004
.
- C. Michenzi, C. Espro, V. Bressi, C. Celesti, F. Vetiva, C. Salvitti and I. Chiarotto, Mol. Catal., 2023, 544, 113182, DOI:10.1016/j.mcat.2023.113182
.
- F. Niu, Y. Xu, J. Liu, Z. Song, M. Liu and J. Liu, Electrochim. Acta, 2017, 236, 239–251, DOI:10.1016/j.electacta.2017.03.085
.
- F. W. S. Lucas, R. G. Grim, S. A. Tacey, C. A. Downes, J. Hasse, A. M. Roman, C. A. Farberow, J. A. Schaidle and A. Holewinski, ACS Energy Lett., 2021, 6, 1205–1270, DOI:10.1021/acsenergylett.0c02692
.
- B.-B. Chen, M.-L. Liu, Y.-T. Gao, S. Chang, R.-C. Qian and D.-W. Li, Nano Res., 2023, 16(1), 1064–1083, DOI:10.1007/s12274-022-4840-2
.
- R. Bandi, B. R. Gangapuram, R. Ramakrishna Dadigala, R. Eslavath, S. S. Singh and V. Guttena, RSC Adv., 2016, 6, 28633, 10.1039/C6RA01669C
.
- M. J. Krysmann, A. Kelarakis, P. Dallas and E. P. Giannelis, J. Am. Chem. Soc., 2011, 134, 747–750, DOI:10.1021/ja204661r
.
- J. Jehlička and C. Beny, J. Mol. Struct., 1999, 480–481, 541–545, DOI:10.1016/S0022-2860(98)00779-0
.
- C. Beny-Bassez and J. N. Rouzaud, Scanning Electron Microsc., 1984, 1(11), 119–132 Search PubMed
, https://digitalcommons.usu.edu/electron/vol1985/iss1/11.
- L. Ruili, D. Wu, S. Liu, K. Koynov, W. Knoll and Q. Li, Angew. Chem., Int. Ed., 2009, 48, 4598–4601, DOI:10.1002/anie.200900652
.
- Y. Fang, S. Guo, D. Li, C. Zhu, W. Ren, S. Dong and E. Wang, ACS Nano, 2012, 6, 400–409, DOI:10.1021/nn2046373
.
- P. Puech, M. Kandara, G. Paredes, L. Moulin, E. Weiss-Hortala, A. Kundu, N. Ratel-Ramond, J. M. Plewa, R. Pellenq and M. Monthioux, C, 2019, 5, 69, DOI:10.3390/c5040069
.
- P. Surendran, A. Lakshmanan, G. Vinitha, G. Ramalingam and P. Rameshkumar, Luminescence, 2020, 35, 96–202, DOI:10.1002/bio.3713
.
- N. Dhenadhayalan, K.-C. Lin and T. A. Saleh, Small, 2020, 16, 1905767, DOI:10.1002/smll.201905767
.
- A. Sharma and J. Das, J. Nanobiotechnol., 2019, 17, 92, DOI:10.1186/s12951-019-0525-8
.
- M. Li, T. Chen, J. J. Gooding and J. Liu, ACS Sens., 2019, 4, 1732–1748, DOI:10.1021/acssensors.9b00514
.
- M. K. Barman and A. Patra, J. Photochem. Photobiol. C: Photochem. Rev., 2018, 37, 1–22, DOI:10.1016/j.jphotochemrev.2018.08.001
.
- B. D. Deshpande, P. S. Agrawal and M. K. N. Yenkie, AIP Conf. Proc., 2019, 2142, 210003, DOI:10.1063/1.5122650
.
- V. A. Ansi, K. R. Vijisha, K. Muraleedhara and N. K. Renuka, Sens. Actuators, A, 2020, 302, 111817, DOI:10.1016/j.sna.2019.111817
.
- S. Sawalha, A. Silvestri, A. Criado, S. Bettini, M. Prato and L. Valli, Carbon, 2020, 167, 696–708, DOI:10.1016/j.carbon.2020.06.011
.
- L.-B. Wang, J.-J. Wang, E.-L. Yue, J.-F. Li, L. Tang, X. Wang, X.-Y. Hou, Y. Zhang, Y.-X. Ren and X.-L. Chen, Dyes Pigm., 2022, 197, 109863, DOI:10.1016/j.dyepig.2021.109863
.
- X. Wang, R. Zhu, X. Wang, F. Liu, Y. Gao, R. Guan and Y. Chen, Inorg. Chem. Commun., 2023, 149, 110423, DOI:10.1016/j.inoche.2023.110423
.
- Y. Pan, J. Wang, X. Guo, X. Liu, X. Tang and H. Zhang, J. Colloid Interface Sci., 2018, 513, 418–426, DOI:10.1016/j.jcis.2017.11.034
.
- H. Zheng, Y.-K. Deng, M.-Y. Ye, Q.-F. Xu, X.-J. Kong, L.-S. Long and L.-S. Zheng, Inorg. Chem., 2020, 59(17), 12404–12409, DOI:10.1021/acs.inorgchem.0c01494
.
- F. Zu, F. Yan, Z. Bai, J. Xu, Y. Wang, Y. Huang and X. Zhou, Microchim. Acta, 2017, 184, 1899–1914, DOI:10.1007/s00604-017-2318-9
.
- P. M. Gharat, H. Pal and S. D. Choudhury, Spectrochim. Acta, Part A, 2019, 209, 14–21, DOI:10.1016/j.saa.2018.10.029
.
- F. Roschangar, R. A. Sheldonb and C. H. Senanayakea, Green Chem., 2015, 17, 752–768, 10.1039/C4GC01563K
.
- R. A. Sheldon, Chem. Ind., 1992, 903–906 CAS
.
- A. D. Curzons, D. J. C. Constable, D. N. Mortimera and V. L. Cunninghamb, Green Chem., 2001, 3, 1–6, 10.1039/B007871I
.
Footnote |
| † Electronic supplementary information (ESI) available. See DOI: https://doi.org/10.1039/d3su00469d |
| This journal is © The Royal Society of Chemistry 2024 |


