Synergetic microstructure engineering by induced ZB/WZ twin boundaries and S vacancies in a Zn0.5Cd0.5S-based S-scheme photocatalyst for highly efficient photocatalytic hydrogen production†
Yuhao
Zhang
abd,
Dingze
Lu
 *abc,
Zhennan
Wang
b,
Min
Zhou
b,
Kiran Kumar
Kondamareddy
*e,
Jing
Li
b,
Huiqing
Fan
c,
Dezhong
Cao
b and
Wingkei
Ho
 *a
*a
aDepartment of Science and Environmental Studies, The Education University of Hong Kong, Tai Po, New Territories, Hong Kong 999077, PR China. E-mail: keithho@eduhk.hk; ludingze@whu.edu.cn
bSchool of Science, Xi'an Polytechnic University, Xi'an 710048, PR China
cState Key Laboratory of Solidification Processing, School of Materials Science and Engineering, Northwestern Polytechnical University, Xi'an 710072, PR China
dCommon Course, Shaanxi Polytechnic Institute, Xian'yang, 712000, PR China
eDepartment of Physics, School of Pure Sciences, College of Engineering Science and Technology, Fiji National University, Lautoka, PO Box 5529, Fiji. E-mail: kiran.kondamareddy@fnu.ac.fj
First published on 21st September 2023
Abstract
Surface-abundant active sites, rapid charge transport and associated prolonged electron lifetime are vital factors that determine efficient photocatalysis. A series of different Zn0.5Cd0.5S solid solutions, including single crystalline Zn0.5Cd0.5S (ZCS), single crystalline Zn0.5Cd0.5S with S vacancies (ZCS-V), twin structured-Zn0.5Cd0.5S (T-ZCS) and twin-structure Zn0.5Cd0.5S with S vacancies (T-ZCSv) were successfully prepared in the present work by manipulating the conditions of the hydrothermal reaction. Experimental results confirm that the optimized T-ZCSv photocatalyst that possesses a hexagonal wurtzite/zinc blende (WZ/ZB) twin structure and rich-surface S vacancies exhibits an excellent photocatalytic hydrogen production efficiency of approximately 551.74 μmol h−1. The outstanding performance of the optimized T-ZCSv is attributed to the prolonged electron lifetime and effectively facilitated separation and migration of charge carriers. These are provided by the periodically aligned WZ/ZB interfacial homojunctions that form the S-scheme staggered energy band structure across the junction and abundant S vacancies that serve as electron trapping sites in the T-ZCSv. Furthermore, T-ZCSv are uniformly dispersed on 2-methylimidazole zinc salt [zeolitic imidazolate framework-8 (ZIF-8 polyhedron)], which not only could inhibit the aggregation of T-ZCSv but also expose more active sites for photocatalytic-redox reactions. Finally, a possible charge separation and transfer mechanism explaining the optimum activity of the outperforming sample is proposed on the basis of the results obtained from a range of investigation methods [scanning electron microscopy and energy-dispersive spectroscopy (SEM-EDS), transmission electron microscopy and high-resolution transmission electron microscopy (TEM/HRTEM), X-ray diffraction (XRD) technique, ultraviolet-visible (UV-vis) diffuse reflection spectroscopy, and electron paramagnetic resonance (EPR) spectroscopy]. This study demonstrates the development of a structurally unique Zn0.5Cd0.5S (with twin structure and S vacancies) and a Zn0.5Cd0.5S-based metal–organic framework (MOF) for photocatalytic applications.
Introduction
Recently, metal sulfide semiconductors, especially ternary zinc cadmium sulfide (ZnxCd1−xS) solid solutions, have been widely used in photocatalytic hydrogen production due to their excellent photocatalytic performance with an appropriate energy band structure and efficient photo-charge separation.1–4 Compared to pristine zinc sulfide (ZnS) and cadmium sulfide (CdS), ZnS has a broader band gap (∼3.6 eV), across which the electrons are only excited by ultraviolet (UV) light, thus limiting the utilization of the full sun spectrum. Some fatal drawbacks also inhibit the efficiency of CdS for hydrogen production, including low resistance to photo-corrosion and rapid recombination of photogenerated charge carriers.5–7 Therefore, a series of ZnCdS solid solutions of tunable band gaps and band edges are prepared by changing the ratio of Zn/Cd, which can effectively solve the above problems and improve photocatalytic activity and stability.8–10 It is worth noting that some typical research work of single crystal ZnCdS solid solution with hexagonal wurtzite (WZ) and cubic zinc blende (ZB) phases was respectively prepared by Wang and Chan et al.11,12 As they hypothesized, single-crystalline ZnCdS exhibited better hydrogen production efficiency than individual CdS and ZnS. These earlier works addressed the basic challenges of sulfide photocatalysts to some extent, such as severe photocorrosion, poor stability and visible light absorbance, and a non-adjustable band gap. Nevertheless, the single-crystal phase (defect-free crystal) of ZnxCd1−xS still suffers from low separation efficiency of space charge and a short lifetime owing to its untargeted migration and short diffusion lengths.A twin crystal structure, as one of the crystal phase engineering types, containing two different crystalline phases can be formed in single-twinned nanocrystals between the wurtzite (WZ) and zinc blende (ZB) segments.13 Obtaining twin structures in one-dimensional nanocrystals provides an alternative alignment of long-range-order twinned planes in a twin-superlattice arrangement at the nanoscale and introduces ingenious WZ/ZB structural segments at particular dimensions.14,15 The parallel WZ/ZB twin boundaries form a one-dimensional ordered homojunction because of the realignment of the band structures across the WZ/ZB coherent twin boundary interfaces. Compared with the traditional charge transfer mechanism, Yu et al. first proposed the concept of Step-scheme (S-scheme) photocatalytic principle which solves the contradiction of the photocatalytic charge transfer path reported previously.16 They first designed WO3 (2D) and g-C3N4 (2D) S-scheme heterojunction photocatalysts in 2019, which showed high photocatalytic H2-production performance, which was approximately 1.8 times that of pure g-C3N4 due to the efficient charge separation and transfer in the photocatalytic reaction process.17 The suitable staggered band configurations of the S scheme photocatalytic system possess optimized redox capability, which could effectively accelerate the recombination of relatively useless photo-generated charges but inhibit the recombination of useful holes and electrons, and facilitate better charge transport properties owing to its band-to-band potentials and highly ordered structural charge transport pathways, respectively.18,19 Consequently, the interfacial resistance of photo-generated charges for coherent twin boundaries is one order of magnitude lower than that of the conductors and semiconductors with crystal structures of large-angle grain boundaries.20,21 Therefore, the structurally induced nano twin crystals enhance the photocatalytic activity. An imitative recreation of this structural feature is realized by achieving a periodic alignment of wurtzite/zinc blende (WZ/ZB) structures together with regular spacing in the Zn0.5Cd0.5S-pseudobinary structure.22 The WZ/ZB homojunction is a conventional type II staggered band in the twinned superlattice structure of the ZnCdS solid solution. It still preserves the transfer properties of charge carriers such as perfect nanocrystals.23 The highly ordered homojunction structure and its interfacial electrostatic field lead to an effective separation of photo-charges and transfer to the surface of the samples. Consequently, they participate in redox reactions. Thus, the S scheme system inhibits charge recombination and optimizes the utilization rate of photogenerated charge carriers.14 Du et al. prepared a series of twinned ZnxCd1−xS nanomaterials employing Cd2+/Zn2+ acetate and thioacetamide as precursors.24 The results indicated that an appropriate amount of triethanolamine quantity resulted in the ZnxCd1−xS solid solution with a high-density WZ/ZB twinned superlattice structure, which greatly improved the separation of charge carriers and photocatalytic performance.
Furthermore, the development of novel functional photocatalysts with optimum optoelectronic characteristics has been achieved by exploiting the unique advantages of vacancy engineering for sustainable energy and environmental applications. It is also possible to tune the photocatalytic ability of semiconductors by manipulating the distribution and concentration of defects. Vacancy engineering pertaining to the introduction of typical sulphur (S) vacancies into the crystal structure of semiconductor photocatalysts has been shown to lead to higher absorption of visible light, prolonged electron lifetimes and abundant reactive sites.25–27 However, the synergy between the twin crystal structure and vacancies to improve the photocatalysis has not been reported yet. Therefore, the acquisition of WZ/ZB twin structure-based homogeneous junctions and the introduction of S vacancies should be a practical way to boost the activity of hydrogen production of ZnCdS-based photocatalysts. Moreover, zeolitic imidazolate frameworks (ZIFs), a sub-class of MOFs, are promising in the synthesis of novel functional materials by serving as excellent precursors and/or templates in compounds/composites such as metal sulfides, metal oxides, interesting porous carbon materials, and carbon–metal/metal oxide hybrids with systematically controlled compositions.28,29 Besides, the composites based on ZIF/ZIF derivatives act as potential light-harvesting sites and electronic mediators. Loading ZnCdS onto the surface of ZIF-8 using direct in situ growth may be an effective strategy to achieve the dispersion of the catalyst and improve its catalytic activity.
Herein, we have prepared a series of Zn0.5Cd0.5S solid solutions, including single-crystal Zn0.5Cd0.5S without S vacancies and twin structure (ZCS), S-vacancy-rich single-crystal Zn0.5Cd0.5S (ZCS-V), twinned Zn0.5Cd0.5S without S vacancies (T-ZCS) and S-vacancy-rich twin-crystal Zn0.5Cd0.5S (T-ZCSv) using a facile and feasible method. The photocatalytic activity of the samples was evaluated by hydrogen production, and T-ZCSv is the best member of this series with the highest photocatalytic hydrogen production activity, reaching approximately 18 times that of the bare ZCS. A comparative study is carried out among various ZIF-8@T-ZCSv composites containing different amounts of uniformly distributed T-ZCSv on the surface of ZIF-8 polyhedra. The uniform distribution of T-ZCSv prevents the agglomeration of T-ZCSv, thereby facilitating the exposure of more active sites, which contribute to enhancing the photocatalytic hydrogen production rates of ZIF-8@T-ZCSv composites. Optimized ZIF-8@T-ZCSv (1300 mg) exhibited a superior H2 generation rate of ∼583.25 μmol h−1. Furthermore, the characterization techniques employed could verify the formation mechanism of WZ/ZB twin boundaries and S vacancies in Zn0.5Cd0.5S-based S scheme photocatalysts and reveal the reasons for promoting the photocatalytic hydrogen production efficiency. This work mainly emphasizes the critical role of the S vacancy-defects and the charge transfer mechanism across twin-crystals in improving the photocatalytic ability of the Zn0.5Cd0.5S solid solution supported by the ZIF-8 substrate, which develops a new idea for designing efficient photocatalysts to achieve sustainable hydrogen production.
Experimental
Synthesis of the Zn0.5Cd0.5S solid solution with different structural characteristics
Synthesis of ZIF-8 and ZIF-8@T-ZCSv
A typical ageing effect resulted in the formation of ZIF-8@T-ZCSv. First, the Zn(NO3)2·6H2O (734.4 mg) crystals were completely dissolved in methanol (50 mL) by stirring for 15 min. This methanol solution containing zinc nitrate was quickly mixed with another 50 mL of methanol solution which had 0.81 g of 2-methylimidazole, 0.81 g of 1-methylimidazole and different quantities of T-ZCSv (30, 50, 100, 700, 1300, 1900 and 2500 mg), and kept stirring for a few minutes. Subsequently, the obtained solution was aged under ambient conditions without any disturbance for a day and night. Finally, the resulting sediment was repeatedly cleaned with ethanol and dried overnight. ZIF-8 is prepared in a similar process to that of ZIF-8@T-ZCSv but without the addition of T-ZCSv.Characterization
The JSM-7401F instrument of SEM-EDS was employed to monitor the morphology, grain size, particle dispersion, and micro-distribution of the elements of the samples. JEM-2100F TEM/HRTEM equipment (180 kV of source voltage) was used to investigate the micromorphology and crystal lattice of the samples. The crystalline phases and crystalline nature of the photocatalysts were monitored using a MiniFlex 600, XRD instrument operating with Cu-Kα radiation, voltage ∼40 kV, and current of 30 mA between 5° and 90°. The identification of surface oxidation states and chemical valency of the photocatalysts, measurement of relative elemental content and qualitative analysis of each element was performed using ESCALAB 250xi and Thermo Fisher's X-ray photoelectron spectroscope (XPS). The physical characteristics of the surface (specific surface area, pore volume, pore structure and pore size distribution) of the photocatalysts were measured using the JW-BK 100 B instrument. A HITACHI U-3310 UV-Vis diffuse reflection spectrometer (BaSO4 served as reference material) was utilized to measure the absorbance of light by photocatalysts in the wavelength ranging from 200 to 800 nm, and their energy band gaps were calculated by subsequent conversion (KM plots) of the equations. A Bruker A300 electron paramagnetic resonance (EPR) spectroscope monitored the EPR signals pertaining to lattice defects in the sample at ambient temperature.Measurement of photocatalytic hydrogen production
Photocatalytic hydrogen production was performed through an automated CEL-SPH2N system (China Education Au-light) equipped with a 250 mL reaction vessel. In the typical procedure, 10 mg (or 50 mg) of samples and sacrificial agents (1.57 g of Na2SO3 and 4.2 g of Na2S·9H2O) were dissolved in a 50 mL aqueous solution uniformly and taken in a quartz plate capped reaction vessel. Subsequently, the vessel was carefully mounted on the magnetic stirrer of the CEL-SPH2N system, which was set to rotate at 600 rad min−1 and connected to the GC-7920 online-based gas chromatograph (with highly pure N2 as carrier gas). The system was strongly evacuated prior to irradiation for 30 min. Visible light irradiation obtained by a 300 W xenon lamp with a wavelength filter (≥420 nm) was employed to perform the photocatalytic reaction. The cross-sectional area of the lamp was about 1.857 × 10 −3 m2, i.e. the illumination area and the distance from the lamp to the reacting solution were set at 0.125 m. A cold water-flow system was used to stabilize the reaction temperature at 4 °C. The online gas chromatograph measured the amount of hydrogen produced automatically every 40 min during the photocatalytic reaction, which was conducted for 200 min. The applied parameters of gas chromatography were 60 mA of bridge current, 100 °C of sample inlet temperature, 150 °C of TCD temperature, and 60 °C of column furnace temperature.Photoelectrochemical test
Photoelectrochemical tests [transient photocurrent, electrochemical impedance spectra (EIS) and Mott–Schottky] were conducted using the CHI-660E (Chen Hua Instrument Co., Ltd) electrochemical workstation with a three-electrode system. The working electrode was prepared as follows. The powder sample (5 mg), DI water (500 μL), ethanol (450 μL) and Nafion aqueous solution (50 μL) were taken in a beaker and sonicated for 1 h, and the mixture was dripped uniformly onto the fluorine-doped tin oxide (FTO) glass (1.0 × 1.8 cm2) using a pipette. Subsequently, the FTO glass coated with the sample was dried at room temperature for 12 h. The three-electrode configuration contained a working electrode of a sample-coated fluorine-doped tin oxide glass substrate, a counter electrode that is a Pt wire, and a reference electrode formed with a calomel electrode or saturated Ag/AgCl. The electrolyte is a solution of Na2SO4 (0.1 M). The lamp used at 15 cm of the working electrode to irradiate is the same as that of the photocatalytic reaction.Results and discussion
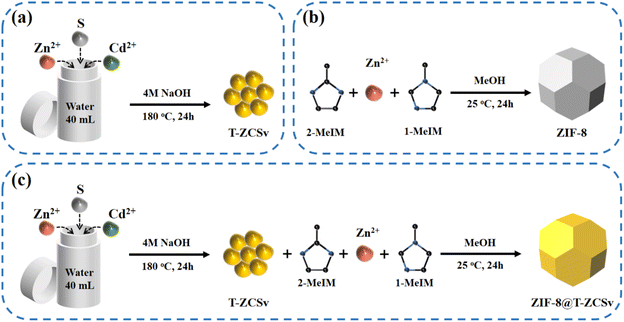
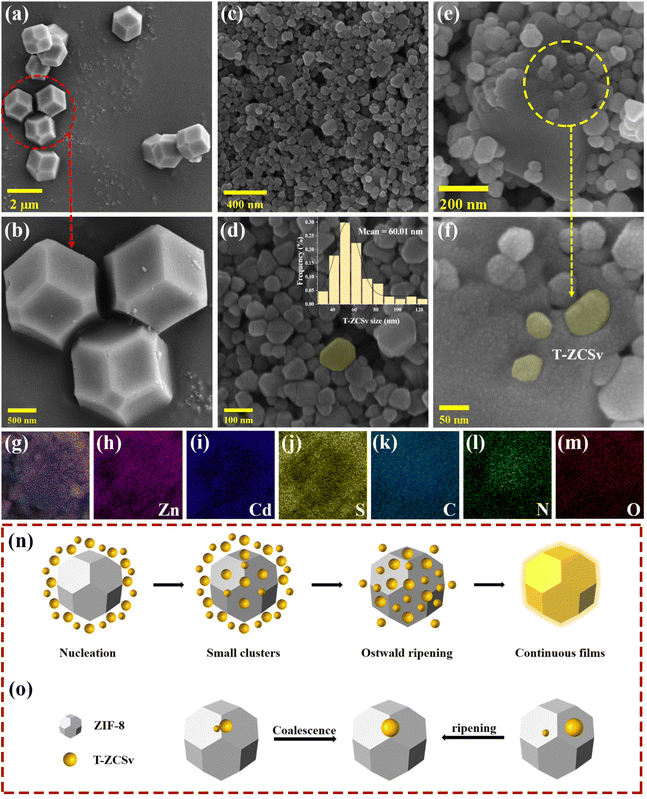
Typical procedures for the synthesis of T-ZCSv, ZIF-8 and ZIF-8@T-ZCSv are illustrated in Scheme 1(a–c). First, T-ZCSv was synthesized using Zn(CH3CO2)2·2H2O, Cd(CH3CO2)2·2H2O and CH3CSNH2, which serve as precursors of Zn2+, Cd2+ and S respectively by a facile hydrothermal reaction (4 M NaOH) at 180 °C for 24 h [Scheme 1(a)]. The synthesis of ZIF-8 is illustrated in Scheme 1(b), according to which a certain proportion of 1-methylimidazole, 2-methylimidazole and Zn(NO3)2·6H2O are aged in methanol solution for 24 h to obtain ZIF-8 polyhedra that possess a uniform size and favorable structure. Combining the above two experimental schemes, ZIF-8@T-ZCSv was prepared by employing different quantities of T-ZCSv solid solutions added to the reaction solution before the process of aging ZIF-8. Consequently, ZIF-8@T-ZCSv with different proportions of T-ZCSv were obtained and labeled as ZIF-8@T-ZCSv (30 mg), ZIF-8@T-ZCSv (50 mg), ZIF-8@T-ZCSv (100 mg), ZIF-8@T-ZCSv (1300 mg), ZIF-8@T-ZCSv (1900 mg), and ZIF-8@T-ZCSv (2500 mg). These ZIF-8@T-ZCSv samples are expected to possess a uniform distribution of T-ZCSv over the surface of the ZIF-8 polyhedra.The geometry, size, microscopic morphology, and distribution of the ZIF-8 polyhedra, pure T-ZCSv nanoparticles and ZIF-8@T-ZCSv (1300 mg) composite are analyzed by SEM images. As shown in Fig. 1a and b, the prepared ZIF-8 exhibits a typical polyhedron morphology with a stereoscopic framework, smooth surfaces, and a uniform particulate size of approximately 1.5 μm. SEM images of two different magnifications for twinned Zn0.5Cd0.5S nanoparticles containing sulfur vacancies are presented in Fig. 1c and d. The particle size distribution curve with the corresponding histogram is shown as an inset. These figures show that T-ZCSv nanoparticles possess inhomogeneous sizes with diameters of 20–130 nm and an average dimension of ∼60 nm (inset). The particles do not possess a specific geometric shape. Fig. 1c and d show irregularly aggregated pure T-ZCSv nanoparticles with poor uniformity in their dispersion, which is not beneficial for the exposure of photocatalytic active sites. The SEM images of ZIF-8@T-ZCSv (1300 mg), prepared by an ageing effect, are presented in Fig. 1e and f with different magnifications. The well-formed ZIF-8 polyhedron in the 3D space (Fig. 1e) supports the dispersion of pure T-ZCSv nanoparticles [highlighted with a yellow color in Fig. 1f] and their distribution over the surfaces of the ZIF-8 polyhedron, indicating a significantly reduced agglomeration of pure T-ZCSv nanoparticles. The successful formation of the ZIF-8 polyhedra and T-ZCSv nanoparticle-based composite is confirmed by the dents made by the T-ZCSv nanoparticles over the ZIF-8 polyhedra's surface, demonstrating that the surfaces of the ZIF-8 polyhedron serve as a substrate for T-ZCSv nanoparticles and prevent the nanoparticles from aggregation. This strategic composite remarkably enhanced the dispersion of T-ZCSv and facilitated more reactive sites thereby excellent exposure to the light and the aqueous environment for quick photocatalytic reaction with high light absorbance over the surface of the T-ZCSv nanoparticles. The corresponding EDS elemental distribution in ZIF-8@T-ZCSv (1300 mg) is shown in Fig. 1(g–m), depicting the existence of zinc, cadmium, sulphur, carbon, nitrogen and oxygen throughout ZIF-8@T-ZCSv (1300 mg). Fig. 1n and o depict the mechanism of formation of the ZIF-8@T-ZCSv composite with highly dispersed nanoparticles on the surfaces of ZIF-8 based on the Ostwald ripening process. According to this process, the ZIF-8 polyhedron acts as the substrate of T-ZCSv nanoparticles, and some of the small T-ZCSv nanoparticles gradually dissolve into each other and form small clusters over the surface of ZIF-8. The smaller T-ZCSv nanoclusters can be converted into larger agglomerates at the expense of the mass of tiny T-ZCSv nanoparticles. This process makes the average size of the T-ZCSv nanoparticles gradually increase and uniformly deposit on the surfaces of ZIF-8, resulting in the formation of ZIF-8@T-ZCSv composite, which is in good agreement with the SEM studies.
The microscopic morphology and crystalline lattice structure of T-ZCSv and ZIF-8@T-ZCSv (1300 mg) were further measured by TEM images. Fig. (2a and b) show the T-ZCSv nanoparticles agglomerated together and composed of many irregular granules at different magnifications. The bright parallel straight-line patterns are seen on the surface of the nanoparticles rounded by the red dotted circles in the TEM images with 100- and 25 nm scale bars. These straight lines can be attributed to the wurtzite twin boundaries (WZ-TB) of the sphalerite zinc blende (ZB) lattices. Fig. 2b represents the magnified image of a rounded nanoparticle (highlighted with a translucent yellow area) with clearly visible twin boundaries. To confirm the twinning of sphalerite–Zinc Blende and Wurtzite-TBs, we analyzed the HRTEM images of the samples. Fig. 2c is the HRTEM image of the T-ZCSv's lattice structure and its generated Fast Fourier Transform (FFT). Different regions of the nanoparticles are indexed using the FFTs generated from the portions. The nanocrystal regions I, II, III and IV are confirmed as sphalerite–Zinc Blende lattice structures of the ZnS crystalline phase segments by indexing the corresponding FFT patterns. Regions I and II are indexed based on the zone axes (viewed along) [![[1 with combining macron]](https://www.rsc.org/images/entities/char_0031_0304.gif) 10] and [1
10] and [1![[1 with combining macron]](https://www.rsc.org/images/entities/char_0031_0304.gif) 0] respectively, depicting the mirrored symmetrical alignment of atomic planes of the ZB structure in these two regions. Similarly, regions III and IV are indexed with the same zone axes, respectively. These four regions are separated by atomic stacking fault (SF), which form WZ-TBs or dislocation boundaries (indicated by white dashed arrows) with parallel distribution,13,24 confirming that the occurrence of (111)/[11
0] respectively, depicting the mirrored symmetrical alignment of atomic planes of the ZB structure in these two regions. Similarly, regions III and IV are indexed with the same zone axes, respectively. These four regions are separated by atomic stacking fault (SF), which form WZ-TBs or dislocation boundaries (indicated by white dashed arrows) with parallel distribution,13,24 confirming that the occurrence of (111)/[11![[2 with combining macron]](https://www.rsc.org/images/entities/char_0032_0304.gif) ]-slips interrupts the continuity in the ZB structure, resulting in twin structures. These twin crystals can be associated with homojunctions originating from the WZ twin boundary slips in the T-ZCSv. Fig. 2g schematically represents the ZB phase with a face-centred cubic (FCC) structure of “⋯ABCABC⋯” order in the 〈111〉 direction of its tightly packed structure. The WZ phase with a hexagonal structure possesses “⋯ABABAB⋯” order of atomic planes in the closely-packed [0001] direction.30 The appearance of periodic stacking faults in the “⋯ABCABC⋯” ordered arrangement of the FCC structure along the 〈111〉 crystal plane introduces discontinuities in the sphalerite ZB's structure. Consequently, dislocations are created at discontinuities with “⋯CAC⋯” or “⋯BAB⋯” stacking of atomic planes (Fig. 2h). These dislocations distinguish the neighboring lattice segments with “A” as a mirror symmetry which are thus known as coherent twin boundaries or coherent twin planes. These “⋯CAC⋯” or “⋯BAB⋯” twin planes belong to the wurtzite structure, and therefore the twin boundaries are called wurtzite twin boundaries (WZ-TBs), forming twinned superlattices. Fig. 2(c and c-1) depicts mirror-symmetric lattice (zigzag) stripes distributed on both sides of the twin boundaries, and the order of twin lattice arrangement changed to “⋯CAC⋯” or “⋯BAB⋯” or vice versa. Several wurtzite structural phases are identified on many T-ZCSv nanocrystals in the present samples. The wurtzite structure can also occur with two or three diatomic layers, as shown in Fig. S1† for the T-ZCSv nanocrystals. These ZB/WZ twin boundaries produce interfacial-homogeneous junctions, which remarkably influence the electronic properties of the T-ZCSv nanocrystals and thus effectively boost the vectorial separation and transport of charge carriers.15,31Fig. 2d and e are the TEM images of ZIF-8@T-ZCSv (1300 mg) monitored at different resolutions that describe the T-ZCSv nanocrystals held over the structure of ZIF-8. The granular T-ZCSv (translucent yellow area in Fig. 2e) is distributed around the ZIF-8 polyhedron and is held with ZIF-8 by close contact (marked with a red dashed line). Fig. 2d confirms that the T-ZCSv nanocrystals are well dispersed over the surfaces of ZIF-8 compared to the independent clusters of the T-ZCSv nanocrystals (Fig. 2a). Fig. 2d and e show no clusters of T-ZCSv nanoparticles, suggesting that the dispersion of T-ZCSv was significantly improved due to the introduction of ZIF-8, which is consistent with SEM results. Furthermore, Fig. 2f shows twinned ZB crystal structures associated with WZ-twin boundaries in the T-ZCSv nanocrystals for ZIF-8@T-ZCSv (1300 mg). The longitudinal columns of the ZB structures distinguished by the WZ structure are confirmed by the FFT pattern indexed based on the [011] zone axis shown as an inset. The patterns indicate the appearance of (111)/[11
]-slips interrupts the continuity in the ZB structure, resulting in twin structures. These twin crystals can be associated with homojunctions originating from the WZ twin boundary slips in the T-ZCSv. Fig. 2g schematically represents the ZB phase with a face-centred cubic (FCC) structure of “⋯ABCABC⋯” order in the 〈111〉 direction of its tightly packed structure. The WZ phase with a hexagonal structure possesses “⋯ABABAB⋯” order of atomic planes in the closely-packed [0001] direction.30 The appearance of periodic stacking faults in the “⋯ABCABC⋯” ordered arrangement of the FCC structure along the 〈111〉 crystal plane introduces discontinuities in the sphalerite ZB's structure. Consequently, dislocations are created at discontinuities with “⋯CAC⋯” or “⋯BAB⋯” stacking of atomic planes (Fig. 2h). These dislocations distinguish the neighboring lattice segments with “A” as a mirror symmetry which are thus known as coherent twin boundaries or coherent twin planes. These “⋯CAC⋯” or “⋯BAB⋯” twin planes belong to the wurtzite structure, and therefore the twin boundaries are called wurtzite twin boundaries (WZ-TBs), forming twinned superlattices. Fig. 2(c and c-1) depicts mirror-symmetric lattice (zigzag) stripes distributed on both sides of the twin boundaries, and the order of twin lattice arrangement changed to “⋯CAC⋯” or “⋯BAB⋯” or vice versa. Several wurtzite structural phases are identified on many T-ZCSv nanocrystals in the present samples. The wurtzite structure can also occur with two or three diatomic layers, as shown in Fig. S1† for the T-ZCSv nanocrystals. These ZB/WZ twin boundaries produce interfacial-homogeneous junctions, which remarkably influence the electronic properties of the T-ZCSv nanocrystals and thus effectively boost the vectorial separation and transport of charge carriers.15,31Fig. 2d and e are the TEM images of ZIF-8@T-ZCSv (1300 mg) monitored at different resolutions that describe the T-ZCSv nanocrystals held over the structure of ZIF-8. The granular T-ZCSv (translucent yellow area in Fig. 2e) is distributed around the ZIF-8 polyhedron and is held with ZIF-8 by close contact (marked with a red dashed line). Fig. 2d confirms that the T-ZCSv nanocrystals are well dispersed over the surfaces of ZIF-8 compared to the independent clusters of the T-ZCSv nanocrystals (Fig. 2a). Fig. 2d and e show no clusters of T-ZCSv nanoparticles, suggesting that the dispersion of T-ZCSv was significantly improved due to the introduction of ZIF-8, which is consistent with SEM results. Furthermore, Fig. 2f shows twinned ZB crystal structures associated with WZ-twin boundaries in the T-ZCSv nanocrystals for ZIF-8@T-ZCSv (1300 mg). The longitudinal columns of the ZB structures distinguished by the WZ structure are confirmed by the FFT pattern indexed based on the [011] zone axis shown as an inset. The patterns indicate the appearance of (111)/[11![[2 with combining macron]](https://www.rsc.org/images/entities/char_0032_0304.gif) ]-slips in the twinned nanocrystals, confirming that the twinning characteristics of T-ZCSv's structure is unaffected by the presence of ZIF-8. Furthermore, the lattice of the ZIF-8@T-ZCSv (1300 mg) composite exhibits smudged regions marked with yellow arrows representing the lattice defects which can be attributed to the S vacancies. These distinctive structural features are expected to display unusually high activity in photocatalytic reactions.
]-slips in the twinned nanocrystals, confirming that the twinning characteristics of T-ZCSv's structure is unaffected by the presence of ZIF-8. Furthermore, the lattice of the ZIF-8@T-ZCSv (1300 mg) composite exhibits smudged regions marked with yellow arrows representing the lattice defects which can be attributed to the S vacancies. These distinctive structural features are expected to display unusually high activity in photocatalytic reactions.
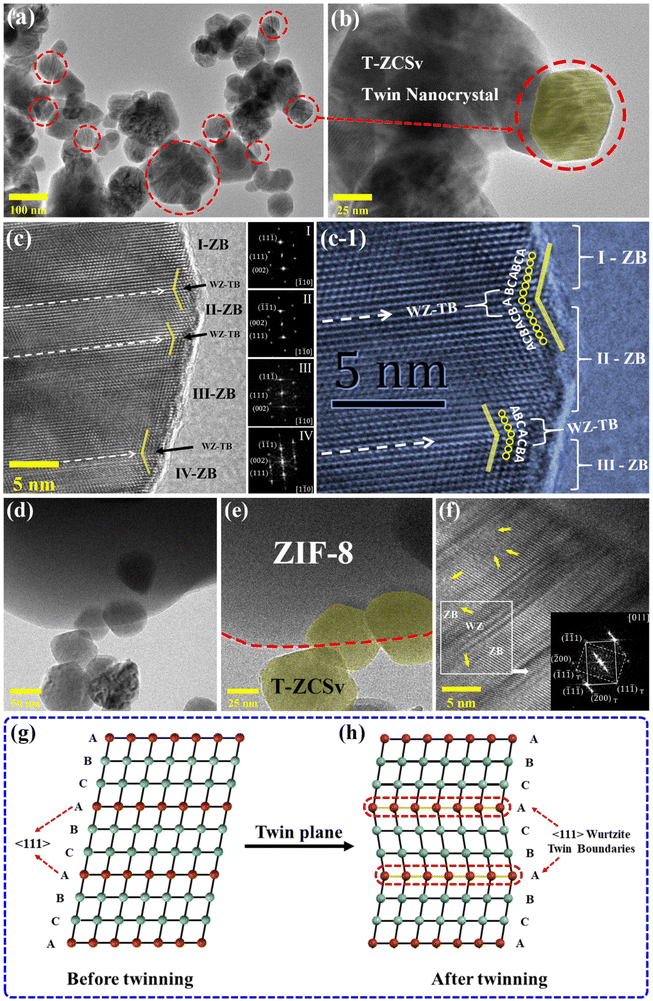 | ||
| Fig. 2 TEM images of T-ZCSv (a–c) and ZIF-8@T-ZCSv (1300 mg) (d–f) at different magnifications. The corresponding structural model of the twinning nanocrystal (g and h). | ||
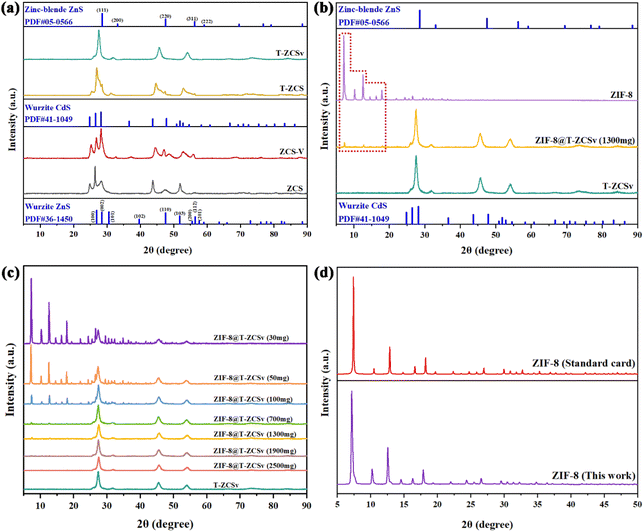
XRD technique was employed to study the characteristic crystallinity and crystal phases for the series of photocatalysts. Four different kinds of Zn0.5Cd0.5S solid solution, including ZCS, ZCS-V, T-ZCS and T-ZCSv samples exhibit different crystal properties in Fig. 3a. The XRD pattern of the S vacancy containing-ZCS-V and ZCS exhibits the diffraction peaks corresponding to wurtzite CdS (JCPDF#41-1049) and wurtzite ZnS (JCPDF#36-1450), respectively.32 For the ZCS, the characteristic diffraction peaks located around 2θ ∼ 24.8° (100), 26.4° (002), 28.2° (101), 43.8° (110), and 51.9° (112) are attributed to the planes given within the parentheses, which belong to the hexagonal wurtzite Zn0.5Cd0.5S phase. It is observed that the peak intensity of ZCS-V decreases, and the position of the peaks shifts to a higher angle in comparison with that of ZCS, which is ascribed to the structural modification due to the presence of S vacancies and corresponding surface disorder. However, the positions of the diffraction peaks pertaining to ZCS and ZCS-V are located at the angular positions that lie between CdS and ZnS, which means that the prepared Zn0.5Cd0.5S is formed into a solid solution of ZnS and CdS rather than an ordinary physical combination of ZnS and CdS.14,25 Besides, the XRD patterns of T-ZCS and T-ZCSv with twin crystal exhibit two sets of characteristic peaks corresponding to Wurtzite CdS (JCPDF#41-1049) and Zinc-Blende ZnS (JCPDF#05-0566), respectively.33 The position of characteristic peaks for T-ZCS are located between that of CdS and ZnS i.e., at 25.4°, 26.9°, 28.4°, 44.6° and 52.9° which is ascribed to the theoretical 0.5![[thin space (1/6-em)]](https://www.rsc.org/images/entities/char_2009.gif) :
:![[thin space (1/6-em)]](https://www.rsc.org/images/entities/char_2009.gif) 0.5 = Zn
0.5 = Zn![[thin space (1/6-em)]](https://www.rsc.org/images/entities/char_2009.gif) :
:![[thin space (1/6-em)]](https://www.rsc.org/images/entities/char_2009.gif) Cd (molar ratio). The peaks belong to the (100), (002), (101), (110), (112) planes of wurtzite CdS and (111), (220), (311) planes of zinc blende ZnS. Some additional peaks of ZnS observed for T-ZCS are assigned to different solubility limits and nucleation rates, and this phenomenon has been confirmed in our previous reports.34 Moreover, a set of sharp peaks of T-ZCSv are found at 27.6°, 45.6°, and 54.1°, which are attributed to (111), (220), and (311) planes of zinc blende ZnS and (002), (110), and (112) planes of wurtzite CdS, indicating that the T-ZCSv solid solution was successfully prepared. Two sets of diffraction peaks attributed to the ZB and WZ phases are observed for T-ZCS and T-ZCSv, suggesting the presence of the W/Z phase junctions and twin crystalline structure in the solid solution.
Cd (molar ratio). The peaks belong to the (100), (002), (101), (110), (112) planes of wurtzite CdS and (111), (220), (311) planes of zinc blende ZnS. Some additional peaks of ZnS observed for T-ZCS are assigned to different solubility limits and nucleation rates, and this phenomenon has been confirmed in our previous reports.34 Moreover, a set of sharp peaks of T-ZCSv are found at 27.6°, 45.6°, and 54.1°, which are attributed to (111), (220), and (311) planes of zinc blende ZnS and (002), (110), and (112) planes of wurtzite CdS, indicating that the T-ZCSv solid solution was successfully prepared. Two sets of diffraction peaks attributed to the ZB and WZ phases are observed for T-ZCS and T-ZCSv, suggesting the presence of the W/Z phase junctions and twin crystalline structure in the solid solution.
The XRD patterns of ZIF-8 and twinned T-ZCSv nanocrystals with S vacancy, including their composites with different amounts of T-ZCSv, are presented in Fig. 3(b–d). The diffraction pattern of the ZIF-8 polyhedron exhibits three sharp and intense diffraction peaks at 7.2°, 12.6° and 17.9° which are well matched with the CIF file of ZIF-8 standard card (CCDC: 864309†) of Mercury software, confirming the high crystallinity of the synthesized ZIF-8.29 Additionally, the typical peaks corresponding to T-ZCSv and ZIF-8 were observed in the diffraction pattern of the ZIF-8@T-ZCSv composites. The relative intensity of the ZIF-8's distinct peaks seem to decrease gradually with the content of T-ZCSv and almost disappeared when the mass of T-ZCSv exceeded 1900 mg due to the relatively low concentration of ZIF-8. In other words, the intensity of T-ZCSv's diffraction peaks increases significantly with the ratio of T-ZCSv. However, the position of diffraction peaks pertaining to either ZIF-8 and T-ZCSv show no observable shift for ZIF-8@T-ZCSv, indicating that the formation of the ZIF-8@T-ZCSv composite with different masses of T-ZCSv did not affect the crystal structure and atomic alignment of each of the components and confirmed the formation of the composite using an ageing method. No characteristic diffraction peaks of the compounds other than T-ZCSv and ZIF-8 were found in the composites, suggesting that no new crystalline phases or compounds were produced during the synthesis of ZIF-8@T-ZCSv and confirming that the introduction of ZIF-8 did not affect the crystallinity and purity of T-ZCSv. XRD studies indicate that the ZIF-8 acts as a substrate in composites, providing space to improve redistribution and thus facilitates a wider exceptional dispersion of T-ZCSv. The results are consistent with those of the SEM and TEM studies.
The surface physical adsorption properties of ZIF-8 polyhedra, ZIF-8@T-ZCSv composites, and pure T-ZCSv nanoparticles were explored via the BET test at 77 K. The N2 adsorption–desorption plot of ZIF-8 (Fig. 4a) showed a type I isotherm conforming to the BDDT (Brunauer–Deming–Demin–Teller) classification. N2 starts to fill the micropores of ZIF-8 in the region of low pressure (0 < P/P0 < 0.05), resulting in a rapid increase in gas adsorption and a plateau region without an observable increase (0.05 < P/P0 < 0.97). Besides, the adsorption isotherm showed a slow increasing trend when the relative pressure (P/P0) approaches 1.0, and no hysteresis loop was observed for ZIF-8, suggesting that ZIF-8 possesses micropores. On the other hand, the N2 adsorption–desorption isotherms of T-ZCSv showed a rise in the high-pressure region after 0.9, which is attributed to capillary coagulation and defined as a typical type IV with a narrow H3-type hysteresis loop, confirming the presence of a mesopore structure. The N2 adsorption–desorption isotherms of different ZIF-8@T-ZCSv composites showed a similar shape to that of ZIF-8 and T-ZCSv based on the mass of T-ZCSv. The isotherm of the composite with a lower T-ZCSv mass depicts close features of ZIF-8, and the composite with a higher T-ZCSv mass exhibits a similar shape to T-ZCSv's isotherm. The measured physical properties, such as the total surface area of the samples, the average volume and size of the pores for ZIF-8, T-ZCSv and various ZIF-8@T-ZCSv composites, are given in Table 1. The specific surface area of ZIF-8, ZIF-8@T-ZCSv (100 mg), ZIF-8@T-ZCSv (700 mg), ZIF-8@T-ZCSv (1300 mg), ZIF-8@T-ZCSv (1900 mg), ZIF-8@T-ZCSv (2500 mg) and T-ZCSv were measured and found to be 1302.011 m2 g−1, 448.441 m2 g−1, 121.227 m2 g−1, 77.586 m2 g−1, 45.239 m2 g−1, 34.187 m2 g−1 and 17.328 m2 g−1, respectively. The specific surface area for the ZIF-8@T-ZCSv composites is gradually reduced with the amount of T-ZCSv. Additionally, the pore size increased with the amount of T-ZCSv, indicating a good dispersion of T-ZCSv particles over the surface of ZIF-8 and preventing the aggregation of T-ZCSv particles. The variation in surface physical characteristics for the ZIF-8@T-ZCSv series confirms the successful synthesis of the composite with the expected uniform distribution of T-ZCSv particles on the surface of ZIF-8. This enabled one of the members, ZIF-8@T-ZCSv (1300 mg), to possess more reactive center sites that adsorb reactants for high photocatalytic activity.
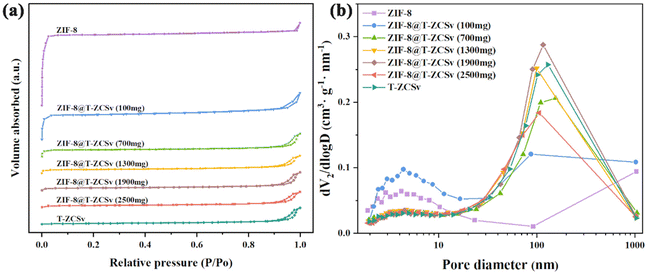 | ||
| Fig. 4 N2 adsorption/desorption analysis spectra (a) and the pore size distribution (b) of the pristine T-ZCSv, different ZIF-8@T-ZCSv, and ZIF-8 samples. | ||
| Samples | Surface area (m2 g−1) | Pore volume (cm3 g−1) | Pore size (nm) |
|---|---|---|---|
| ZIF-8 | 1302.011 | 0.753 | 2.313 |
| ZIF-8@T-ZCSv (100 mg) | 448.441 | 0.424 | 3.784 |
| ZIF-8@T-ZCSv (700 mg) | 121.227 | 0.208 | 6.872 |
| ZIF-8@T-ZCSv (1300 mg) | 77.586 | 0.160 | 8.919 |
| ZIF-8@T-ZCSv (1900 mg) | 45.239 | 0.164 | 14.531 |
| ZIF-8@T-ZCSv (2500 mg) | 34.187 | 0.140 | 16.356 |
| T-ZCSv | 17.328 | 0.155 | 34.387 |
XPS was employed to determine the chemical compositions and chemical states of ZIF-8, T-ZCSv, and ZIF-8@T-ZCSv composites with different contents of T-ZCSv in Fig. 5. The typical XPS survey spectra (Fig. 5a) of various samples show the existence of zinc, cadmium, sulphur, and carbon in T-ZCSv and Zn, C, N elements in ZIF-8, and the coexistence of C, N, Zn, Cd, and S in ZIF-8@T-ZCSv, indicating the successful formation of ZIF-8@T-ZCSv composites. The XPS spectra were calibrated to the C 1s peak of 284.8 eV (Fig. 5b) of ZIF-8. The high-resolution comparative spectra of ZIF-8 and three composites in the region from 396 eV to 407 eV (Fig. 5c) showed N 1s for ZIF-8 at 398.9 eV and N 1s and Cd 3d5/2 for the composites. The relative intensity of N 1s of ZIF-8 decreased with the T-ZCSv content as the relative content of ZIF-8 decreased in the ZIF-8@T-ZCSv composites, but the N 1s peak exists in all compounds (Inset).
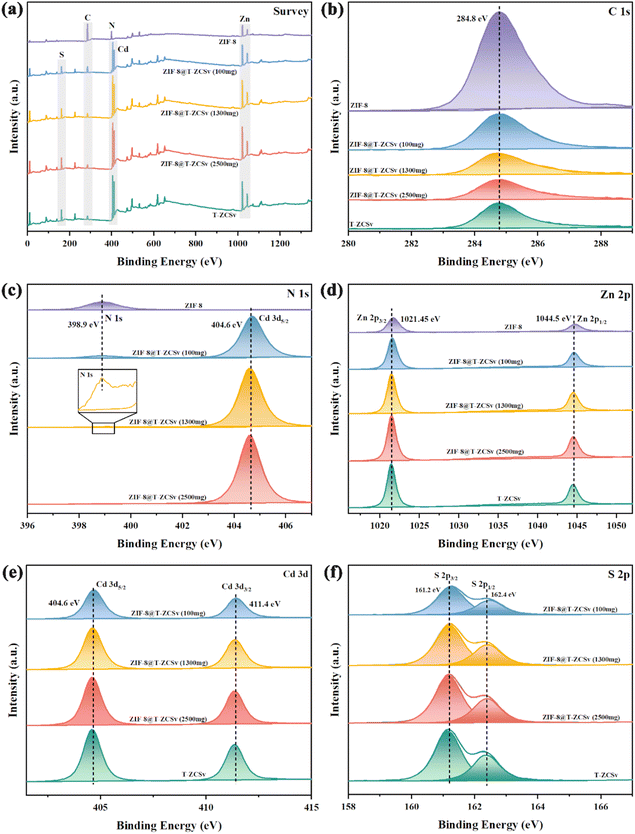 | ||
| Fig. 5 Survey spectra (a) and high-resolution XPS spectra of pristine T-ZCSv and ZIF-8@T-ZCSv for C 1s (b), N 1s (c), Zn 2p (d), Cd 3d (e), and S 2p (f). | ||
Furthermore, the high-resolution Zn 2p comparative spectra of all the samples depict two sharp peaks located at ∼1021.4 and 1044.5 eV (Fig. 5d) corresponding to the doublet of Zn 2p3/2 and Zn 2p1/2. The Cd 3d binding energy region compared to the spectra of three composites and T-ZCSv (Fig. 5e) contains a doublet of Cd 3d5/2 (404.6 eV) and Cd 3d3/2 (411.4 eV). The S 2p region of the spectra (Fig. 5f) for three composites and T-ZCSv are resolved into two typical binding energy peaks at ∼161.2 and 162.4 eV, which correspond to S 2p3/2 and S 2p1/2, respectively. The separation of the Zn 2p, Cd 3d and S 2p doublet-peaks is approximately 23.1 eV, 6.8 eV and 1.2 eV, respectively, confirming the existence of Zn2+, Cd2+ and S2− states in the twinned T-ZCSv with WZ and ZB. Moreover, these peaks become more intense with the amount of T-ZCSv, and no observable shift in the peak positions for the composites, evidencing the increased mass of T-ZCSv negligibly affected structure of the ZIF-8 framework. However, for T-ZCSv nanoparticles, the S 2p peaks shifted to a lower binding energy position. It can be explained based on the existing S vacancies, which act as strong electron-deficient groups, and cause a distortion in the equilibrium of the electron cloud of the T-ZCSv's surface due to the low coordination resulting from the escape of S atoms.35,36 Consequently, electron transport is boosted and the lifetime of electrons is prolonged during the photocatalytic reaction. The investigation confirmed that ZIF-8 serves merely as the substrate that provides more space for T-ZCSv to avoid the aggregation and does not affect the twinned structure and vacancies. This structural feature dramatically enhances the dispersion of T-ZCSv to facilitate more active sites for exposure, which agrees with the SEM and BET analysis.
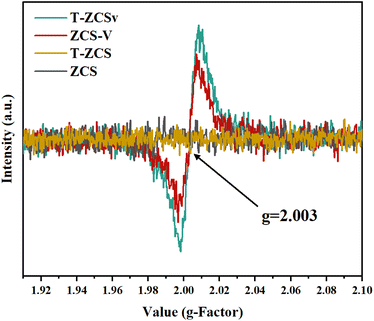
EPR spectra (Fig. 6) were recorded to further investigate the S vacancies over the surface of ZCS, ZCS-V, T-ZCS, and T-ZCSv. Vacuum deoxidation treatment was performed to avoid the interference of adsorbed oxygen on the surface of the samples for all products prior to the EPR test. There are no obvious paramagnetic signals of ZCS and T-ZCS in the EPR spectra. However, the spectra of ZCS-V and T-ZCSv exhibit two typical symmetrical EPR signals peaked at g = 2.003, indicating the appearance of S vacancies on the surface of these two samples,37 converging with XPS studies. EPR studies demonstrate that an appropriate amount of NaOH and hydrazine hydrate with a strong alkali property, used as a reducing agent in the hydrothermal reaction process, can control the formation of sulfur vacancies by providing a powerful reducing environment with relatively low formation energy favorable for the formation of S vacancies.32,38 Besides, excess S sources (thiourea and thioacetamide) will accumulate on the surface of the nanocrystal and considerably hinder the formation of the crystals, which is also one of the crucial reasons for the formation of S vacancies.39 The introduction of S vacancies plays a critical role in promoting photocatalytic activity. Firstly, S vacancies may change the band structure of electron energy, induce the reorganization of the crystal lattice, and create unsaturated active sites that act as electron traps. These active sites could also contribute to enhancing the space–charge separation and effectively improve the kinetic properties of photogenerated charges. Besides, S vacancies accelerate the electron migration from T-ZCSv to the vacancy sites due to their electron-deficient solid characteristics. Consequently, an effective separation and migration of photogenerated electrons and holes can be achieved over the surface of T-ZCSv, which effectively supports the photocatalytic production of hydrogen.
Fig. 7 shows the UV-vis spectra and measured Tauc plots to investigate the light absorption properties and band gap of four types of Zn0.5Cd0.5S solid solutions with distinctive characteristics (Fig. 7a and c), ZIF-8 and ZIF-8@T-ZCSv (1300 mg) (Fig. 7b and d). The absorption edges correspond to the fundamental absorption of ZCS, T-ZCS, ZCS-V and T-ZCSv were located at about 549, 517, 510 and 500 nm, respectively in Fig. 7a, indicating that bound electrons of all samples can be excited by visible light and thus the samples showed excellent visible absorption capacity. The absorption edges of ZCS-V, T-ZCS and T-ZCSv showed a blue shift toward a shorter wavelength compared to those of ZCS. T-ZCSv exhibits the largest blueshift over 49 nm, resulting from the coexistence of twinned structure and S vacancies associated with the defective state energy level.40 The optical absorption characteristics of ZIF-8 (Fig. 7b), show an absorption edge at 248 nm (inset), but the ZIF-8@T-ZCSv (1300 mg) composite exhibits the same absorption edge as T-ZCSv (500 nm). This demonstrates that the ZIF-8 polyhedron, as a metal–organic framework, can be excited by ultraviolet light and thus has poor visible-light photocatalytic performance. Consequently, the presence of ZIF-8 polyhedron in the ZIF-8@T-ZCSv (1300 mg) composite has negligible influence on the visible light sensitivity of T-ZCSv, demonstrating that the ZIF-8 acts as a substrate framework to improve the dispersion ability of T-ZCSv, which is supposed to lead to efficient photocatalysis. In addition, the corresponding band gap energies of various samples were calculated using the Tauc plots with the Kubelka–Munk function, according to the following formula:
| αhν = A(hν − Eg)n |
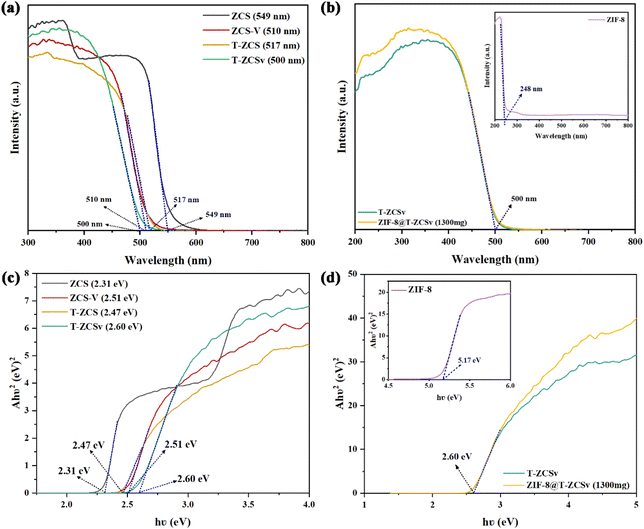 | ||
| Fig. 7 UV-vis diffuse reflectance spectra and band gap evaluation from the corresponding Tauc plots: (a and c) ZCS, ZCS-V, T-ZCS and T-ZCSv samples; (b and d) ZIF-8 and ZIF-8@T-ZCSv. | ||
The transient photocurrent (TPC) measurements were carried out to investigate the photogenerated charge carrier dynamics, including charge carrier separation and migration in four different Zn0.5Cd0.5S photocatalysts. A series of on–off irradiation cycles (each for every 30 s) was employed using a 300 W Xe Lamp (λ ≥ 420 nm). The transient photocurrent density (Fig. 8a) of ZCS-V, T-ZCS and T-ZCSv are significantly higher than that of ZCS, indicating better separation of free electrons and holes provided by the twinned crystal structure and appropriate S vacancies of Zn0.5Cd0.5S. Specifically, T-ZCSv exhibits the highest photocurrent density in the series with the order of T-ZCSv > T-ZCS > ZCS-V > ZCS. This trend indicates that the charge transfer in the ZCS with a twinned structure is faster than that of the ZCS with S vacancies. The movement of charges across the interfaces of the ZB and WZ phases contributes to their faster transport.24 The highest TPC density of T-ZCSv among the four samples confirms that the twin structure and S vacancies are crucial for further improvement of photocatalytic performance. Electrochemical impedance spectra (EIS) of Nyquist plots (Fig. 8b) display varying curvature radii for different samples of the series, which are in the order T-ZCSv < T-ZCS < ZCS-V < ZCS. The shorter the curvature radius, the lower the charge transfer resistance, implying quicker electron and hole transfer and better electrical conductivity. Therefore, T-ZCSv possesses the lowest charge transfer resistance compared to other Zn0.5Cd0.5S photocatalysts. Combining the TPC and EIS measurements, it can be confirmed that the T-ZCSv exhibits faster charge transfer pathways and less probable charge recombination. The introduced twinned crystal structure and surface S vacancies alter the structural properties of Zn0.5Cd0.5S, which probably leads to a remarkable improvement in photocatalytic hydrogen production.
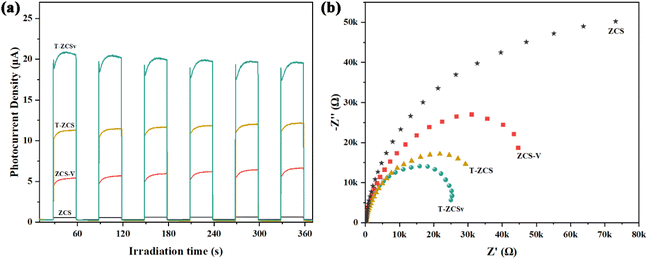 | ||
| Fig. 8 Photocurrent response (a) and electrochemical impedance spectroscopy (b) of the ZCS, ZCS-V, T-ZCS, and T-ZCSv. | ||
To evaluate the rate of photocatalytic production of hydrogen (RPH) of the prepared four kinds of Zn0.5Cd0.5S solid solutions (including ZCS, ZCS-V, T-ZCS and T-ZCSv) and different ZIF-8@T-ZCSv composites in a solution of Na2SO3 (0.25 M) and Na2S·9H2O (0.35 M) as sacrificial agents, a Xe lamp (300 W, λ > 420 nm) was used to irradiate the samples for 200 min. A 50 mg of sample was added to the reacting solution to carry out the photocatalytic H2 production experiment for different photocatalysts. Fig. 9a represents the RPH against time for ZCS, ZCS-V, T-ZCS and T-ZCSv, whereas Fig. 9b depicts a histogram for the RPH of the different samples. The measured RPH values are compared in Table 2 when 50 mg of the samples are used. Pure ZCS, without S vacancies and twinned crystal structure, exhibited the lowest RPH, i.e., 32.0 μmol h−1 or 0.64 mmol g−1 h−1. However, the ZCS-V with S vacancies and the T-ZCS with twinned-crystal structure showed improved RPH 329.44 μmol h−1 or 6.58 mmol g−1 h−1 and 412.92 μmol h−1 or 8.25 mmol g−1 h−1 respectively, which are 10.3 and 12.9 times that of the pristine ZCS, respectively under the similar experimental conditions. Interestingly, T-ZCSv with S vacancies and twin-crystalline structure displays an impressive hydrogen evolution activity of nearly 551.74 μmol h−1 or 11.03 mmol g−1 h−1, which are 1.3, 1.7 and 17.3 times that of T-ZCS, ZCS-V and ZCS, respectively. The enhanced RPH performance is attributed to S vacancies and the twin-crystalline structure containing a WZ/ZB interfacial homogeneous junction, which facilitates better electron trapping and prolonged electron lifetime and promotes charge separation. In addition, sulfur vacancies serve as active sites that adsorb oxygen in H2O molecules during the photolytic splitting of the water reaction, thus improving the efficiency of photocatalytic hydrogen production.
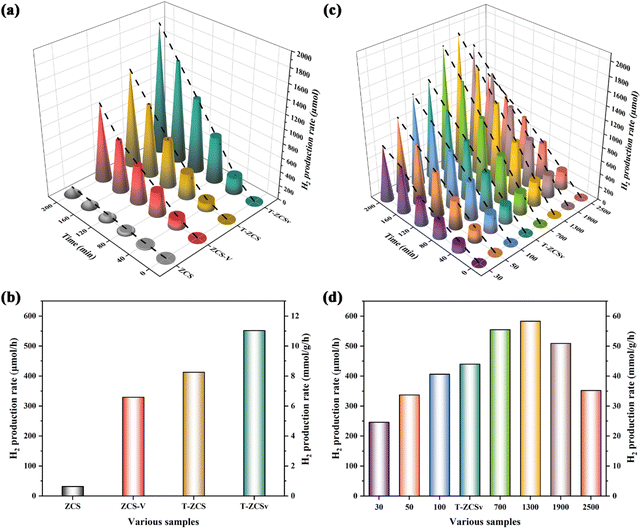 | ||
| Fig. 9 Photocatalytic hydrogen production performance for various samples: (a and b) ZCS, ZCS-V, T-ZCS and T-ZCSv; (c and d) a series of ZIF-8@T-ZCSv composites with different contents. | ||
Selecting T-ZCSv that exhibited the highest hydrogen production activity, a series of ZIF-8@T-ZCSv composites were synthesized by varying the mass of T-ZCSv. T-ZCSv serves as the core catalyst, and the ZIF-8 polyhedron with a large specific surface area acts as a substrate that supports a uniform dispersion of T-ZCSv nanoparticles over its surface. A comparative study of hydrogen production activity carried out against time for T-ZCSv, and ZIF-8@T-ZCSv with varied masses of T-ZCSv is given in Fig. 9c. Fig. 9d is the histogram of hydrogen production activity for the T-ZCSv and ZIF-8@T-ZCSv composites with 10 mg of the samples used in the production of hydrogen. The RPH of the ZIF-8@T-ZCSv composites were found to increase with the amount of T-ZCSv to 1300 mg. The maximum RPH exhibited by ZIF-8@T-ZCSv (1300 mg) is 583.25 μmol h−1 or 58.32 mmol g−1 h−1, which is almost 1.4 times that of T-ZCSv (439.92 μmol h−1 or 43.99 mmol g−1 h−1). Meanwhile, the optimal ZIF-8@T-ZCSv (1300 mg) was performed for 10 h to verify long-term activity and the results are shown in Fig. S3.† The hydrogen production efficiency of ZIF-8@T-ZCSv (1300 mg) is not only undiminished with the prolongation of the reaction time, but was also still relatively stable and the high activity after 10 h was about 655.31 μmol h−1 or 65.53 mmol g−1 h−1. Additionally, a comparative study of the hydrogen production rates of Zn0.5Cd0.5S-based composites reported in the recent literature was also performed in Table S2.† In our present work, ZIF-8@T-ZCSv (1300 mg) exhibits excellent photocatalytic hydrogen production activity for the composites, which is better than that of other ZnxCd1−xS-based photocatalysts. The main reason for the improvement of RPH performance is attributed to the effect of substrate ZIF-8 polyhedron contributing to better dispersion ability of T-ZCSv by avoiding agglomeration and therefore exposing more active sites.41 Nevertheless, due to the relatively low content of T-ZCSv, ZIF-8@T-ZCSv (30 mg), ZIF-8@T-ZCSv (50 mg), and ZIF-8@T-ZCSv (100 mg) display lower RPH performance, i.e., 246.1 μmol h−1 or 24.61 mmol g−1 h−1, 337.27 μmol h−1 or 33.72 mmol g−1 h−1 and 406.48 μmol h−1 or 40.64 mmol g−1 h−1 respectively, which are less than the RPH of T-ZCSv. The lower performance of these samples can be explained based on the shielding effect provided by the dominant ZIF-8 framework to the active sites of T-ZCSv, which causes poor light absorption by the T-ZCSv. Furthermore, the hydrogen production efficiency of ZIF-8@T-ZCSv (1900 mg and 2500 mg) composites decreased with the mass of T-ZCSv, indicating the re-emergence of the agglomeration phenomenon of T-ZCSv nanoparticles due to their dominant content. T-ZCSv aggregates loose light-exposable active sites and therefore exhibits poorer absorption of visible light. The specific RPH of the samples are shown in Table 3. The measured values suggest that an appropriate amount of T-ZCSv solid solution is homogeneously dispersed on the surface of ZIF-8 polyhedra, which is vital to improve photocatalytic efficiency.
| Samples | H2 production ratea (μmol h−1) | H2 production rate (mmol g−1 h−1) |
|---|---|---|
| a 10 mg T-ZCSv and ZIF-8@T-ZCSv composites were used in the photocatalytic production of hydrogen. | ||
| ZIF-8@T-ZCSv (30 mg) | 246.10 | 24.61 |
| ZIF-8@T-ZCSv (50 mg) | 337.27 | 33.72 |
| ZIF-8@T-ZCSv (100 mg) | 406.48 | 40.64 |
| T-ZCSv | 439.92 | 43.99 |
| ZIF-8@T-ZCSv (700 mg) | 554.98 | 55.49 |
| ZIF-8@T-ZCSv (1300 mg) | 583.25 | 58.32 |
| ZIF-8@T-ZCSv (1900 mg) | 508.87 | 50.88 |
| ZIF-8@T-ZCSv (2500 mg) | 352.20 | 35.22 |
To elucidate the electron transport mechanism across the interfacial homojunction for the enhanced RPH of ZIF-8@T-ZCSv composites, the Mott–Schottky curves of T-ZCSv were investigated to determine the conduction band (CB) and valence band (VB) alignments, including the band gap energy (Eg), respectively. The Eg of T-ZCSv containing sulfur vacancies and twin crystal structure with WZ/ZB homogeneous junction is measured as 2.60 eV using the Tauc plot with Kubelka–Munk function as shown in Fig. 10a. Additionally, the Mott–Schottky plots were used to determine the nature of the semiconducting samples and the flat band potential (Efb) of T-ZCSv in 0.1 M Na2SO4 electrolyte (frequency used is 1 K Hz). The positive slope of the linear portion in Fig. 10b indicates that T-ZCSv is an n-type semiconductor. The Fermi energy level (Efb) of n-type semiconductors is close to the CB potentials (ECB),42–44 so the calculated ECB of T-ZCSv is −0.6 V (vs. NHE). Combining the Eg and ECB of T-ZCSv, the corresponding VB potentials (EVB) of T-ZCSv are estimated as 2.0 V (vs. NHE) with reference to the equation; EVB = Eg + ECB, which agrees with the previous report.13 Based on the energy band structure measurements, an appropriate mechanism for the improved photocatalytic evolution of hydrogen was proposed in Fig. 10c. The ECB and EVB values of the ZB region are slightly lower (more negative) than those of the WZ region near the interface of the ZB and WZ portions in the twin-crystalline T-ZCSv solid-solution. Consequently, a new distinctive homogeneous junction like the S scheme heterogeneous junction is formed at the interface. Through in situ XPS spectroscopy measurements of the T-ZCSv sample before and after illumination (Fig. S4†), it was observed that the binding energy of Cd 3d shifted towards higher values, while the binding energy of S 2p shifted towards lower values. This observation suggests that Cd acts as an electron donor in the structure, while S acts as an electron acceptor. Upon illumination, S receives electrons from Cd, resulting in the creation of an electric field in the interfacial region. This electric field causes significant bending of the band edges, particularly in the interior or the region near the heterojunction, where the gradient of band bending is more pronounced. Hence, the ISIXPS results successfully elucidate the electron transfer pathway in the T-ZCSv S-scheme heterojunction. The valence band electrons (bound electrons) are transferred to the CB in T-ZCSv upon the visible light illumination, and the corresponding holes have remained in its VB. The photoinduced holes in the VB of the WZ segment and photoinduced electrons in the CB of the ZB segment are inclined to recombine at the interface due to the coulombic attraction between the band structures of WZ and ZB at the WZ/ZB homogeneous junction. Thus, the isolation and transportation of photo charges is achieved by the electric field developed across the homojunction, while the useless electrons and holes are removed by recombination and the powerful photogenerated electrons in the CB of WZ were retained to participate in the photocatalytic hydrogen production.16,45
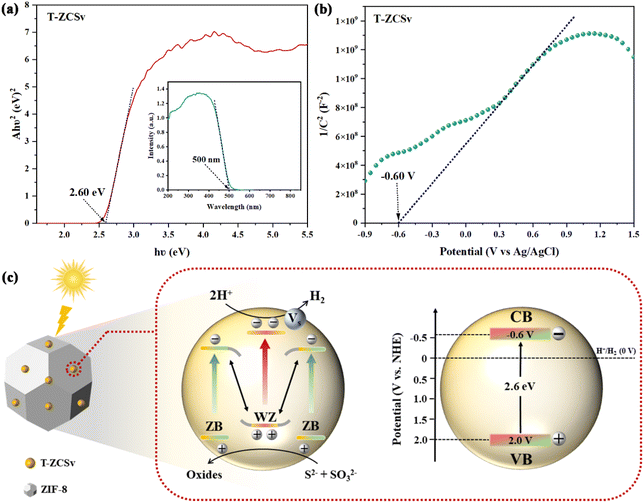 | ||
| Fig. 10 (a) Band gap energy and UV-vis diffuse reflection spectra (inset) of T-ZCSv; (b) Mott–Schottky curves of T-ZCSv; (c) mechanism for enhanced photocatalytic performance for ZIF-8@T-ZCSv. | ||
On the other hand, S vacancies trap free electrons and capture the abundant electrons on the CB of T-ZCSv, which not only is beneficial for prolonging the electron lifetime, but also promotes the transportation of photoinduced electrons from bulk to the surface of T-ZCSv for a reduction reaction with H+ ions of water to generate H2 (0 V vs. NHE). Meanwhile, the corresponding excess holes in the VB of T-ZCSv are oxidized by sulfide sacrificial agents (S2− and SO32−), thus improving the HPR activities. In other words, the synergistic effect of the WZ/ZB twin boundaries and S vacancies contributed to the enhanced photocatalytic activity of T-ZCSv and the ZIF-8@T-ZCSv composites. The reaction process can be described by the following equations:
| ZIF-8@T-ZCSv + hν → e− + h+ |
| 2H2O + 2e− → H2 + 2OH− |
| SO32− + 2OH− + 2h+ → SO42− + 2H+ |
| 2S2− + 2h+ → S22− |
| S22− + SO32− → S2O32− + S2− |
Furthermore, the unique 3D/0D ZIF-8@T-ZCSv spatial structure possesses an extraordinary feature. The structurally larger ZIF-8 with a higher specific surface area can be exploited as a substrate that provides space and facilitates the proper dispersion of T-ZCSv nanoparticles. This feature significantly reduces the aggregation of T-ZCSv and leads to more surface-active sites exposed for the photocatalytic reaction. In summary, the twinned WZ/ZB interfacial homogeneous junction and the rich surface S vacancies exist in T-ZCSv, and an appropriate amount of ZIF-8 polyhedron substrate [ZIF-8@T-ZCSv (1300 mg)] provides a synergetic effect leading to a remarkable improvement in the hydrogen production efficiency.
Conclusions
A series of different characteristics of Zn0.5Cd0.5S solid solutions with WZ/ZB homojunctions and rich-surface S vacancies has been respectively designed and synthesized by simple and practical methods. Synergy of the twinned superlattices and S vacancies of the samples could boost the isolation and transportation efficiency of photoinduced electron–hole pairs and extend the electron lifetime in the absence of any cocatalyst under visible-light irradiation. Furthermore, the introduction of appropriate ZIF-8 polyhedra with a large specific surface area can provide a suitable 3D space dispersion to avoid aggregation of T-ZCSv nanoparticles for exposing more reactive sites in the photocatalytic reaction. In synergy with the above advantages, ZIF-8@T-ZCSv (1300 mg) demonstrated that the optimized photocatalytic H2 production activity reached 583.25 μmol h−1. The sulfur vacancies can effectively trap electrons, the twinned structure homojunction can support the isolation of photogenerated carriers, and ZIF-8 can hinder the agglomeration phenomenon of T-ZCSv. The synergistic effect of these three factors is supposed to result in a dramatic increase in the hydrogen production performance for the ZIF-8@T-ZCSv composite. The research work not only provides a theoretical basis and experimental support to design high-performance Zn0.5Cd0.5S-based photocatalysts, but also provides a comparable reference scheme for Zn0.5Cd0.5S-based photocatalysts with unique characteristics.Author contributions
Yuhao Zhang: conceptualization, methodology, formal analysis, investigation, and writing (original draft). Dingze Lu: conceptualization, funding acquisition, resources, and writing (review and editing). Min Zhou and Kiran Kumar Kondamareddy: supervision, writing (review and editing), and resources. Zhennan Wang and Jing Li: validation, supervision, and writing (review and editing). Huiqing Fan: conceptualization, methodology, supervision, and writing (review and editing). Dezhong Cao: writing (review and editing). Wingkei Ho: conceptualization, visualization, supervision, data curation, and writing (review and editing).Conflicts of interest
The authors confirm no conflicts of interest.Acknowledgements
This work was supported by the General Research Fund (18300920) of Research Grants Council and Dean's Research Fund (FLASS/DRF 04738) of the Faculty of Liberal Arts and Social Sciences, the Education University of Hong Kong, Hong Kong Special Administrative Region, the National Natural Science Foundation of China (No. 51802245), the Natural Science Basic Research Plan in the Shaanxi Province of China (No. 2023-JC-ZD-25 and 2023-JC-YB-590), Shaanxi Province (Qin ChuangYuan) “Scientist+Engineer” Team Building (2022KXJ-040), China Postdoctoral Science Foundation Funding (No. 2018M631188), Shaanxi Provincial Department of Education Key Scientific Research Project (No. 22JY024), and Graduate Innovation Foundation of Xi'an Polytechnic University (No. chx2022023).References
- Y. H. Liu, X. L. Zheng, Y. Q. Yang, Y. M. Song, Y. J. Yang, J. Li, C. M. Shim, Y. J. Shen and X. L. Tian, Recent Advances in the Hydrogen Evolution Reaction of ZnxCd1−xS-Based Photocatalysts, Sol. RRL, 2022, 6, 2101061 CrossRef CAS.
- J. M. Chen, S. M. Lv, Z. R. Shen, P. L. Tian, J. Y. Chen and Y. W. Li, Novel ZnCdS quantum dots engineering for enhanced visible-light-driven hydrogen evolution, ACS Sustainable Chem. Eng., 2019, 7, 13805–13814 CrossRef CAS.
- D. L. Huang, M. Wen, C. Y. Zhou, Z. H. Li, M. Cheng, S. Chen, W. J. Xue, L. Lei, Y. Yang and W. P. Xiong, ZnxCd1-xS based materials for photocatalytic hydrogen evolution, pollutants degradation and carbon dioxide reduction, Appl. Catal., B, 2020, 267, 118651 CrossRef CAS.
- X. X. Zhao, J. R. Feng, J. Liu, W. Shi, G. M. Yang, G. C. Wang and P. Cheng, An Efficient, Visible-Light-Driven, Hydrogen Evolution Catalyst NiS/ZnxCd1−xS Nanocrystal Derived from a Metal–Organic Framework, Angew. Chem., 2018, 130, 9938–9942 CrossRef.
- B. Debnath, S. Dhingra and C. Nagaraja, Recent Developments in the Design of CdxZn1−xS-Based Photocatalysts for Sustainable Production of Hydrogen, Sol. RRL, 2021, 5, 2100226 CrossRef CAS.
- L. Cheng, Q. J. Xiang, Y. L. Liao and H. W. Zhang, CdS-based photocatalysts, Energy Environ. Sci., 2018, 11, 1362–1391 RSC.
- Q. M. Sun, N. Wang, J. H. Yu and J. C. Yu, A hollow porous CdS photocatalyst, Adv. Mater., 2018, 30, 1804368 CrossRef PubMed.
- N. N. Meng, C. B. Liu, Y. Liu, Y. F. Yu and B. Zhang, Efficient electrosynthesis of syngas with tunable CO/H2 ratios over ZnxCd1−xS-amine inorganic–organic hybrids, Angew. Chem., Int. Ed., 2019, 58, 18908–18912 CrossRef CAS PubMed.
- Y. Liu, J. A. Zapien, Y. Y. Shan, C. Y. Geng, C. S. Lee and S. T. Lee, Wavelength-Controlled Lasing in ZnxCd1−xS Single-Crystal Nanoribbons, Adv. Mater., 2005, 17, 1372–1377 CrossRef CAS PubMed.
- C. Y. Zhang, H. H. Liu, W. N. Wang, H. S. Qian, S. Cheng, Y. Wang, Z. B. Zha, Y. J. Zhong and Y. Hu, Scalable fabrication of ZnxCd1-xS double-shell hollow nanospheres for highly efficient hydrogen production, Appl. Catal., B, 2018, 239, 309–316 CrossRef CAS.
- C. C. Chan, C. C. Chang, C. H. Hsu, Y. C. Weng, K. Y. Chen, H. H. Lin, W. C. Huang and S. F. Cheng, Efficient and stable photocatalytic hydrogen production from water splitting over ZnxCd1−xS solid solutions under visible light irradiation, Int. J. Hydrogen Energy, 2014, 39, 1630–1639 CrossRef CAS.
- Y. B. Wang, J. C. Wu, J. W. Zheng and R. Xu, Highly active ZnxCd1-xS photocatalysts containing earth abundant elements only for H2 production from water under visible light, Catal. Sci. Technol., 2011, 1, 940–947 RSC.
- W. Y. Dong, Y. T. Liu, G. M. Zeng, S. Q. Zhang, T. Cai, J. L. Yuan, H. Chen, J. Gao and C. B. Liu, Regionalized and vectorial charges transferring of Cd1−xZnxS twin nanocrystal homojunctions for visible-light driven photocatalytic applications, J. Colloid Interface Sci., 2018, 518, 156–164 CrossRef CAS PubMed.
- Y. Y. Li, B. W. Sun, H. F. Lin, Q. Q. Ruan, Y. L. Geng, J. Liu, H. Wang, Y. Yang, L. Wang and K. C. Tam, Efficient visible-light induced H2 evolution from T-CdxZn1-xS/defective MoS2 nano-hybrid with both bulk twinning homojunctions and interfacial heterostructures, Appl. Catal., B, 2020, 267, 118702 CrossRef CAS.
- M. C. Liu, D. W. Jing, Z. H. Zhou and L. J. Guo, Twin-induced one-dimensional homojunctions yield high quantum efficiency for solar hydrogen generation, Nat. Commun., 2013, 4, 1–8 Search PubMed.
- Q. L. Xu, L. Y. Zhang, B. Cheng, J. J. Fan and J. G. Yu, S-scheme heterojunction photocatalyst, Chem, 2020, 6, 1543–1559 CAS.
- J. W. Fu, Q. L. Xu, J. X. Low, C. J. Jiang and J. G. Yu, Ultrathin 2D/2D WO3/g-C3N4 step-scheme H2-production photocatalyst, Appl. Catal., B, 2019, 243, 556–565 CrossRef CAS.
- L. Y. Zhang, J. J. Zhang, H. G. Yu and J. G. Yu, Emerging S-scheme photocatalyst, Adv. Mater., 2022, 34, 2107668 CrossRef CAS PubMed.
- X. N. Wang, M. Sayed, O. Ruzimuradov, J. Y. Zhang, Y. S. Fan, X. X. Li, X. J. Bai and J. X. Low, A review of step-scheme photocatalysts, Appl. Mater. Today, 2022, 29, 101609 CrossRef.
- L. Lu, Y. F. Shen, X. H. Chen, L. H. Qian and K. Lu, Ultrahigh Strength and High Electrical Conductivity in Copper, Science, 2004, 304, 422–426 CrossRef CAS PubMed.
- A. P. Sutton, Interfaces in crystalline materials, in Monographs on the Physics and Chemistry of Materials, 1995, pp. 414–423 Search PubMed.
- B.-J. Ng, L. K. Putri, X. Y. Kong, K. P. Y. Shak, P. Pasbakhsh, S.-P. Chai and A. R. Mohamed, Sub-2 nm Pt-decorated Zn0.5Cd0.5S nanocrystals with twin-induced homojunctions for efficient visible-light-driven photocatalytic H2 evolution, Appl. Catal., B, 2018, 224, 360–367 CrossRef CAS.
- H. Du, K. Liang, C. Z. Yuan, H. L. Guo, X. Zhou, Y. F. Jiang and A. W. Xu, Bare Cd1-xZnxS ZB/WZ Heterophase Nanojunctions for Visible Light Photocatalytic Hydrogen Production with High Efficiency, ACS Appl. Mater. Interfaces, 2016, 8, 24550–24558 CrossRef CAS PubMed.
- J. Wang, Y. H. Ma, X. Q. Jiang and H. Du, Vectorial carriers interfacial migration of Cd1-xZnxS heterophase junctions for visible-light water splitting, J. Alloys Compd., 2021, 854, 156850 CrossRef CAS.
- Y. H. Liu, X. L. Zheng, Y. Q. Yang, Y. M. Song, Y. J. Yang, J. Li, C. M. Shim, Y. J. Shen and X. L. Tian, Recent Advances in the Hydrogen Evolution Reaction of ZnxCd1-xS-Based Photocatalysts, Sol. RRL, 2022, 6, 2101061 CrossRef CAS.
- H. Li, C. Tsai, A. L. Koh, L. Cai, A. W. Contryman, A. H. Fragapane, J. Zhao, H. S. Han, H. C. Manoharan and F. Abild-Pedersen, Activating and optimizing MoS2 basal planes for hydrogen evolution through the formation of strained sulphur vacancies, Nat. Mater., 2016, 15, 48–53 CrossRef CAS PubMed.
- K. Jiang, M. Luo, Z. X. Liu, M. Peng, D. C. Chen, Y. R. Lu, T. S. Chan, F. M. De Groot and Y. W. Tan, Rational strain engineering of single-atom ruthenium on nanoporous MoS2 for highly efficient hydrogen evolution, Nat. Commun., 2021, 12, 1687 CrossRef CAS PubMed.
- J. Qiu, X. G. Zhang, Y. Feng, X. F. Zhang, H. T. Wang and J. F. Yao, Modified metal-organic frameworks as photocatalysts, Appl. Catal., B, 2018, 231, 317–342 CrossRef CAS.
- Y. Liu, H. Cheng, M. Cheng, Z. F. Liu, D. L. Huang, G. X. Zhang, B. B. Shao, Q. H. Liang, S. H. Luo and T. Wu, The application of Zeolitic imidazolate frameworks (ZIFs) and their derivatives based materials for photocatalytic hydrogen evolution and pollutants treatment, Chem. Eng. J., 2021, 417, 127914 CrossRef CAS.
- H. Zhao, C. F. Li, X. Yong, P. Kumar, B. Palma, Z. Y. Hu, G. Van Tendeloo, S. Siahrostami, S. Larter and D. W. Zheng, Coproduction of hydrogen and lactic acid from glucose photocatalysis on band-engineered Zn1-xCdxS homojunction, iScience, 2021, 24, 102109 CrossRef CAS PubMed.
- H. Du, K. Liang, C. Z. Yuan, H. L. Guo, X. Zhou, Y. F. Jiang and A. W. Xu, Bare Cd1−xZnxS ZB/WZ Heterophase Nanojunctions for Visible Light Photocatalytic Hydrogen Production with High Efficiency, ACS Appl. Mater. Interfaces, 2016, 8, 24550–24558 CrossRef CAS PubMed.
- H. Yang, A. L. Meng, L. N. Yang and Z. J. Li, Construction of S-scheme heterojunction consisting of Zn0.5Cd0.5S with sulfur vacancies and NixCo1-x(OH)2 for highly efficient photocatalytic H2 evolution, Chem. Eng. J., 2022, 432, 134371 CrossRef CAS.
- R. R. Sun, J. A. Song, H. T. Zhao and X. Y. Li, Control on the homogeneity and crystallinity of Zn0.5Cd0.5S nanocomposite by different reaction conditions with high photocatalytic activity for hydrogen production from water, Mater. Charact., 2018, 144, 57–65 CrossRef CAS.
- Y. H. Zhang, D. Z. Lu, H. Li, K. Kumar Kondamareddy, H. M. Wang, B. Y. Zhang, J. X. Wang, Q. Wu, Y. M. Zeng, X. Y. Zhang, M. Zhou, D. Neena, H. J. Hao, H. Y. Pei and H. Q. Fan, Enhanced visible Light-Driven photocatalytic hydrogen evolution and stability for noble Metal-Free MoS2/Zn0.5Cd0.5S heterostructures with W/Z phase junctions, Appl. Surf. Sci., 2022, 586, 152770 CrossRef CAS.
- C. Du, Q. Zhang, Z. Y. Lin, B. Yan, C. X. Xia and G. W. Yang, Half-unit-cell ZnIn2S4 monolayer with sulfur vacancies for photocatalytic hydrogen evolution, Appl. Catal., B, 2019, 248, 193–201 CrossRef CAS.
- B. J. Sun, J. Q. Bu, Y. C. Du, X. Y. Chen, Z. Z. Li and W. Zhou, O, S-dual-vacancy defects mediated efficient charge separation in ZnIn2S4/black TiO2 heterojunction hollow spheres for boosting photocatalytic hydrogen production, ACS Appl. Mater. Interfaces, 2021, 13, 37545–37552 CrossRef CAS PubMed.
- Y. X. Tan, Z. M. Chai, B. H. Wang, S. Tian, X. X. Deng, Z. J. Bai, L. Chen, S. Shen, J. K. Guo and M. Q. Cai, Boosted photocatalytic oxidation of toluene into benzaldehyde on CdIn2S4-CdS: Synergetic effect of compact heterojunction and S-vacancy, ACS Catal., 2021, 11, 2492–2503 CrossRef CAS.
- E. Ha, S. H. Ruan, D. Y. Li, Y. M. Zhu, Y. P. Chen, J. Y. Qiu, Z. H. Chen, T. T. Xu, J. Y. Su and L. Y. Wang, Surface disorder engineering in ZnCdS for cocatalyst free visible light driven hydrogen production, Nano Res., 2022, 15, 996–1002 CrossRef CAS.
- Y. Y. Qin, H. Li, J. Lu, Y. H. Feng, F. Y. Meng, C. C. Ma, Y. S. Yan and M. J. Meng, Synergy between van der Waals heterojunction and vacancy in ZnIn2S4/g-C3N4 2D/2D photocatalysts for enhanced photocatalytic hydrogen evolution, Appl. Catal., B, 2020, 277, 119254 CrossRef CAS.
- G. Q. Zhang, X. Ling, G. S. Liu, Y. S. Xu, S. N. Xiao, Q. T. Zhang, X. Yang, C. T. Qiu, H. W. Mi and C. L. Su, Construction of Defective Zinc-Cadmium-Sulfur Nanorods for Visible-Light-Driven Hydrogen Evolution Without the Use of Sacrificial Agents or Cocatalysts, ChemSusChem, 2020, 13, 756–762 CrossRef CAS PubMed.
- H. Y. Li, X. Q. Hao, Y. Liu, Y. B. Li and Z. L. Jin, ZnxCd1-xS nanoparticles dispersed on CoAl-layered double hydroxide in 2D heterostructure for enhanced photocatalytic hydrogen evolution, J. Colloid Interface Sci., 2020, 572, 62–73 CrossRef CAS PubMed.
- J. W. Fu, B. C. Zhu, C. J. Jiang, B. Cheng, W. You and J. G. Yu, Hierarchical porous O-doped g-C3N4 with enhanced photocatalytic CO2 reduction activity, Small, 2017, 13, 1603938 CrossRef PubMed.
- T. Q. Wang, Y. F. Wang, M. Z. Sun, A. Hanif, H. Wu, Q. F. Gu, Y. S. Ok, D. C. Tsang, J. Y. Li and J. H. Yu, Thermally treated zeolitic imidazolate framework-8 (ZIF-8) for visible light photocatalytic degradation of gaseous formaldehyde, Chem. Sci., 2020, 11, 6670–6681 RSC.
- T. Q. Wang, Z. F. Jiang, K. H. Chu, D. Wu, B. Wang, H. L. Sun, H. Y. Yip, T. C. An, H. J. Zhao and P. K. Wong, X-Shaped α-FeOOH with Enhanced Charge Separation for Visible-Light-Driven Photocatalytic Overall Water Splitting, ChemSusChem, 2018, 11, 1365–1373 CrossRef CAS PubMed.
- Y. J. Bao, S. Q. Song, G. J. Yao and S. J. Jiang, S-scheme photocatalytic systems, Sol. RRL, 2021, 5, 2100118 CrossRef CAS.
Footnote |
| † Electronic supplementary information (ESI) available. See DOI: https://doi.org/10.1039/d3qi01187a |
| This journal is © the Partner Organisations 2023 |

