A high-frequency QCM biosensing platform for label-free detection of the SARS-CoV-2 spike receptor-binding domain: an aptasensor and an immunosensor†
Qingqing
Zhang‡
a,
Shuping
Liu‡
b,
Xiaohua
Zhang
 a,
Cuicui
Du
a,
Shihui
Si
*b and
Jinhua
Chen
a,
Cuicui
Du
a,
Shihui
Si
*b and
Jinhua
Chen
 *a
*a
aState Key Laboratory of Chemo/Biosensing and Chemometrics, College of Chemistry and Chemical Engineering, Hunan University, Changsha, 410082, P. R. China. E-mail: chenjinhua@hnu.edu.cn
bCollege of Chemistry and Chemical Engineering, Central South University, Changsha, 410083, P. R. China. E-mail: sishihui@163.com; Fax: +86-731-88821848; Tel: +86-731-88821848
First published on 20th January 2023
Abstract
Herein, high-frequency quartz crystal microbalance biosensing platforms were constructed using an aptamer and antibody as bioreceptors for fast and label-free detection of the SARS-CoV-2 RBD.
The coronavirus disease (COVID-19), caused by severe acute respiratory syndrome coronavirus 2 (SARS-CoV-2) in 2019, poses a serious threat to global public health. Although SARS-CoV-2 and influenza virus are similar in clinical features, such as modes of transmission (direct communication, aerosols or airborne droplets) and symptoms (fever, cough, nausea, vomiting, fatigue, muscle pain, etc.), COVID-19 is more contagious and has a higher mortality rate than influenza.1–5 Frustratingly, the SARS-CoV-2 virus possibly coexists with the human-like influenza virus, placing an unprecedented burden on existing health systems.6 Therefore, a facile, fast and sensitive assay of SARS-CoV-2 is of great significance.7,8
To achieve the assay of SARS-CoV-2, several kinds of methods have been reported, such as electrochemistry,9,10 electrochemiluminescence,11 photoelectrochemistry,12,13 fluorescence,14 surface-enhanced Raman scattering,15 colorimetry,16,17 chemiluminescence18 and localized surface plasmon resonance.19 Actually, most of the above-mentioned methods use end-point assays which are laborious and time-consuming and due to this, the whole assay process usually involves incubation, washing, signal generation and amplification processes. In addition, the construction of most of the above biosensing platforms requires signal labels, which undoubtedly increases the cost.20,21 These facts inspired us to develop a real-time biosensing platform for rapid, sensitive and label-free detection of SARS-CoV-2.
The quartz crystal microbalance (QCM), a kind of mass-sensitive sensor at the nanogram or even picogram levels, which can detect the targets sensitively through monitoring the change of the resonance frequency of the QCM sensor caused by the mass change on the crystal surface,22 has been widely used in biochemical analysis due to its advantages of real-time monitoring, no labeling and high sensitivity.23,24 In the past three years, several studies have been reported for the detection of SARS-CoV-2 based on QCM techniques.25–27 However, those studies are based on quartz crystals with a low fundamental resonance frequency (5 MHz), which are limited by the problems of viscosity and water-mass effects, resulting in low sensitivity of the sensor.28,29 It was reported that the high-frequency QCM sensing technology successfully solved the above problems, and improved obviously the detection sensitivity due to the high fundamental resonance frequency.30,31 This encouraged us to develop a new high-frequency (100 MHz) quartz crystal microbalance (HF-QCM) biosensing platform for the highly sensitive detection of SARS-CoV-2.
Herein, a HF-QCM aptasensor and immunosensor were developed for the label-free detection of the SARS-CoV-2 spike receptor-binding domain (RBD) protein (Scheme 1). An amine-labeled aptamer (a single-stranded DNA sequence that binds to the RBD in a similar manner to antibodies—through shape recognition of the binding sites of the RBD)32,33 or antibody was immobilized on a QCM chip with a gold (Au) coating (Au chip) via an Au–NH2 bond between the Au and amine groups of the aptamer or antibody.34,35 After the non-specific active sites were blocked using bovine serum albumin (BSA), the modified chips were used to monitor the binding process of the targets (RBD) to aptamers or antibodies in real time on the HF-QCM platform. Thus, the RBD could be rapidly and sensitively detected using the developed HF-QCM biosensing platform.
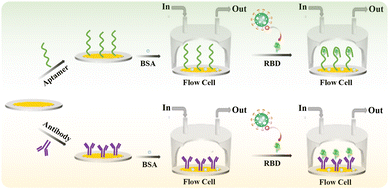 | ||
| Scheme 1 Schematic illustration of the developed high-frequency quartz crystal microbalance aptasensor and immunosensor for the detection of the RBD. | ||
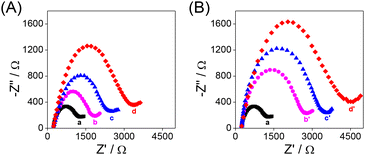
The modification processes of the QCM Au chips were characterized by electrochemical impedance spectroscopy (EIS) (Fig. 1). The semicircle diameter in the Nyquist diagram is related to the interfacial charge transfer resistance (Rct). When the Au chip (curve a) was modified with the aptamer (curve b) or antibody (curve b′) and further with BSA (curve c or c′), the Rct value increased consequently due to the poor electrical conductivity of the aptamer or antibody and BSA. When the BSA/aptamer/Au chip (BSA/antibody/Au chip) was incubated with 100 pg mL−1 RBD, due to the specific recognition of the RBD by the aptamer (antibody), an increase in the Rct value of the RBD/BSA/aptamer/Au chip (RBD/BSA/antibody/Au chip) was observed (curve d or d′). The results of EIS indicate that the proposed HF-QCM biosensing platform is successfully constructed according to Scheme 1.
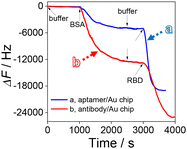
In order to explore the construction process of the HF-QCM biosensing platform, the frequency change of the HF-QCM was monitored in real time. As shown in Fig. 2, the injection of the buffer with a flow rate of 210 μL min−1 basically does not induce an obvious change in the frequency of the platform. However, after the injection of BSA to block the active sites of the aptamer/Au chip and antibody/Au chip, frequency changes of 5040 Hz for the aptamer/Au chip and 12![[thin space (1/6-em)]](https://www.rsc.org/images/entities/char_2009.gif) 800 Hz for the antibody/Au chip can be observed, indicating that the antibody/Au chip needs more BSA molecules to block the active sites than the aptamer/Au chip. This may be due to the much smaller size of aptamers than antibodies, allowing aptamers to be modified on the Au chip surface at a higher density. Thus, the exposed active sites of the aptamer/Au chip are much fewer than those of the antibody/Au chip. After washing the modified Au chip surface with buffer, the RBD (100 pg mL−1) solution was injected into the cell. It is noted that the frequency decreases obviously due to the specific recognition of the RBD by its aptamer or antibody. The total frequency change of the HF-QCM aptasensor reached 13
800 Hz for the antibody/Au chip can be observed, indicating that the antibody/Au chip needs more BSA molecules to block the active sites than the aptamer/Au chip. This may be due to the much smaller size of aptamers than antibodies, allowing aptamers to be modified on the Au chip surface at a higher density. Thus, the exposed active sites of the aptamer/Au chip are much fewer than those of the antibody/Au chip. After washing the modified Au chip surface with buffer, the RBD (100 pg mL−1) solution was injected into the cell. It is noted that the frequency decreases obviously due to the specific recognition of the RBD by its aptamer or antibody. The total frequency change of the HF-QCM aptasensor reached 13![[thin space (1/6-em)]](https://www.rsc.org/images/entities/char_2009.gif) 986 Hz in 600 s (the HF-QCM immunosensor reached 12
986 Hz in 600 s (the HF-QCM immunosensor reached 12![[thin space (1/6-em)]](https://www.rsc.org/images/entities/char_2009.gif) 167 Hz in 1000 s). These results indicate that the RBD can be assayed using the developed HF-QCM biosensing platform based on the frequency change value, and the aptamer can recognize the RBD more quickly and sensitively than the antibody. This is mainly ascribed to the difference in the sizes of the two bioreceptors, which allows higher immobilization density and surface coverage of aptamers on Au chips than those of antibodies.36,37 Therefore, a greater number of binding sites are available for the recognition of the RBD in the HF-QCM aptasensor than in the HF-QCM immunosensor, resulting in higher sensitivity of the HF-QCM aptassensor.38
167 Hz in 1000 s). These results indicate that the RBD can be assayed using the developed HF-QCM biosensing platform based on the frequency change value, and the aptamer can recognize the RBD more quickly and sensitively than the antibody. This is mainly ascribed to the difference in the sizes of the two bioreceptors, which allows higher immobilization density and surface coverage of aptamers on Au chips than those of antibodies.36,37 Therefore, a greater number of binding sites are available for the recognition of the RBD in the HF-QCM aptasensor than in the HF-QCM immunosensor, resulting in higher sensitivity of the HF-QCM aptassensor.38
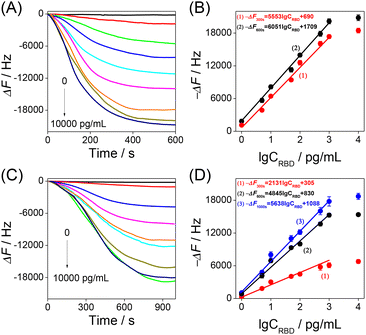
Thus, the developed HF-QCM aptasensor and HF-QCM immunosensor were used to monitor in real time the RBD–bioreceptor recognition process and detect the RBD. As shown in Fig. 3A and C, all the −ΔF values increased with the increase of recognition time and then reached a platform at 600 s for the HF-QCM aptasensor and at 1000 s for the HF-QCM immunosensor. Also, all the −ΔF values at a definite recognition time increased with the increase of the RBD concentration. Based on the results shown in Fig. 3A and C, the dependences of the −ΔF values at different recognition times on RBD concentration were obtained and are shown in Fig. 3B and D. A good linear relationship between the frequency changes (−ΔF values at 300 s and 600 s for the HF-QCM aptasensor; −ΔF values at 300 s, 600 s and 1000 s for the HF-QCM immunosensor) and the logarithm of RBD concentrations was obtained from 1 pg mL−1 to 1000 pg mL−1. Furthermore, the HF-QCM aptasensor has much larger linear slops than the HF-QCM immunosensor at the same recognition time, implying that the HF-QCM aptasensor has higher sensitivity than the HF-QCM immunosensor for the RBD assay. It is noted that 1 pg mL−1 RBD corresponds to 1832 Hz of the HF-QCM aptasensor (1 pg mL−1 RBD corresponds to 1057 Hz of the HF-QCM immunosensor). However, for the low-frequency (5 MHz) QCMs, 0.05 mg mL−1 SARS-CoV-2 spike protein (S1 subunit) corresponded to 10–90 Hz,25 and 0.468 mg mL−1 SARS-CoV-2 spike protein corresponded to 130–160 Hz.27 These results mean that the developed HF-QCM (100 MHz) aptasensor and immunosensor have much higher sensitivity than the low-frequency (5 MHz) QCMs. On the other hand, the developed HF-QCM biosensing platform shows much lower detection limits and a faster assay speed than other reported methods (Table 1).39–44 The excellent trace assay performance (the linear response range is as low as 1 pg mL−1) and the fast analysis process (as low as 5 minutes) show the great superiority of the proposed HF-QCM aptasensor and immunosensor in RBD assays.
| Method | Speed (min) | Detection limit (pg mL−1) | Linear range (ng mL−1) | Ref. |
|---|---|---|---|---|
| EC, electrochemistry; CL, colorimetry; PEC, photoelectrochemistry. | ||||
| EC | 45 | 110 | 1–1000 | 39 |
| EC | 30 | 22.91 | 1–1000 | 40 |
| EC | 30 | 360 | 0.5–250 | 41 |
| EC | 20 | 800 | 2.5–40 | 42 |
| CL | 20 | 260 | 0.26–2080 | 43 |
| PEC | 40 | 4200 | 17.5–1120 | 44 |
| HF-QCM aptasensor | 5 | 0.30 | 0.001–1 | This work |
| 10 | 0.25 | |||
| HF-QCM immunosensor | 5 | 0.85 | ||
| 10 | 0.36 | |||
| 17 | 0.32 | |||
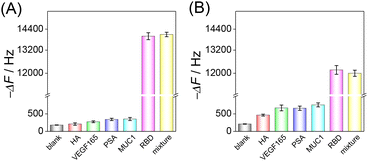
Selectivity is a key factor in assessing the practicality of the developed HF-QCM biosensing platform. Four possible interferents, hemagglutinin (HA), vascular endothelial growth factor 165 (VEGF165), prostate-specific antigen (PSA) and mucin 1 (MUC1), were used to evaluate the selectivity of the developed HF-QCM biosensing platform. As shown in Fig. 4, it can be seen that in the presence of the RBD, obvious frequency changes of the HF-QCM aptasensor (Fig. 4A) and the HF-QCM immunosensor (Fig. 4B) were obtained, but no significant changes were observed in the presence of other antigens. Also, no obvious difference in the frequency change was obtained for the RBD and the mixture of the RBD and interferents. These results mean that the developed HF-QCM biosensing platform has acceptable selectivity. Furthermore, Fig. 4 clearly indicates that the HF-QCM aptasensor shows better selectivity than the HF-QCM immunosensor, which is because the secondary structure of the aptamer reduces the probability of the electrostatic interaction between the aptamer and non-specific proteins.45
The reproducibility of the HF-QCM aptasensor and HF-QCM immunosensor was also assessed. For 100 pg mL−1 RBD, the frequency changes in six independent chips have a relative standard deviation (RSD) value of 2.0% for the HF-QCM aptasensor (Fig. 5A) and 3.2% for the HF-QCM immunosensor (Fig. 5B). Obviously, both the HF-QCM aptasensor and immunosensor show satisfactory reproducibility.
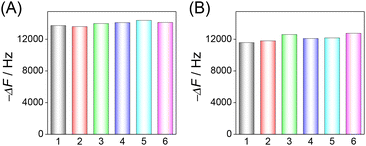 | ||
| Fig. 5 Reproducibility of the HF-QCM aptasensor (A) and immunosensor (B) in the same batch. CRBD = 100 pg mL−1. | ||
To verify the feasibility of the developed HF-QCM biosensing platform in complex samples, several concentrations (1, 10 and 100 pg mL−1) of the RBD were spiked in 10-fold diluted healthy human serum and 10-fold diluted healthy saliva samples, and recovery tests were performed. As shown in Fig. S1 and Table S1 (ESI†), the recoveries acquired from the HF-QCM aptasensor and immunosensor were acceptable, which indicates that the developed HF-QCM biosensing platform has great potential for the assay of the RBD in complex samples.
In summary, the HF-QCM aptasensor and immunosensor were developed for label-free assay of the SARS-CoV-2 spike receptor-binding domain (RBD) protein. The binding process of the RBD to the immobilized bioreceptors (aptamer and antibody) was monitored in real time using the HF-QCM biosensing platform, and the assay performance, in terms of dynamic response range, speed and sensitivity, was also investigated. Based on the HF-QCM technology, the RBD can be detected with a linear response range of 1 to 1000 pg mL−1 and the detection limit is as low as 0.25 pg mL−1 for the HF-QCM aptasensor and 0.32 pg mL−1 for the HF-QCM immunosensor. In particular, the proposed HF-QCM aptasensor and immunosensor show a fast analysis process (as low as 5 minutes), acceptable selectivity and reproducibility, and satisfactory recovery in diluted normal human serum and saliva samples. Furthermore, the proposed HF-QCM aptasensor and immunosensor can also be easily extended for other protein analyses by changing the specific aptamer and antibody. These findings imply that the developed HF-QCM aptasensor and immunosensor have great potential for application in the early and fast diagnosis of SARS-CoV-2 and other diseases.
Author contributions
Qingqing Zhang and Shuping Liu: data curation, investigation, formal analysis, visualization and writing – original draft. Xiaohua Zhang and Cuicui Du: validation and writing – review & editing. Shihui Si: resources, software, supervision and writing – review & editing. Jinhua Chen: conceptualization, methodology, project administration, writing – review & editing, supervision and funding acquisition.Conflicts of interest
There are no conflicts of interest to declare.Acknowledgements
This work was financially supported by the NSFC (21727810 and 22074033).References
- U. A. Awan, S. Zahoor, K. Rehman, A. A. Khattak, H. Ahmed, N. Aftab and M. S. Afzal, J. Med. Virol., 2021, 93, 1875–1877 CrossRef CAS PubMed.
- M. Giannella, M. Alonso, D. Garcia de Viedma, P. Lopez Roa, P. Catalán, B. Padilla, P. Muñoz and E. Bouza, Clin. Microbiol. Infect., 2011, 17, 1160–1165 CrossRef CAS PubMed.
- E. Cuadrado-Payán, E. Montagud-Marrahi, M. Torres-Elorza, M. Bodro, M. Blasco, E. Poch, A. Soriano and G. J. Piñeiro, Lancet, 2020, 395, e84 CrossRef PubMed.
- E. Petersen, M. Koopmans, U. Go, D. H. Hamer, N. Petrosillo, F. Castelli, M. Storgaard, S. A. Khalili and L. Simonsen, Lancet Infect. Dis., 2020, 20, e238–e244 CrossRef CAS PubMed.
- W. Kong, Y. Li, M. Peng, D. Kong, X. Yang, L. Wang and M. Liu, Nat. Microbiol., 2020, 5, 675–678 CrossRef CAS PubMed.
- T. N. A. Tran, N. B. Wikle, E. Albert, H. Inam, E. Strong, K. Brinda, S. M. Leighow, F. H. Yang, S. Hossain, J. R. Pritchard, P. Chan, W. P. Hanage, E. M. Hanks and M. F. Boni, BMC Med., 2021, 19, 162 CrossRef CAS PubMed.
- J. S. Lavine, O. N. Bjornstad and R. Antia, Science, 2021, 371, 741–745 CrossRef CAS PubMed.
- J. Hellewell, S. Abbott, A. Gimma, N. I. Bosse, C. I. Jarvis, T. W. Russell, J. D. Munday, A. J. Kucharski and W. J. Edmunds, Lancet Global Health, 2020, 8, e488–e496 CrossRef PubMed.
- R. Zeng, M. Qiu, Q. Wan, Z. Huang, X. Liu, D. Tang and D. Knopp, Anal. Chem., 2022, 94, 15155–15161 CrossRef CAS PubMed.
- M. A. Sadique, S. Yadav, P. Ranjan, R. Khan, F. Khan, A. Kumar and D. Biswas, ACS Appl. Bio Mater., 2022, 5, 2421–2430 CrossRef CAS PubMed.
- J. Gong, T. Zhang, T. Luo, X. Luo, F. Yan, W. Tang and J. Liu, Biosens. Bioelectron., 2022, 215, 114563 CrossRef CAS PubMed.
- Y. Chen, W. Duan, L. Xu, G. Li, Y. Wan and H. Li, Anal. Chim. Acta, 2022, 1211, 339904 CrossRef CAS PubMed.
- Z. Jiang, T. Zhao, C. Li, Y. Li and C. Huang, ACS Appl. Mater. Interfaces, 2021, 13, 49754–49761 CrossRef CAS PubMed.
- X. Ye, H. Zhou, X. Guo, D. Liu, Z. Li, J. Sun, J. Huang, T. Liu, P. Zhao, H. Xu, K. Li, H. Wang, J. Wang, L. Wang, W. Zhao, Q. Liu, S. Xu and Y. Feng, Biosens. Bioelectron., 2022, 207, 114169 CrossRef CAS PubMed.
- C. Tian, L. Zhao, G. Qi, J. Zhu and S. Zhang, Sens. Actuators, B, 2022, 371, 132445 CrossRef CAS PubMed.
- C. Liang, B. Liu, J. Li, J. Lu, E. Zhang, Q. Deng, L. Zhang, R. Chen, Y. Fu, C. Li and T. Li, Sens. Actuators, B, 2021, 349, 130718 CrossRef CAS PubMed.
- M. Wang, Y. Lin, J. Lu, Z. Sun, Y. Deng, L. Wang, Y. Yi, J. Li, J. Yang and G. Li, Chem. Eng. J., 2022, 429, 132332 CrossRef CAS PubMed.
- D. Liu, C. Ju, C. Han, R. Shi, X. Chen, D. Duan, J. Yan and X. Yan, Biosens. Bioelectron., 2021, 173, 112817 CrossRef CAS PubMed.
- Y. Yang, J. Murray, J. Haverstick, R. A. Tripp and Y. Zhao, Sens. Actuators, B, 2022, 359, 131604 CrossRef CAS PubMed.
- Z. Dong, L. Cheng, P. Zhang and G. Zhao, Analyst, 2020, 145, 3329–3338 RSC.
- C. Pöhlmann and T. Elßner, Toxins, 2020, 12, 727 CrossRef PubMed.
- G. Sauerbrey, Z. Phys., 1959, 155, 206–222 CrossRef CAS.
- P. He, L. Liu, W. Qiao and S. Zhang, Chem. Commun., 2014, 50, 1481–1484 RSC.
- Z. Dong, X. Jin and G. Zhao, Biosens. Bioelectron., 2018, 106, 111–116 CrossRef CAS PubMed.
- D. Dobrynin, I. Polishchuk, L. Portal, I. Zlotver, A. Sosnik and B. Pokroy, Mater. Today Bio, 2022, 14, 100265 CrossRef CAS PubMed.
- T. Wang, X. Fang, T. Wen, J. Liu, Z. Zhai, Z. Wang, J. Meng, Y. Yang, C. Wang and H. Xu, J. Med. Chem., 2021, 64, 14887–14894 CrossRef CAS PubMed.
- A. Luchini, S. Micciulla, G. Corucci, K. C. Batchu, A. Santamaria, V. Laux, T. Darwish, R. A. Russell, M. Thepaut, I. Bally, F. Fieschi and G. Fragneto, Sci. Rep., 2021, 11, 14867 CrossRef CAS PubMed.
- H. Ogi, T. Yanagida, M. Hirao and M. Nishiyama, Biosens. Bioelectron., 2011, 26, 4819–4822 CrossRef CAS PubMed.
- H. Ogi, H. Naga, Y. Fukunishi, M. Hirao and M. Nishiyama, Anal. Chem., 2009, 81, 8068–8073 CrossRef CAS PubMed.
- H. Ogi, K. Motoshisa, T. Matsumoto, K. Hatanaka and M. Hirao, Anal. Chem., 2006, 78, 6903–6909 CrossRef CAS PubMed.
- K. Noi, A. Iwata, F. Kato and H. Ogi, Anal. Chem., 2019, 91, 9398–9402 CrossRef CAS PubMed.
- V. Crivianu-Gaita and M. Thompson, Biosens. Bioelectron., 2016, 85, 32–45 CrossRef CAS PubMed.
- P. Dhar, R. M. Samarasinghe and S. Shigdar, Int. J. Mol. Sci., 2020, 21, 2485 CrossRef CAS PubMed.
- M. Li, Y. Wu, S. An and Z. Yan, ACS Omega, 2022, 7, 19622–19630 CrossRef CAS PubMed.
- J. Li, H. Ma, D. Wu, X. Li, Y. Zhao, Y. Zhang, B. Du and Q. Wei, Biosens. Bioelectron., 2015, 74, 104–112 CrossRef CAS PubMed.
- S. Arshavsky-Graham, K. Urmann, R. Salama, N. Massad-Ivanir, J.-G. Walter, T. Scheper and E. Segal, Analyst, 2020, 145, 4991–5003 RSC.
- A. Chen and S. Yang, Biosens. Bioelectron., 2015, 71, 230–242 CrossRef CAS PubMed.
- C. Yao, Y. Qi, Y. Zhao, Y. Xiang, Q. Chen and W. Fu, Biosens. Bioelectron., 2009, 24, 2499–2503 CrossRef CAS PubMed.
- A. Yakoh, U. Pimpitak, S. Rengpipat, N. Hirankarn, O. Chailapakul and S. Chaiyo, Biosens. Bioelectron., 2021, 176, 112912 CrossRef CAS PubMed.
- C. C. Pola, S. V. Rangnekar, R. Sheets, B. M. Szydłowska, J. R. Downing, K. W. Parate, S. G. Wallace, D. Tsai, M. C. Hersam, C. L. Gomes and J. C. Claussen, 2D Mater., 2022, 9, 035016 CrossRef CAS PubMed.
- M. A. Tabrizi and P. Acedo, Biosens. Bioelectron., 2022, 215, 114556 CrossRef PubMed.
- M. A. Tabrizi and P. Acedo, Appl. Surf. Sci., 2022, 598, 153867 CrossRef PubMed.
- Q. Zhu and X. Zhou, J. Hazard. Mater., 2022, 425, 127923 CrossRef CAS PubMed.
- M. A. Tabrizi, L. Nazari and P. Acedo, Sens. Actuators, B, 2021, 345, 130377 CrossRef PubMed.
- C. Yao, Y. Qi, Y. Zhao, Y. Xiang, Q. Chen and W. Fu, Biosens. Bioelectron., 2009, 24, 2499–2503 CrossRef CAS PubMed.
Footnotes |
| † Electronic supplementary information (ESI) available: Experimental section and supporting table. See DOI: https://doi.org/10.1039/d3an00008g |
| ‡ These authors contributed equally to this work. |
| This journal is © The Royal Society of Chemistry 2023 |

