 Open Access Article
The remarkable performance of a single iridium atom supported on hematite for methane activation: a density functional theory study†
Kefale Wagaw Yizengawab,
Tigist Ayalew Abaya,
Delele Worku Ayelec and
Jyh-Chiang Jiang *a
*a
aDepartment of Chemical Engineering, National Taiwan University of Science and Technology, Taipei 106, Taiwan. E-mail: jcjiang@mail.ntust.edu.tw
bFaculty of Chemical and Food Engineering, Bahir Dar Institute of Technology, Bahir Dar University, Bahir Dar, Ethiopia
cDepartment of Chemistry, College of Science, Bahir Dar University, Bahir Dar, Ethiopia
First published on 22nd August 2022
Abstract
Methane is the major component of natural gas, and it significantly contributes to global warming. In this study, we investigated methane activation on the α-Fe2O3(110) surface and M/α-Fe2O3(110) surfaces (M = Ag, Ir, Cu, or Co) using the density-functional theory (DFT) + U method. Our study shows that the Ir/α-Fe2O3(110) surface is a more effective catalyst for C–H bond activation than other catalyst surfaces. We have applied electron density difference (EDD), density of states (DOS), and Bader charge calculations to confirm the cooperative CH⋯O and agostic interactions between CH4 and the Ir/α-Fe2O3(110) surface. To further modify the reactivity of the Ir/α-Fe2O3(110) surface towards methane activation, we conducted a study of the effect of oxygen vacancy (OV) on C–H activation and CH4 dehydrogenation. In the comparison of pristine α-Fe2O3(110), Ir/α-Fe2O3(110), and Ir/α-Fe2O3(110)–OV surfaces, the Ir/α-Fe2O3(110)–OV surface is the best in terms of CH4 adsorption energy and C–H bond elongation, whereas the Ir/α-Fe2O3(110) surface catalyst has the lowest C–H bond activation barrier for the CH4 molecule. The calculations indicate that the Ir/α-Fe2O3(110)–OV surface could be a candidate catalyst for CH4 dehydrogenation reactions.
1. Introduction
Methane is the major component of natural gas and a potential clean energy carrier because of its highest H to C ratio of any fossil fuel.1–4 With the industrial revolution, methane is considered an alternative to nonrenewable petroleum resources and plays a significant role in the energy field.5–8 Consequently, the combustion of methane leads to 25% of the global CO2 emission, and methane itself is a greenhouse gas, which has a relative greenhouse impact of 25 times greater than CO2. This rise in the greenhouse gas concentration, predominantly methane in the earth's atmosphere, triggered an increase in global air pollution and surface temperature.9,10 Hence, the methane conversion to valuable commodity chemicals near its source is essential in the industry and addresses environmental concerns.Over the decades, various strategies, including direct and indirect routes, have been developed to use methane effectively; however, the C–H bond activation under mild conditions is challenging.10–13 The chemical products based on direct methane conversion have received significant interest in recent decades from industry and academia due to their more energy-efficient and environmental-friendliness.14–16 The rutile IrO2 surface has been the subject of intensive theoretical17–19 and experimental studies,20–22 among the different catalysts in methane conversion owing to its remarkable reactivity. In addition, much evidence endorses this superior catalytic reactivity and intrinsic electronic characteristics of the IrO2 surface in methane activation.23 Besides its higher reactivity, the high cost and the natural scarcity of iridium significantly limit its further development and application.
The doping of a single metal atom in metal oxide surfaces has attracted considerable interest, as it could afford precious metal thrifting and solve the ultimate goal of designing efficient and low-cost catalysts in heterogeneous catalysis.24–28 For example, Y. Meng et al. demonstrated that the doping of the Pd atom improved the thermodynamic stability and catalytic performance of the Cu(111) surface towards partial oxidation of methane than the single Pd atom adsorbed surface.28 Similarly, Guo and coworkers29 have recently shown that Rh doped Ni(111) catalyst exhibits promising performance for coke resistance in the CH4/CO2 reforming reaction. Besides, the density functional theory calculations by Eisenberg and Baer have demonstrated that doping of Li atom on MgO significantly eases the hydrogen abstraction reaction from methane.27 Furthermore, recent studies have described the role of single metal atom dopants in Al2O3 and zeolites for the activity, selectivity, stability, and regeneration capability of catalysts in propane and light alkane dehydrogenation.30–32 Previous studies have shown that the metal oxides doped with low-valence metal atoms show better catalytic activity towards methane activation than the non-doped oxides.33–35 Compared with other metal oxides, hematite is abundant, inexpensive, and environmentally benign. It has been widely used as a catalyst and supports catalysis because of its stability and attractive physicochemical properties.36–38 Furthermore currently researchers used iridium oxide as a catalyst for methane activation. But iridium oxide is rare earth metal oxide and it is too expensive.
Motivated by these analyses and to design the low-cost catalyst with the comparable catalytic performance of IrO2(110) surface, in this work, we designed a distinct type of different single-atom doped on hematite (α-Fe2O3) surface. In addition, we explored its catalytic activity towards methane adsorption and activation using density functional theory calculations. Furthermore, previous studies39 indicate that the presence of oxygen vacancies in the metal oxide supports enhanced the methane activation; hence we also examined the effects of a single oxygen vacancy on the hematite support for C–H activation.
2. Computational details
All the spin-polarized DFT calculations were carried out using the widely used plane wave Vienna ab initio simulation package (VASP).40,41 The nonlocal optB88-vdW exchange–correlation functional was used in this study, which explicitly includes the effects of van der Waals forces.42–44 The core electrons were represented by the projector augmented wave (PAW),45 and the energy cutoff for all the calculations was set to 500 eV based on our benchmark results. The atomic positions were optimized until the total energy converged to 10−4 eV, and the atomic positions were relaxed using the quasi-Newton algorithm until the x, y, and z components of the unconstrained atomic force were smaller 2 × 10⁻² eV Å−1. To treat the on-site Coulomb and exchange interaction of the strongly localized 3d electrons of metal atoms, here we employed the DFT + U mechanism. The DFT + U is a widely used method to describe transition metal-related studies and we conduct the benchmark calculation of the U value for each transition metal. Thus, one of the most common approaches to determine the appropriate values of U is to compare the calculated band gap for a set of U values with the experimental band gap.46,47 As shown in Fig. 1S,† when the U value increases the band gap of the oxide also increase for all dopant case. The experimental band gaps are 0,48 2.18,49 2.85,50 1.6,51 and 1.3 eV52 for IrO2, Fe2O3, CuO, CoO, and Ag2O, respectively. Therefore, we use a combination of calculated U values derived from the fitting band gaps. For Ag, Cu, Ir, Co, and Fe, we use 5.0 eV, 4.0 eV, 0.0 eV, 3.0 eV, and 4.0 eV, respectively. Similar studies also use combination U vales for heteroatom systems.53–57As shown in Fig. 2S,† the simulated XRD pattern of the α-Fe2O3 bulk structure shows the strongest intensity of (104) orientation, which agrees with the experimental results.58 However, based on our surface energy calculated results for the three dominant surface planes of hematite (α-Fe2O3(104, 110, and 012)), α-Fe2O3(110) surface with the least surface energy is the most stable one, as shown in Table 1S.† Therefore, we selected the α-Fe2O3(110) surface.
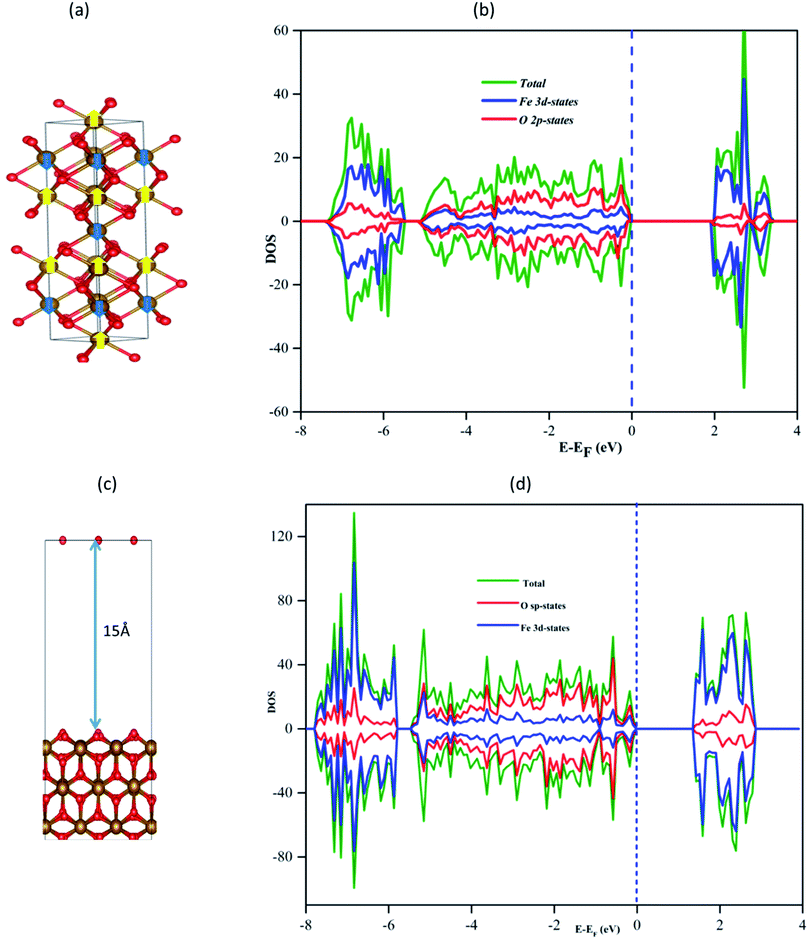
The geometry optimization of α-Fe2O3 was carried out using a Monkhorst–Pack k-points scheme of 5 × 5 × 2 and 2 × 3 × 1 for bulk and surface calculations, respectively. For the final single-point runs for calculating the electronic properties such as DOS, a mesh of 6 × 9 × 1 was used as shown in Fig. 1a. The α-Fe2O3 bulk structure contains iron and oxygen atoms arranged in a triangular hexagonal structure, and the calculated α-Fe2O3 bulk lattice parameters are (a = b = 5.0396 Å and c = 13.7494 Å) in agreement with the experimental lattice parameter values (a = b = 5.036 Å and c = 13.75 Å) and previous theoretical calculations.59 The dopants calculated bulk lattice parameters in their bulk forms are (a = b = c = 2.953 a = b = c = 4.003, a = b = c = 3.689, a = b = c = 4.194, and a = b = c = 4.076 Å) for Fe, Ir, Cu, Co, and Ag, respectively, which is in agreement with the experimental lattice values.60–62 The calculated chemical potential of the dopants is, −2.879, −6.575, −0.862, −2.003, and −1.809 for Fe, Ir, Cu, Co, and Ag, dopants, respectively, as shown in Table 2S.†
The calculated band gap of bulk α-Fe2O3 is 2.065 eV, as shown in Fig. 1b, which is within the experimental values (1.90–2.20 eV)63 and similar to the previous theoretical study of 2.1 eV.64
The adsorption energy (Eads) of the methane on the surface was calculated as
| Eads = ECH4+surface − ECH4 − Esurface |
3. Results and discussion
3.1. Surface modeling
The α-Fe2O3(110) surface was modeled from the optimized bulk, consisting of nine atomic layers in which the bottom three atomic layers and seven atomic layers were fixed during the structural optimization and frequency calculations, respectively. A vacuum space of 15 Å was used in the z-direction to avoid the interactions between the slabs. The α-Fe2O3(110) surface has three types of surface oxygen atoms: two-folded coordinated, three-folded coordinated on the top layer (denoted O2C and O3C, respectively), and four-folded coordinated in the subsurface (denoted as O4C). The corresponding minimum distances of three differently coordinated oxygen atoms with the nearest metal atom are 1.79, 1.92, and 2.12 Å for two-, three- and four-folded coordinated oxygen atoms, respectively. The most stable surface has been chosen based on its surface energy for methane activation, as shown in Table 1S.† The relative stability of α-Fe2O3(110) surface with different single metal dopants was compared by calculating formation energy as:| Eform = EM/Fe2O3 + μFe − EFe2O3 − μM |
3.2. Methane adsorption
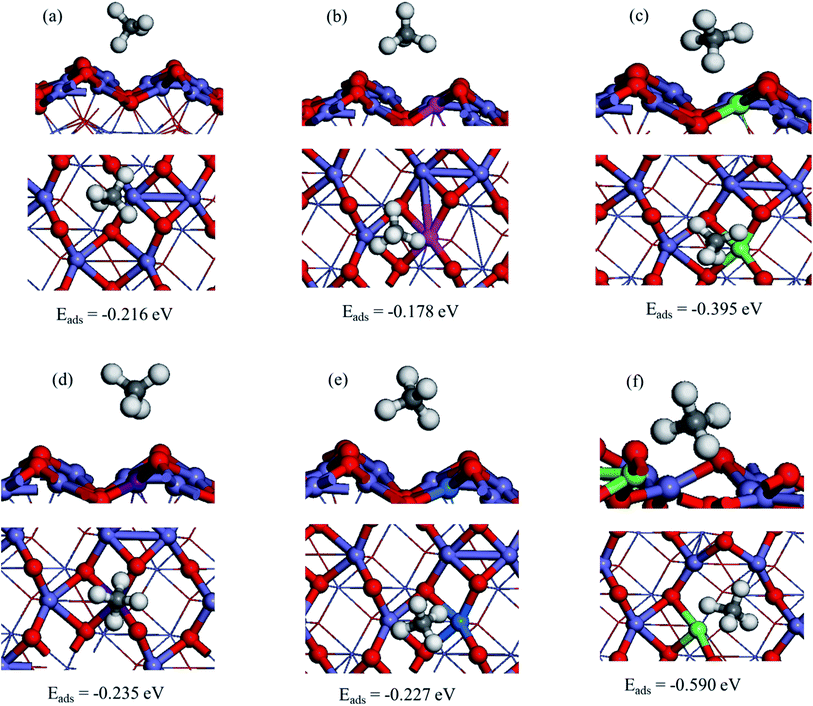
To investigate the methane's most stable adsorption site over the pristine α-Fe2O3(110) surface, we considered Fe top, F–O bridge, O2C top, and O3C top adsorption sites, as shown in Fig. 5S.† Our results indicate that CH4 adsorb preferentially on the Fe top of α-Fe2O3(110) surface with an adsorption energy of −0.211 eV by coordinating one of the C–H bonds toward the surface shown in Fig. 2a. The adsorption is relatively strong compared to those of the α-Fe2O3(0001) surface, on which the adsorption energy is −0.1 eV. The C⋯Fe and CH⋯O distances are 2.719 and 2.480 Å, respectively; one of the C–H bond lengths of CH4 extended to 1.109 Å from 1.097 Å (free molecule) upon the adsorption.66Further, we obtained the most stable adsorption configuration of CH4 on different metal-doped hematite surfaces (M/α-Fe2O3(110)) where (M = Ag, Cu, Ir, or Co). The optimized most stable CH4 adsorption configurations on M/α-Fe2O3(110) surface are shown in Fig. 2, 6S and 7S of ESI† showing the other less stable structures. The calculated adsorption energies, selective bond lengths, and distances of CH4 adsorption on M/α-Fe2O3(110) surfaces (M = Ag, Ir, Co, or Cu) are listed in Table 1. The CH4 on the Ir/α-Fe2O3(110) surface has the largest adsorption energy and most extended C–H bond length compared to the other considered single-metal doped systems and the pristine surface. The C–H bond length is elongated to 1.146 Å from 1.097 Å (free molecule), indicating that the C–H has been significantly activated. Furthermore, the CH⋯O and C⋯Ir distances (2.364 and 1.918 Å, respectively) are much shorter than those single-metal doped systems and the pristine surface due to the more vital interaction between CH4 and Ir/α-Fe2O3(110) surface.
| Surface | Eads | dC–H | dCH⋯O | dC⋯M | Ea | ΔE | Reference |
|---|---|---|---|---|---|---|---|
| Free CH4 molecule | — | 1.097 | — | — | — | — | This study |
| α-Fe2O3(110) | −0.216 | 1.109 | 2.480 | 2.719 | 0.819 | 0.358 | This study |
| Ag/α-Fe2O3(110) | −0.178 | 1.100 | 2.729 | 3.398 | — | — | This study |
| Ir/α-Fe2O3(110) | −0.395 | 1.146 | 2.364 | 1.918 | 0.439 | 0.300 | This study |
| Co/α-Fe2O3(110) | −0.235 | 1.099 | 2.701 | 3.797 | — | — | This study |
| Cu/α-Fe2O3(110) | −0.227 | 1.100 | 3.018 | 3.377 | — | — | This study |
| Ir/α-Fe2O3(110)–OV | −0.590 | 1.182 | 2.805 | 1.794 | 0.585 | −0.590 | This study |
| IrO2(110) | −0.41 | 1.16 | 2.11 | — | 0.300 | −1.090 | 19 |
| Pd/CeO2(111) | −0.19 | — | — | — | 1.140 | — | 35 |
| Pd/Cu(111) | −0.20 | — | — | — | 1.460 | 0.940 | 28 |
| IrO2/TiO2(110) | −0.74 | 1.15 | 2.24 | — | 0.290 | −1.080 | 68 |
Among the considered different single metal-doped α-Fe2O3(110) surfaces, Ir single atom doped α-Fe2O3(110) surface (Ir/α-Fe2O3(110)) has the CH4 adsorption energy of −0.395 eV. As shown in Table 1, M/α-Fe2O3(110) surface (M = Ir) has the best results in C–H bond elongation, interaction, and CH4 adsorption energy. The C–H bond elongation on Ir/α-Fe2O3(110) surface has a similar value to with IrO2(110) surface catalyst, i.e., 1.15 Å. Researchers agreed that IrO2(110) surface catalyst has a remarkable performance for CH4 activation.67,68 Hence Ir/α-Fe2O3(110) surface catalyst has nearly similar activity to the IrO2(110) surface in terms of C–H bond elongation. As a result, this catalyst will be one of the promising and economically feasible catalysts for CH4 activation. Therefore, we selected the Ir/α-Fe2O3(110) surface catalyst for further study.
As the Ir/α-Fe2O3(110) surface exhibits enhanced catalytic activity toward CH4 adsorption among the others, we further considered the presence of single oxygen vacancy on the Ir/α-Fe2O3(110) surface (Ir/α-Fe2O3(110)–OV) and investigated the reactivity towards CH4 activation. The oxygen vacancy formation energy OV was calculated using the following equation:
In the same case, different adsorption sites were considered on the Ir/α-Fe2O3(110)–OV surface, and each selected configuration was optimized to find a stable structure. The calculated adsorption energy for the different adsorption sites and selected geometry parameters are given in Fig. 8S.† As it has seen in Fig. 2f, it is the most stable CH4 adsorption site on the Ir/α-Fe2O3(110)–OV surface with the adsorption energy of −0.590 eV, which is much larger than that of other surfaces considered in this study. In the process of adsorption, the elongation of the activated C–H bond of CH4 on the Ir/α-Fe2O3(110)–OV surface (1.182 Å) was the greatest compared to that on other surfaces. Recent study39 also indicates that oxygen vacancy enhanced the C–H bond activation in doped metal oxides. Ir/α-Fe2O3(110)–OV surface increased the C–H bond length by 0.085 Å compared to the gaseous methane C–H bond length. The CH⋯O and C⋯Ir distances on the Ir/α-Fe2O3(110)–OV surface are 2.805 and 1.794 Å, respectively. Compared to Ir/α-Fe2O3(110) surface, the CH⋯O distance becomes longer, whereas the C⋯Ir distance is shorter, indicating that the agostic interaction increases, whereas the CH⋯O interaction decreases in the case of CH4 adsorption on Ir/α-Fe2O3(110)–OV surface. The methane molecule's C–H bond elongation on the Ir/α-Fe2O3(110) and Ir/α-Fe2O3(110)–OV surfaces was due to the CH⋯O and agostic interactions between C–H of CH4 and surfaces.
3.3. Electronic structure analysis
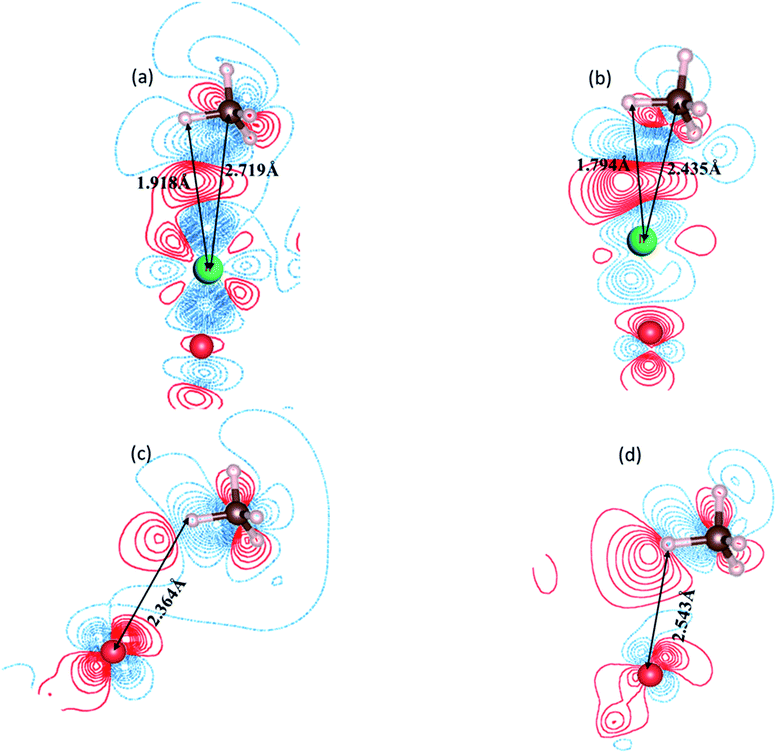
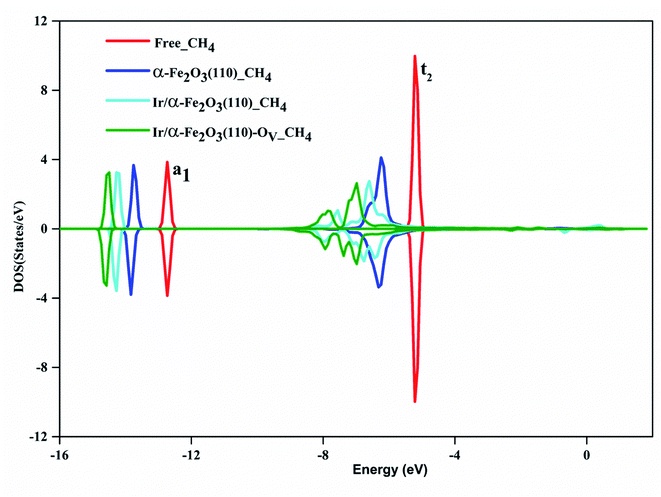
For a detailed comparison of the electronic behavior of Ir/α-Fe2O3(110) and Ir/α-Fe2O3(110)–OV surfaces upon CH4 adsorption; we plotted EDD and the DOS distributions for the most stable adsorption configurations. Fig. 3 shows the EDD contours of CH4 adsorption on Ir/α-Fe2O3(110) and Ir/α-Fe2O3(110)–OV surfaces with two different cutting planes (C–H⋯Ir and C–H⋯Ocus). As shown in Fig. 3a and b, electron accumulation between one C–H bond of methane and Ir atom on Ir/α-Fe2O3(110) and Ir/α-Fe2O3(110)–OV surfaces were observed, which indicates the existence of agostic interaction between methane and surface. Further, as shown in Fig. 3c and d, it could be observed the electron accumulation between one of the H(C) and surface oxygen atoms on both Ir/α-Fe2O3(110) and Ir/α-Fe2O3(110)–OV surfaces, indicating the presence of CH⋯O hydrogen bond between methane and the surface. The agostic interaction will make the electron transfer from methane to the surface, whereas CH⋯O hydrogen bonding causes the electron transfer from the surface to methane. Therefore, these two cooperative interactions between methane and the surface result in great methane adsorption energy on the Ir/α-Fe2O3(110) surface.19,71 The strong interaction between methane and surface results in significant C–H bond elongation, indicating that CH4 has significantly been activated on the Ir/α-Fe2O3(110) surface and Ir/α-Fe2O3(110)–OV surfaces, as illustrated in Fig. 3. To understand the effect of the van der Waals force on methane adsorption, we calculated the methane adsorption energy without considering the van der Waals force correction. As shown in Table 3S,† on the surfaces of α-Fe2O3(110), Ir/α-Fe2O3(110), and Ir/α-Fe2O3(110)–OV, the contribution of van der Waals force to methane adsorption is −0.17, −0.22, −0.32 eV, respectively. It is like the results of the literature.70,71Fig. 4 shows the DOS of the CH4 molecule before and after adsorbed on α-Fe2O3(110), Ir/α-Fe2O3(110), and Ir/α-Fe2O3(110)–OV surfaces. The DOS plot of the free CH4 molecule shows there are two peaks located at around −5.1 and −12.6 eV, which belong to the t2 and a1 states of CH4 σ hybridization states, respectively. After adsorption, both states shift to lower energy regions, and the t2 state becomes much broad. The order of amplitude of shift and broadening is α-Fe2O3(110) > Ir/α-Fe2O3(110) > Ir/α-Fe2O3(110)–OV, related to adsorption energy. The interaction of CH4 with Ir/α-Fe2O3(110)–OV is the strongest, resulting in the most extensive degree of state energy downshift and broadening. The Bader charge calculation found that 0.034, 0.143, and 0.145 net electrons/charges were transferred from the CH4 molecule to α-Fe2O3(110), Ir/α-Fe2O3(110), and Ir/α-Fe2O3(110)–OV surfaces, respectively. The last two have large electrons transfer from methane to the surface, indicating that the agostic interactions are large, which causes the great C–H activation.
3.4. Methane activation
The activation of the first C–H bond is the critical and the rate-limiting step in methane conversion on most catalysts. In this work, we predominantly calculated the first dehydrogenation of CH4 over α-Fe2O3(110), Ir/α-Fe2O3(110), and Ir/α-Fe2O3(110)–OV surfaces. The calculated energy barrier and reaction energy profile for CH4 activation over these three catalysts are illustrated in Fig. 5, and the structure of the initial state transition state (TS), and intermediate state (dis-CH4) are given in Fig. 6. As shown in Fig. 5, the dehydrogenation barrier of the CH4 molecule on the α-Fe2O3(110) surface is the largest with 0.819 eV, and the reaction energy is endothermic by 0.358 eV. The dehydrogenation barrier of the CH4 molecule on the Ir/α-Fe2O3(110) surface is lowest at 0.439 eV, and reaction energy is slightly endothermic at 0.297 eV. However, the adsorption energy is −0.395 eV, smaller than the reaction barrier. Although the C–H activation barrier on Ir/α-Fe2O3(110)–OV surface is 0.585 eV, which is slightly higher than that on Ir/α-Fe2O3(110) surface, it has larger desorption energy making the CH4 activation reaction on the Ir/α-Fe2O3(110)–OV surface can occur through a mediated mechanism and at a lower temperature. In addition, the CH4 reaction on Ir/α-Fe2O3(110)–OV surface is exothermic by 0.585 eV. Though the CH4 adsorption energy and its C–H activation barrier over Ir/α-Fe2O3(110)–OV surface compete with each other, the activation of the adsorbent on the catalyst could be proceeded by adapting the suitable reaction conditions or introducing Lewis–Brønsted acid site pairs in the catalyst.72,73 Lercher et al. recently proposed the Lewis–Brønsted acid mechanism, in which the Lewis–Brønsted acid site pair dehydrogenates alkanes via a bifunctional mechanism that is more active than the isolated Lewis and Brønsted acid sites.73 The first C–H bond activation on Ir/α-Fe2O3(110)–OV surface is higher than pure IrO2(110), and IrO2/TiO2(110) surfaces but much smaller compared to Pd/Cu(111) and Pd/CeO2(111) surfaces, as shown in Table 1. After activation, the C–H bond length of the Ir/α-Fe2O3(110)–OV surface is the longest, but the activation energy is higher than that of the pristine IrO2(110) and IrO2/TiO2(110) surfaces. It may be due to the weaker CH⋯O hydrogen bonding since the CH⋯O distance on the Ir/α-Fe2O3(110)–OV surface is longer than on the other surfaces. Likewise, the reaction energy for CH4 activation on Ir/α-Fe2O3(110)–OV surface is slightly less exothermic compared on IrO2(110) and IrO2/TiO2(110) surfaces but much exothermic than on Pd/Cu(111) surface. Although compared with IrO2(110) and IrO2/TiO2(110) surfaces, Ir/α-Fe2O3(110)–OV surface is slightly less favorable thermodynamically and kinetically for CH4 activation. However, this catalyst uses a relatively small amount of expensive Ir, and the activation energy is still quite low, making it a viable candidate for CH4 activation both thermodynamically and kinetically.
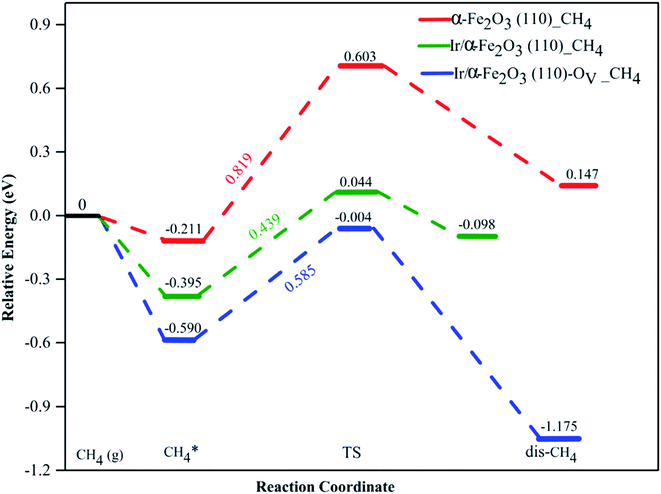 | ||
| Fig. 5 Potential energy profile of CH4 activation on α-Fe2O3(110) (red dash line), Ir/α-Fe2O3(110) (green dash line), and Ir/α-Fe2O3(110)–OV surfaces (blue dash line). | ||
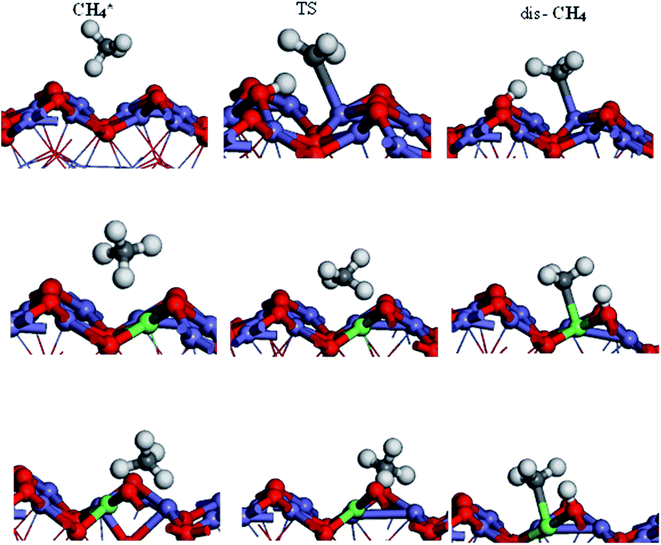 | ||
| Fig. 6 Side view of initial, transition, and intermediate states of CH4 oxidation on α-Fe2O3(110), Ir/α-Fe2O3(110), and Ir/α-Fe2O3(110)–OV surfaces. | ||
To examine the relationship between activation barriers (Ea) and adsorption energies (Eads) for C–H dissociation of methane on α-Fe2O3(110), Ir/α-Fe2O3(110), and Ir/α-Fe2O3(110)–OV surfaces, we found that they have no linear relationship, as shown in Fig. 3S.† The bond lengths for C–H activation on α-Fe2O3(110), Ir/α-Fe2O3(110), and Ir/α-Fe2O3(110)–OV surfaces are 1.408, 1.312, and 1.147 Å, respectively. It indicates that the C–H activation exists in late transition on the α-Fe2O3(110) surface, and early transition state on Ir/α-Fe2O3(110)–OV surface, resulting in no linear relationship between adsorption energy and activation barrier.
Previous studies have shown that IrO2 has excellent catalytic activity for methane dehydrogenation.74,75 But methane is completely oxidized to CO2 and H2O.76,77 In this study, we only considered a single metal doping and a single oxygen vacancy which is very active for methane adsorption. Cheng et al. studied the adsorption and dissociation of methane on ferric oxide oxygen carriers and they found that the activation barrier of C–H decreased when the surface oxygen vacancy concentration was increased from 0%–2.67%.78 In the future, we will further investigate whether increasing the concentration of dopants and oxygen vacancies can further improve catalytic activity.
4. Conclusions
In this study, the DFT + U method calculations were performed to study the C–H bond activation of CH4 molecules on the surfaces of pristine α-Fe2O3(110) and doped α-Fe2O3(110) with single-atom (Ag, Ir, Co, or Cu). From calculation results, we found that the Ir/α-Fe2O3(110) surface has considerable interaction with CH4 molecules compared to other considered single-atom doped surfaces. Furthermore, we investigated the activation of CH4 on the Ir/α-Fe2O3(110) surface with oxygen vacancy. EDD, DOS, and Bader charge analyses show that the co-existence of CH⋯O hydrogen bonding and agostic interactions between methane and surfaces results in large adsorption energies of −0.395 and −0.590 eV on Ir/α-Fe2O3(110) and Ir/α-Fe2O3(110)–OV surfaces, respectively, and significantly elongated the length of one C–H bond on methane. Although the C–H activation barrier on Ir/α-Fe2O3(110)–OV surface is slightly higher than that on Ir/α-Fe2O3(110) surface, it has larger desorption energy making the CH4 activation reaction on the Ir/α-Fe2O3(110)–OV surface can occur through a mediated mechanism and at a lower temperature. The calculation indicates that the first dehydrogenation of the CH4 molecule on the Ir/α-Fe2O3(110)–OV surface is thermodynamically and kinetically favorable.Conflicts of interest
The authors declare that there is no conflict of interest.Acknowledgements
The authors gratefully acknowledge the financial support for this work from the Ministry of Science and Technology, Taiwan (MOST 110-2113-M-011-002-MY3). The authors are also grateful to the National Center for High-Performance Computing, Taiwan, for donating computer time and facilities.References
- P. Tang, Q. J. Zhu, Z. X. Wu and D. Ma, Energy Environ. Sci., 2014, 7, 2580–2591 RSC.
- P. Schwach, X. L. Pan and X. H. Bao, Chem. Rev., 2017, 117, 8497–8520 CrossRef CAS PubMed.
- E. McFarland, Science, 2012, 338, 340–342 CrossRef CAS PubMed.
- R. A. Kerr, Science, 2010, 328, 1624–1626 CrossRef CAS PubMed.
- E. D. Sloan, Nature, 2003, 426, 353–359 CrossRef CAS PubMed.
- N. N. Xu, C. A. Coco, Y. D. Wang, T. S. Su, Y. Wang, L. W. Peng, Y. X. Zhang, Y. Y. Liu, J. L. Qiao and X. D. Zhou, Appl. Catal., B, 2021, 282, 119572 CrossRef CAS.
- J. H. Lunsford, Catal. Today, 2000, 63, 165–174 CrossRef CAS.
- W. Nabgan, T. A. T. Abdullah, R. Mat, B. Nabgan, Y. Gambo, M. Ibrahim, A. Ahmad, A. A. Jalil, S. Triwahyono and I. Saeh, Renewable Sustainable Energy Rev., 2017, 79, 347–357 CrossRef CAS.
- T. T. R. Karl and K. E. Trenberth, Science, 2003, 302, 1719–1723 CrossRef CAS PubMed.
- D. Hu, V. V. Ordomsky and A. Y. Khodakov, Appl. Catal., B, 2021, 286, 119913 CrossRef CAS.
- X. G. Guo, G. Z. Fang, G. Li, H. Ma, H. J. Fan, L. Yu, C. Ma, X. Wu, D. H. Deng, M. M. Wei, D. L. Tan, R. Si, S. Zhang, J. Q. Li, L. T. Sun, Z. C. Tang, X. L. Pan and X. H. Bao, Science, 2014, 344, 616–619 CrossRef CAS PubMed.
- Y. L. Wang, P. Hu, J. Yang, Y. A. Zhu and C. Chen, Chem. Soc. Rev., 2021, 50, 4299–4358 RSC.
- S. Q. Wu, L. Z. Wang and J. L. Zhang, J. Photochem. Photobiol., C, 2021, 46, 100400 CrossRef CAS.
- X. Meng, X. Cui, N. P. Rajan, L. Yu, D. Deng and X. Bao, Chem, 2019, 5, 2296–2325 CAS.
- P. Tomkins, M. Ranocchiari and J. A. van Bokhoven, Acc. Chem. Res., 2017, 50, 418–425 CrossRef CAS PubMed.
- S. K. Li, R. Ahmed, Y. H. Yi and A. Bogaerts, Catalysts, 2021, 11, 590 CrossRef CAS.
- T. L. M. Pham, E. G. Leggesse and J. C. Jiang, Catal. Sci. Technol., 2015, 5, 4064–4071 RSC.
- T. L. M. Pham, S. Nachimuthu, J. L. Kuo and J. C. Jiang, Appl. Catal., A, 2017, 541, 8–14 CrossRef CAS.
- C.-C. Wang, S. S. Siao and J.-C. Jiang, J. Phys. Chem. C, 2012, 116, 6367–6370 CrossRef CAS.
- Z. Liang, T. Li, M. Kim, A. Asthagiri and J. F. Weaver, Science, 2017, 356, 298–301 CrossRef PubMed.
- R. Martin, M. Kim, A. Franklin, Y. X. Bian, A. Asthagiri and J. F. Weaver, Phys. Chem. Chem. Phys., 2018, 20, 29264–29273 RSC.
- Y. X. Bian, M. Kim, T. Li, A. Asthagiri and J. F. Weaver, J. Am. Chem. Soc., 2018, 140, 2665–2672 CrossRef CAS PubMed.
- C. H. Yeh, T. M. L. Pham, S. Nachimuthu and J. C. Jiang, ACS Catal., 2019, 9, 8230–8242 CrossRef CAS.
- O. Ola and M. M. Maroto-Valer, Appl. Catal., A, 2015, 502, 114–121 CrossRef CAS.
- P. D. Murzin, A. A. Murashkina, A. V. Emeline and D. W. Bahnemann, Top. Catal., 2020, 64, 817–823 CrossRef.
- B. Rusinque, S. Escobedo and H. de Lasa, Catalysts, 2020, 10, 74 CrossRef CAS.
- H. R. Eisenberg and R. Baer, J. Phys. Chem. C, 2015, 119, 196–215 CrossRef CAS.
- Y. Meng, C. Ding, X. Gao, K. Zhang, J. Wang and Z. Li, Appl. Surf. Sci., 2020, 513, 145724 CrossRef CAS.
- F. Guo, J. Y. Ran, J. T. Niu, H. Y. Qiu and Z. L. Ou, Int. J. Energy Res., 2021, 45, 10100–10111 CrossRef CAS.
- Z. Feng, X. Liu, Y. Wang and C. Meng, Molecules, 2021, 26, 2234 CrossRef CAS PubMed.
- Z. Xu, Y. Yue, X. Bao, Z. Xie and H. Zhu, ACS Catal., 2019, 10, 818–828 CrossRef.
- L. Xie, R. Wang, Y. Chai, X. Weng, N. Guan and L. Li, J. Energy Chem., 2021, 63, 262–269 CrossRef.
- B. Li and H. Metiu, J. Phys. Chem. C, 2011, 115, 18239–18246 CrossRef CAS.
- A. D. Mayernick and M. J. Janik, J. Phys. Chem. C, 2008, 112, 14955–14964 CrossRef CAS.
- Y.-Q. Su, I. A. Filot, J.-X. Liu and E. J. Hensen, ACS Catal., 2018, 8, 75–80 CrossRef CAS PubMed.
- O. Akhavan, Appl. Surf. Sci., 2010, 257, 1724–1728 CrossRef CAS.
- F. Shi, M. K. Tse, M.-M. Pohl, A. Brückner, S. Zhang and M. Beller, Angew. Chem., Int. Ed., 2007, 119, 9022–9024 CrossRef.
- J. Liang, Q. H. Zhang, H. L. Wu, G. Y. Meng, Q. H. Tang and Y. Wang, Catal. Commun., 2004, 5, 665–669 CrossRef CAS.
- N. J. O'Connor, A. Jonayat, M. J. Janik and T. P. Senftle, Nat. Catal., 2018, 1, 531–539 CrossRef.
- G. Kresse and J. Hafner, Phys. Rev. B: Condens. Matter Mater. Phys., 1993, 47, 558 CrossRef CAS PubMed.
- G. Kresse and J. Furthmuller, Comput. Mater. Sci., 1996, 6, 15–50 CrossRef CAS.
- J. Klimeš, D. R. Bowler and A. Michaelides, Phys. Rev. B: Condens. Matter Mater. Phys., 2011, 83, 195131 CrossRef.
- J. Klimeš, D. R. Bowler and A. Michaelides, J. Phys.: Condens. Matter, 2009, 22, 022201 CrossRef PubMed.
- J. Klimeš and A. Michaelides, J. Chem. Phys., 2012, 137, 120901 CrossRef PubMed.
- G. Kresse and D. Joubert, Phys. Rev. B: Condens. Matter Mater. Phys., 1999, 59, 1758–1775 CrossRef CAS.
- M. Arroyo-de Dompablo, A. Morales-García and M. Taravillo, J. Chem. Phys., 2011, 135, 054503 CrossRef CAS PubMed.
- C. W. Castleton, A. Lee and J. Kullgren, J. Phys. Chem. C, 2019, 123, 5164–5175 CrossRef CAS.
- Y. Ping, G. Galli and W. A. Goddard III, J. Phys. Chem. C, 2015, 119, 11570–11577 CrossRef CAS.
- C. Zhao, B. Li, X. Zhou, J. Chen and H. Tang, Metals, 2021, 11, 424 CrossRef CAS.
- S. Sagadevan, K. Pal and Z. Z. Chowdhury, J. Mater. Sci.: Mater. Electron., 2017, 28, 12591–12597 CrossRef CAS.
- Y. Wang, H. Ge, Y. Chen, X. Meng, J. Ghanbaja, D. Horwat and J. Pierson, Chem. Commun., 2018, 54, 13949–13952 RSC.
- L.-H. Tjeng, M. B. Meinders, J. van Elp, J. Ghijsen, G. A. Sawatzky and R. L. Johnson, Phys. Rev. B: Condens. Matter Mater. Phys., 1990, 41, 3190 CrossRef CAS PubMed.
- V. Tripkovic, H. A. Hansen and T. Vegge, ACS Catal., 2017, 7, 8558–8571 CrossRef CAS.
- Y. Tang, S. Zhao, B. Long, J.-C. Liu and J. Li, J. Phys. Chem. C, 2016, 120, 17514–17526 CrossRef CAS.
- W. Li, S. G. Srinivasan, D. Salahub and T. Heine, Phys. Chem. Chem. Phys., 2016, 18, 11139–11149 RSC.
- M. Jamal, S. S. Nishat and A. Sharif, Chem. Phys., 2021, 545, 111160 CrossRef CAS.
- M. Méndez-Galván, C. A. Celaya, O. A. Jaramillo-Quintero, J. Muniz, G. Díaz and H. A. Lara-García, Nanoscale Adv., 2021, 3, 1382–1391 RSC.
- M. Khalil, J. J. Yu, N. Liu and R. L. Lee, J. Nanopart. Res., 2014, 16, 183–187 CrossRef.
- L. Qin, Z. Cheng, M. Q. Guo, M. Y. Xu, J. A. Fan and L. S. Fan, ACS Energy Lett., 2017, 2, 70–74 CrossRef CAS.
- P. Haas, F. Tran and P. Blaha, Phys. Rev. B: Condens. Matter Mater. Phys., 2009, 79, 085104 CrossRef.
- H. Eguchi, K. Tsumuraya, T. Nagano and S. Kihara, Mater. Trans., JIM, 1999, 40, 1198–1204 CrossRef CAS.
- A. I. o. Physics, and D. E. Gray, American Institute of Physics Handbook, McGraw-Hill, 3rd edn, 1972 Search PubMed.
- F. Kraushofer, Z. Jakub, M. Bichler, J. Hulva, P. Drmota, M. Weinold, M. Schmid, M. Setvin, U. Diebold and P. Blaha, J. Phys. Chem. C, 2018, 122, 1657–1669 CrossRef CAS PubMed.
- N. Y. Dzade, A. Roldan and N. H. de Leeuw, Minerals, 2014, 4, 89–115 CrossRef.
- G. Henkelman, B. P. Uberuaga and H. Jonsson, J. Chem. Phys., 2000, 113, 9901–9904 CrossRef CAS.
- J.-J. Tang and B. Liu, J. Phys. Chem. C, 2016, 120, 6642–6650 CrossRef CAS.
- Y. Tsuji and K. Yoshizawa, J. Phys. Chem. C, 2018, 122, 15359–15381 CrossRef CAS.
- S. Nachimuthu, H.-J. Lai, Y.-C. Chen and J.-C. Jiang, Appl. Surf. Sci., 2022, 577, 151938 CrossRef CAS.
- Y. Zhao, K. R. Yang, Z. Wang, X. Yan, S. Cao, Y. Ye, Q. Dong, X. Zhang, J. E. Thorne and L. Jin, Proc. Natl. Acad. Sci. U. S. A., 2018, 115, 2902–2907 CrossRef CAS PubMed.
- S. González, F. Viñes, J. F. García, Y. Erazo and F. Illas, Surf. Sci., 2014, 625, 64–68 CrossRef.
- M. J. Tillotson, P. M. Brett, R. A. Bennett and R. Grau-Crespo, Surf. Sci., 2015, 632, 142–153 CrossRef CAS.
- X. Liu, M. Xu, L. Wan, H. Zhu, K. Yao, R. Linguerri, G. Chambaud, Y. Han and C. Meng, ACS Catal., 2020, 10, 3084–3093 CrossRef CAS.
- M. W. Schreiber, C. P. Plaisance, M. Baumgärtl, K. Reuter, A. Jentys, R. Bermejo-Deval and J. A. Lercher, J. Am. Chem. Soc., 2018, 140, 4849–4859 CrossRef CAS PubMed.
- Y. Tsuji and K. Yoshizawa, J. Phys. Chem. C, 2020, 124, 17058–17072 CrossRef CAS.
- J. Xu, X.-M. Cao and P. Hu, J. Phys. Chem. C, 2019, 123, 28802–28810 CrossRef.
- M. Kim, A. Franklin, R. Martin, F. Feng, T. Li, Z. Liang, A. Asthagiri and J. Weaver, J. Phys. Chem. C, 2019, 123, 27603–27614 CrossRef CAS.
- R. Martin, C. J. Lee, V. Mehar, M. Kim, A. Asthagiri and J. F. Weaver, ACS Catal., 2022, 12, 2840–2853 CrossRef CAS.
- Z. Cheng, L. Qin, M. Guo, J. A. Fan, D. Xu and L.-S. Fan, Phys. Chem. Chem. Phys., 2016, 18, 16423–16435 RSC.
Footnote |
| † Electronic supplementary information (ESI) available: Tables 1S–3S, Fig. 1S–8S, and POSCAR files of the initial, intermediate, and final products. See https://doi.org/10.1039/d2ra03585e |
| This journal is © The Royal Society of Chemistry 2022 |

