 Open Access Article
Experimental and theoretical insights into copper corrosion inhibition by protonated amino-acids
Amel Sedik*ab,
Samah Athmania,
Adel Saoudiad,
Hana Ferkous c,
Nazih Ribouhb,
Djahida Leraria,
Khaldoun Bacharia,
Souad Djellalie,
Malika Berredjem
 f,
Ramazan Solmazg,
Manawwer Alamh,
Byong-Hun Jeon
 *i and
Yacine Benguerba
 *j
*j
aScientific and Technical Research Center in Physico-chemical Analysis, BP 384, Bou-Ismail Industrial Zone, RP 42004, Tipaza, Algeria. E-mail: Amelsedik2015@gmail.com
bNanomaterials, Corrosion and Surface Treatment Laboratory (LNMCT), Badji Mokhtar University, BP 12, 23000 Annaba, Algeria
cLaboratoire de Génie Mécanique et Matériaux, Faculté de Technologie, Université de Skikda, 21000, Skikda, Algeria
dMetallurgy and Materials Engineering Laboratory (LMGM), BADJI Mokhtar – Annaba University, PO 12, CP 23000, Algeria
eLaboratoire de Physico-Chimie des Hauts Polymères (LPCHP), Faculty of Technology, University Ferhat Abbas Setif 1, 19000, Setif, Algeria
fLaboratory of Applied Organic Chemistry LCOA, Synthesis of Biomolecules and Molecular Modelling Group, Badji-Mokhtar – Annaba University, Box 12, 23000 Annaba, Algeria
gBingöl University, Health Sciences Faculty, Occupational Health and Safety Department, 12000, Bingöl, Türkiye
hDepartment of Chemistry, College of Science, King Saud University, PO Box 2455, Riyadh, 11451, Saudi Arabia
iDepartment of Earth Resources and Environmental Engineering, Hanyang University, Seoul 04763, Republic of Korea. E-mail: bhjeon@hanyang.ac.kr
jLaboratoire de Biopharmacie Et Pharmacotechnie (LPBT), Ferhat Abbas Setif 1 University, Setif, Algeria. E-mail: yacinebenguerba@univ-setif.dz
First published on 23rd August 2022
Abstract
The effects of cysteine (Cys) and L-methionine (L-Met) on copper corrosion inhibition were examined in 1 M HNO3 solution for short and long exposure times. Potentiodynamic polarization (PDP) and electrochemical impedance spectroscopy (EIS) were used. The EIS determined the potential for zero charges of copper (PZC) in the inhibitor solution. SEM and AFM have been used to study material surfaces. Energy-dispersive X-ray spectroscopy (EDS) was used to identify surface elemental composition. DFT and molecular dynamics simulations explored the interaction between protonated amino acids and aggressive media anions on a copper (111) surface.
1. Introduction
Copper, with a reddish-orange color, is the fifth most common metal in the earth's crust which allows it to be used in a wide variety of industrial applications and also in everyday life, such as industrial equipment, marine industries, power station, coinages, electricity, desalination plants, fabrication of heat exchangers, tubes, cooling towers, water treatment, and electronics and many more.1–9 This metal is preferred in all these applications because of favorable properties like high electrical and thermal conductivity,10 mechanical workability, malleability, and resistance to atmospheric and chemical agents. In addition to all these properties, copper has antimicrobial activity. Copper is a relatively noble metal. Copper dissolves in severe environments regardless of the application location. Although passive protective oxide film formation provides the appearance that copper is resistant to corrosion under some circumstances or in the atmosphere,11 copper oxidizes rapidly in certain situations and generates a layer of copper oxides and/or hydroxides on its surface. The nature of this film depends on the medium's composition. Despite this self-protective film, this metal may undergo corrosion in acid medium or industrial environments containing chloride, sulfate, or nitrate ions. Nitric acid is an oxidizing acid whose oxidizing capacity depends on its concentration. Oxygen in nitric acid adds to the acceleration of copper surface corrosion.12 The nitric acid reaction of copper gives hydrogen used to reduce nitric acid to different products.13–16 Most metals are known to react with nitric acid and form compounds rich in hydrogen (NH3 or NH2OH). Likewise, noble metals like silver and copper generate oxygen-rich molecules (NO2, NO, or HNO2).1,17–20Understanding the corrosion process aims to discover techniques for limiting or preventing the metal's reactivity to its surroundings. Organic inhibitor chemicals have recently been shown to be the most efficient and feasible strategy for achieving this objective. Organic inhibitors,21,22 comprising nitrogen, oxygen, and/or sulfur atoms and aromatic rings, are potent and commonly employed to preserve copper and its alloys.23–28 Due to their toxicity, however, the use of some inhibitors has been banned in many nations and regions. In this context, some of our research examines the applicability of non-toxic, inexpensive, healthy, ecologically friendly, and efficient corrosion inhibitors. Amino acids are non-toxic, biodegradable, and environmentally benign molecules, relatively inexpensive, and simple to make in high purity. They are involved in many pharmacological and biological activities.26,29,30 Such characteristics would encourage their usage as corrosion inhibitors.
Twenty amino acids include at least one carboxyl (–COOH) and one amino (–NH2) group, while the other group of a-carbon ligands consists of –H and R of various lengths, shapes, and chemical (side chain) characteristics. They may be categorized based on (i) lateral chain structure (aliphatic, cyclic); and (ii) the polarity of the side chain (polar, non-polar). It is important to note that amino acids are widely used in a variety of fields; these molecules are the basis of all vital processes because they are essential to the integrity of metabolic processes, and they are used in pharmaceutical and cosmetic applications (intermediates for the chemical industry), as well as in animal feed and food.31,32 Since amino acids are the fundamental components of proteins and the source of many other compounds required by the body's organs, their presence is of utmost significance and value. Because of this, there is a rising need for amino acids.33–35
Some studies on corrosion involving amino acids have been published. Xu et al.36 studied the anticorrosion performance of three derivatives of pyrazolo-pyrimidine (APP), 4-hydroxy pyrazolo-pyrimidine (HPP), and 4-mercapto pyrazolo-pyrimidine (MPP). Electrochemical, surface analysis, and theoretical techniques examined copper in a 0.5 M H2SO4 solution. The results indicated that these inhibitors sufficiently inhibit copper corrosion, and the inhibition efficiency increases with concentration. The sequence of the inhibition efficiencies follows MPP > HPP > APP. Zhang et al.,37 tested 5-(4-methoxyphenyl)-3h-1,2-dithiole-3-thione (ATT) for copper protection against corrosion in 0.5 M H2SO4 solution. The authors reported that ATT shows excellent performance for copper protection. The inhibition efficiency of ATT increases with the increasing temperature of the solution. The adsorption of ATT molecules on the copper surface is compatible with the Langmuir adsorption process. Lastly, theoretical calculations show that the ATT molecule has small energy gaps, greater dipole moment values, and binding energy. SEM and AFM were also reported to be highly consistent with surface morphology analyses and electrochemical test results. In addition to these studies, various amino acids have been reported for the protection of different metals against corrosion in acidic media, such as mild steel,9,33,38–43 copper,44–52 or aluminum.53–57
Compared to previous work,58,59 the experimental and theoretical research we conducted for this study is more in-depth. The processes behind the adsorption and inhibition of the chemicals have been explored in great detail. Many electrochemical tests, in addition to surface characterizations, have been conducted. After the copper surface had been subjected to the aggressive solution, SEM and AFM techniques were used to investigate the surface structure. It was discovered that EDX might be used to ascertain the typical chemical composition and the dispersion of an inhibitor layer that had developed on a metal surface. A comprehensive theoretical and computational investigation was carried out to understand better how Cu interacts with inhibitors.60
2. Experimental
2.1. Preparation of electrodes
The working electrode was cut from a cylindrical copper rod (98.9%) and covered with epoxy resin (excluding the bottom exposed surface area of 0.35 cm2). The electrode's surface was shortened using several grades of emery paper (evolution ranging from 600, 800, 1000, 1200, 2400) and polished with 3 μm diamond paste. After degreasing them with acetone, rinsing them with distilled water, and drying them with filter paper, they were used in the tests.2.2. Test solution
In order to make an HNO3 solution, a 65 percent analytical grade HNO3 solution was first diluted with distilled water. The supply of amino acids came from Sigma-Aldrich. Fig. 1 illustrates the atomic and molecular structures of these compounds. These compounds include nitrogen, oxygen, and sulfur atoms, which act as adsorption centers. In a solution of 1 M HNO3, the concentration of Cys and L-Met was 1 mM. A thermostat was used to maintain the temperature of the solution at 298 K throughout the experiment.2.3. Electrochemical measurements
Electrochemical analysis was performed utilizing a computer-controlled CHI 660D AC electrochemical analyzer. The experiments were conducted using a three-electrode electrochemical cell. A platinum sheet with a 1 × 1 cm2 surface area was used as a counter electrode, and the reference electrode was a commercially purchased Ag/AgCl (3.0 M KCl). A scan rate of 1 mV s−1 was used to produce potentiodynamic polarization curves throughout the potential range of −8 to +0.6 V. At an open circuit potential, EIS tests were performed at frequencies ranging from 100 kHz to 10 mHz. It had a 5 mV amplitude. Additionally, EIS experiments were performed at various anodic and cathodic overpotentials in 1 M HNO3 with 1 mM L-Met or 1 mM Cys. The copper's excess surface charge was measured to further investigate the inhibitors' adsorption mechanism.2.4. Characterization of a metal surface by SEM, EDX, AFM
A variety of surface characterization methods were used to analyze the metal surface. The electrodes were submerged in 1 M HNO3 solutions containing 1 mM inhibitors for 2 hours throughout these experiments. After removing them from the cell, they were cleaned with distilled water and dried. SEM (JEOL6510) in conjunction with an EDX (model 550) and AFM were used to analyze the surface of copper (model Park SYSTEMS SPM controller).2.5. Molecular simulation and chemical calculations
The Mulliken atomic charges of L-Met and Cys molecules were determined to provide further information on the location of the active adsorption sites.
3. Results and discussion
3.1. Potentiodynamic polarization studies
According to the following processes, HNO3 is a powerful copper oxidant capable of quickly oxidizing copper. The dissolution of copper in nitric acid is known to proceed in two stages (reaction 1 and 2). During the dissolution of copper, forming Cu+ ion species is a fast step that doesn't diffuse into the bulk solution. The diffusion of soluble Cu2+ species controls the dissolution of copper from the outer Helmholtz plane to the bulk solution.1,63Anodic reaction
| Cu → Cuads+ + e− | (1) |
| Cuads+ → Cuads2+ + e− | (2) |
In all tests, the corrosion potential is much greater than the redox potential of hydrogen evolution in this medium, proving that the cathodic reaction is not an evolution of hydrogen reaction. The cathodic reaction's primary mechanism has been identified. It is feasible to examine the oxygen reduction in an acidic medium; however, NO3− ions at cathodic sites dominate the process.64
Cathodic reactions
| NO3− + 3H+ + 2e− → HNO2 + H2O | (3) |
| NO3− + 4H+ + 3e− → NO + 2H2O | (4) |
| O2 + 4H+ + 4e− → 2H2O | (5) |
According to the literature,65–67 electrochemical methods are frequently used to assess different alloys' corrosion rate and corrosion resistance directly. One of the key techniques for calculating the corrosion current density involves the analysis of polarization curves, specifically the extrapolation of the linear section of the polarization curve on the semilogarithmic coordinates to the corrosion potential Ecorr. The method of Tafel extrapolation can be used only in the presence of a well-pronounced Tafel region in even one (cathodic or anodic) branch of the polarization curve.
The corrosion current density icorr is frequently calculated by using an equation, which is based on the Butler–Volmer equation of electrochemical kinetics:
 | (6) |
 , and
, and  ; n, n′: number of electrons involved in the reactions, respectively anodic and cathodic; α: electronic transfer coefficient (0< α < 1); η: overvoltage applied to the electrode η = E − Ecorr (V); R: perfect gas constant (J mol−1 K−1); T: temperature (K); F: Faraday number (96
![[thin space (1/6-em)]](https://www.rsc.org/images/entities/char_2009.gif) 500 C mol−1).
500 C mol−1).
Here, ba and bc are the coefficients that characterize the corrosion process's anodic and cathodic components. This equation may be used provided that the charge transfer limits the rates of both cathodic and anodic reactions. The concentrations of reactive substances near the electrodes and in the bulk solution are equal.
The Butler–Volmer equation may analyze both pre-Tafel and Tafel sections of polarization curves. To minimize a significant change in the surface conditions of the test sample during polarization, measuring the polarization curves within a small range next to the corrosion potential (Ecorr ± 10 mV) was recommended.
To achieve this objective, a polarization resistance approach66 was devised. By extending the exponents in eqn (6) into series limited to the first terms, we can get a simple equation for computing the corrosion current in the region of the corrosion potential.
To estimate the polarization resistance and the Tafel coefficients in the same tests, it was advised to use polarization curves having both linear and relatively modest nonlinear sections. This may be achieved using computer programs and the fitting technique.
 | (7) |
The polarization resistance (Rp), can be easily determined by a slope of the polarization curve in the linear range near the corrosion potential.
In this study, the potentiodynamic polarization curves in Fig. 2 exhibit no steep slope in the anodic range, meaning that no passive films are formed on the copper surface. Consequently, copper may directly dissolve in 1.0 M HNO3 solutions. It was evident that the presence of amino acids in the electrolyte (Fig. 2) causes the Cu electrode's open circuit potential (Eocp) to move to more negative values, which may be ascribed to the dominance of the cathodic reaction inhibition. L-Met and Cys additions to corrosive media alter the appearance of the anodic and cathodic branches of the curves, indicating their effect on both anodic and cathodic processes. The cathodic reaction is more inhibited than the anodic reaction; the amino acid-adsorbed layers serve as a cathodic barrier, inhibiting the transport of O2 or NO3− to the metal's cathodic sites. In addition, this barrier layer delays the metal's decomposition. Therefore, corrosion rates decrease proportionately with the number of adsorbed inhibitor molecules that obstruct the electrochemically active sites.
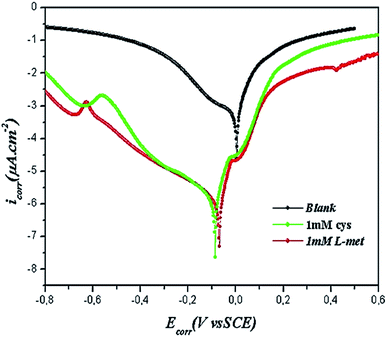 | ||
| Fig. 2 Potentiodynamic polarization curves of Cu after 2 h immersion in 1 M HNO3 solution in the absence and presence of 1 mM Cys and 1 mM L-Met. | ||
L-Met is more protective than Cys as a corrosion inhibitor for a short duration of exposure. Multiple functional groups have often resulted in variations in the electron density of a molecule, which may alter its adsorption behavior.63 These compounds most likely adsorption through C![[double bond, length as m-dash]](https://www.rsc.org/images/entities/char_e001.gif) O, –OH, –NH2, or –S– groups, regarded as active adsorption centers. The longer alkyl chain and more significant mass of L-Met provide a modest advantage on its inhibitory efficacy. This hypothesis will be confirmed in the following sections.
O, –OH, –NH2, or –S– groups, regarded as active adsorption centers. The longer alkyl chain and more significant mass of L-Met provide a modest advantage on its inhibitory efficacy. This hypothesis will be confirmed in the following sections.
The corrosion potential (Ecorr), corrosion current density (icorr), and inhibition efficiency (IE%) values associated with these curves were computed and are presented in Table 1. The inhibition effectiveness IE% was determined using the following equation:
 | (8) |
| Cinb | Ecorr (mV) | icorr (μA cm−2) | IE (%) |
|---|---|---|---|
| Blank | −11.31 | 710.1 | — |
| 1 mM Cys | −86.97 | 90.45 | 87.3 |
| 1 mM L-Met | −69.24 | 50.25 | 92.3 |
As shown in Fig. 2 and Table 1:
(I) The Ecorr was slightly shifted to greater cathodic potentials, and when the inhibitors were applied, both the anodic and cathodic current densities were decreased. Consequently, the inhibitors are classified as mixed-type corrosion inhibitors with a mostly cathodic component.68,69
(II) The lack of Tafel regions prevented the determination of the anodic and cathodic Tafel slopes from the obtained curves. In contrast, the lines corresponding to these regions were almost parallel, demonstrating that the inhibitors prevent corrosion without interfering with the processes.
(III) The corrosion current density reduced from 710.1 to 50.25 and 90.45 μA cm−2, respectively, with the addition of 1 mM Cys or 1 mM L-Met. Thus, amino acid adsorption inhibits anodic and cathodic processes by inhibiting active sites.
(IV) The highest IE values for Cys and L-Met were 87.3% and 92.3%, respectively, demonstrating the protective role of the two amino acids against Cu corrosion in 1 M HNO3.
3.2. Electrochemical impedance spectroscopy measurements
To investigate the processes that occur at the copper/solution interface, the production of films, and their protective efficacy, electrochemical impedance spectroscopy (EIS) was used in 1 M HNO3 solution without and with the addition of Cys and L-Met at a concentration of 1 mM. Fig. 3 depicts the electrode's Nyquist graphs in the absence and presence of inhibitors.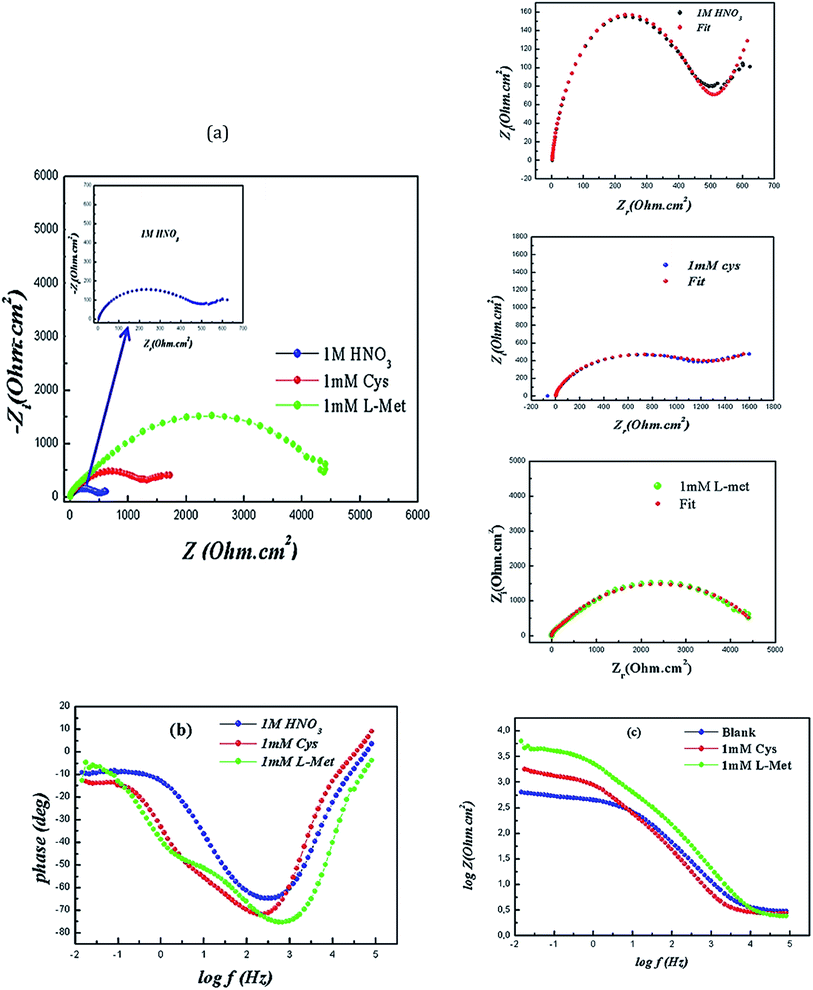 | ||
| Fig. 3 Nyquist plots (a) with fitting and Bode (b and c) of Cu after 2 h immersion in 1 M HNO3 solution in the absence and presence of 1 mM Cys and 1 mM L-Met. | ||
Cu's Nyquist plot in the absence of inhibitors (Fig. 3) exhibits a capacitive loop at high frequencies, followed by a second one at low frequencies that appears as a straight line and is usually characterized as Warburg impedance. The initial capacitive study at high frequencies is linked to charge transfer resistance (Rct) and double-layer capacitance (Cdl).63 The second may be ascribed to the diffusion process at the surface (i.e., dissolved oxygen).70 Cys induced the appearance of comparable Nyquist and Bode graphs. The charge transfer and diffusion resistances rise when this inhibitor is added to the corrosive solution, indicating that copper dissolution is dominated.71 Corrosion rates are decreased due to developing a protective inhibitor layer at the metal/solution contact.
After adding L-Met to the corrosive media, the appearance of Nyquist plots altered. Although the Nyquist plots do not show it well, two capacitive loops were not well isolated. However, the low-frequency straight line vanished, indicating the formation of an adhering and protective L-Met layer on the copper surface.
The appearance of Nyquist plots changed after the presence of L-Met. Although it cannot be seen clearly from the Nyquist plots, the two capacitive loops were not well separated. But, the low-frequency straight line disappeared, which shows that an adherent and protective L-Met film forms over the copper surface.
Although it is not evident from the Nyquist plots, two well-defined loops have emerged on the Bode plots (Fig. 3c and d). The low phase angle at low frequencies relates to nitrate ions attacking the metal surface. The elevated phase results from either the production of corrosion products at the metal/solution interface or the adsorption of amino acid molecules on the copper surface. This avoids forming further corrosion products at the contact between the metal and the solution through diffusion.
As seen in Fig. 3c, the amplitude (log|Z|) rises in the presence of inhibitors, reaching a maximum of 3.9 cm2 for 1 mM L-Met and 3.3 cm2 for 1 mM Cys, compared to 2.30 cm2 in the absence of inhibitors. The improved log(Z) demonstrates the protective effect of the amino acids.
When a new chemical (corrosion inhibitor) is introduced into the metal–electrolyte interface, its electrical double layer undergoes composition and structural modifications. Consequently, the inhibitor adsorption could be monitored by measuring the double layer capacitance before and after the addition of the corrosion inhibitor.72 Using the EC-lab simulation program, the electrical equivalent circuit (EEC) models shown in Fig. 4a and b were utilized to match the experimental results for 1 M HNO3 solutions without and with Cys and L-Met. The electrochemical parameters derived from the fitting results are summarized in Table 2. Rs represents the solution resistance, Rct the charge-transfer resistance, Rf the film resistance, and CPEf the constant phase element of the surface film. CPEdl signifies the constant phase element of the double layer. The following relationship was used to test the inhibitory efficiency of amino acids:
 | (9) |
 | ||
| Fig. 4 Electrical equivalent circuit models for Cu exposed to 1 M HNO3 without and with 1 mM Cys (a) and 1 mM L-Met (b) during a 2 h exposure period. | ||
| C(inh) | Rs (Ω cm2) | Rf (Ω cm2) | CPEf (μF cm−2) | n1 | Rct (Ω cm2) | CPEdl (μF cm−2) | n2 | w | IE (%) |
|---|---|---|---|---|---|---|---|---|---|
| Blank | 1.1 | 52.3 | 27.37 × 10⁻³ | 0.91 | 211.6 | 2.74 × 10⁻³ | 0.77 | 9132 | — |
| 1 mM Cys | 3.01 | 936.7 | 4.37 × 10⁻⁵ | 0.95 | 1116.0 | 4.7 × 10⁻⁴ | 0.73 | 711.8 | 81.03 |
| 1 mM L-Met | 2.4 | 406.3 | 1.33 × 10⁻⁵ | 0.94 | 4075 | 7.85 × 10⁻⁴ | 0.68 | — | 94.80 |
Rct0 and Rct are the charge transfer resistance in the absence and presence of the inhibitors, respectively.
As demonstrated in Table 2, the Rct values in the inhibited media are greater than those in the un-inhibited media. The experimental results are due to the formation of an inhibitor layer at the copper/solution contact. At 1 mM L-Met, the inhibition efficiency approaches 90,9%, resulting in enhanced electrode surface coverage.
3.3. Potential of zero charges and inhibition mechanism
In general, organic inhibitors work via adsorption on metal surfaces. Their adsorption on metal surfaces is influenced by various variables, including excess surface charge, surface structure, electrolyte composition, and the molecule's chemical structure. The extra surface charge of metals is a critical characteristic when examining the adsorption process of organic molecules. It is determined by the metal's open circuit potential (Eocp) position about the corresponding zero charge potential (PZC). As is widely known, all types of adsorptions begin with electrostatic contact between the adsorbent and the metal surface. So, the zero charge potential is a significant variable associated with the concept of adsorption. Experimentally, measuring the charge on the surface metal is difficult.73Consequently, an indirect method, such as extrapolating EPZC from EIS measurements, is a viable alternative. The potential is shown when the surface has a zero charge comparable to the maximum polarization resistance or the lowest capacitance. At this voltage, there is no ionic double layer on the surface of the electrode. At zero charge potential, the electrodes may absorb electrolyte molecules.73–78
For this reason, electrochemical impedance measurements analysis was performed, and a plot of polarization resistance, Rp (total resistance estimated at the metal surface contact), against applied potential was created.79–81
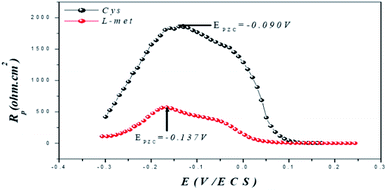
Fig. 5 shows the EIS curves generated after two hours of exposure. The PZC open-circuit voltage determines the copper surface charge.
| Er = Eocp − EPZC | (10) |
Er is Antropov's “rational” corrosion potential; Eocp is the open circuit potential. When Er is negative, the surface of the working electrode has a net negative charge, which promotes cation adsorption. When Er is positive, however, anions prefer to adsorb over cation exchange.79–81 This shows that the surface of the metal is positively charged, enabling the inhibitor molecules to be adsorbed as negatively charged nitrate ions, which bind the metal surface to the protonated amino acid molecules.
Fig. 5 is a diagram of a parabolic curve with maximum Rp values of −0.137 V for Cys and −0.09 V for L-Met (the maximum Rp value corresponds to the minimum Cdl value). Copper's Eocp (Ag/AgCl) in 1 M HNO3 under similar conditions is −0.73 V (Ag/AgCl). The Er value (−0.641 V or −0.593 V) determined from eqn (3) indicates that the copper surface is negatively charged after 2 hours of exposure to the presence of amino acids. Anions (NO3−) in an aqueous solution of nitric acid are attracted to the positively charged copper surface. Electrostatic interactions with NO3− produce bridges between the cationic amino acid form and the positively charged copper surface, resulting in the protonated positively charged inhibitors, Cys+ or L-Met+, adhering to the metal surface as adsorbed Cys+ or L-Met+. Because the inhibitor molecules attach to the copper surface through electrostatic interactions with positively charged Cys or L-Met molecules under acidic conditions, this outcome is possible. Multiple bonds or adsorption through heteroatoms such as N, S, or O may also be used to bind inhibitor compounds.
In addition, molecules may be adsorbed through donor–acceptor interactions involving the d electrons of copper atoms and the electrons of organic compounds. However, further research is necessary to validate this theory. The surface coating resists rusting well.
3.4. Scanning electron microscopy and energy-dispersive X-ray spectroscopy studies
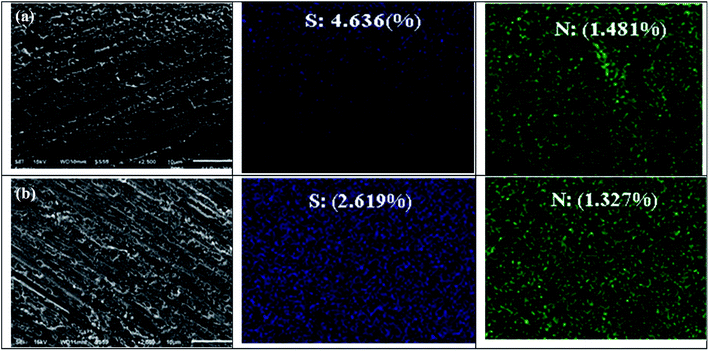
The SEM picture of Cu subjected to 1 M HNO3 for 2 hours without inhibitors is given in Fig. 6a. The micrograph of the Cu surface in 1 M HNO3 (Fig. 6a) shows that the metal surface is severely damaged due to copper dissolution in this aggressive medium; many fractures and pits are visible on the copper surface. The interaction between the copper surface with the NO3− ions results in the formation of copper-oxide. The EDX spectrum of the outer layer of copper after 2 hours of immersion in 1 M nitric acid (Fig. 6a′), The spectrum reveals the appearance of an oxygen peak (62.8%), which corresponds to the formation of copper oxides CuO and/or the cuprites Cu2O characterizing the corrosion products formed at the copper surface. However, adding 1 mM of L-Met and Cys to the corrosive medium individually (Fig. 7a and b) reduced its aggressiveness significantly and prevented corrosion on the copper surface, as seen by the much smoother copper surface was almost entirely covered with the inhibitor molecules. The use of inhibitors such as L-Met and Cys effectively prevents Cu oxidation.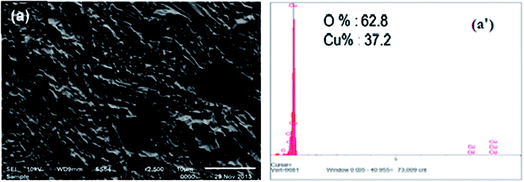 | ||
| Fig. 6 SEM images of Cu exposed to 1 M HNO3 solution without inhibitor after exposing for 2 h (a) and the EDX spectrum of the same surface (a′). | ||
Maximum protection was obtained when the copper sample was treated with L-Met. As indicated by the EDS spectra exhibited in the SEM pictures, it is believed that the adsorption of the inhibitor on the copper surface protects it against corrosion. EDS, an analytical method used for the elemental analysis or chemical characterization of materials, was used to explain the adsorption of amino acids. In the presence of two amino acids, the EDS spectra reveal the existence of sulfur, nitrogen peaks, and other essential constituents of inhibitors, with sulfur predominating. L-Met and Cys are composed of the elements sulfur and nitrogen.
Therefore, the protection of copper is associated with the adsorption of Sulphur atoms on metal surfaces. Both L-Met and Cys molecules include sulfur atoms. However, L-Met compounds are much more inhibitive than Cys. This phenomenon may be explained by the variation in the number of carbon atoms in the carboxylic chain. Increasing the amount of CH2 groups in a molecule's radical “R” modifies its inhibitory efficacy. L-Met works as a soft base and rapidly gives an electron to metal due to its increased reactivity.
3.5. Atomic force microscopic analysis
AFM is a highly effective method for examining nano to microscale surface morphologies. It has emerged as a new option for reviewing the inhibitor's effect on the initiation and continuation of corrosion at the metal/solution interface.19,44,82,83 AFM studies may be used to show the local corrosion behavior of metals in aggressive electrolytes at this level.Fig. 8 illustrates the surface morphologies of copper submerged in a 1 M HNO3 solution in the absence and presence of 1 mM L-Met or 1 mM Cys. As seen in Fig. 8a, the surface of copper was very rough and pitted owing to the metal's active breakdown in the absence of an inhibitor. Following the amino acid addition, surface layers develop and completely cover the metal surface (Fig. 8b and c).
 | ||
| Fig. 8 The 3D AFM images of Cu exposed to 1 M HNO3 without (a) and with the addition L-Met (b) and Cys (c) for 2 h. | ||
The average roughness Ra (the average departure of all points' roughness profiles from a mean line throughout the assessment length) and root mean square roughness, Rq, were determined using AFM image analysis (the average of the measured height deviations taken within the evolution length and measured from the mean line). Ra was 49.07 nm in an unrestricted 1 M HNO3 solution. Adding 1 mM L-Met or 1 mM Cys to the aggressive solution reduces the Ra to 27.50 or 47.64 nm, respectively. Compared to the surface of copper exposed to a free solution, the smoother surface may be attributed to the development of protective coatings on the metal surface. On the other hand, it should be noted that developing an organic layer over the surface increases surface roughness.
4. Effect of immersion time on the inhibition performance
For practical applications, it is expected that inhibitors would exhibit corrosion protection. Long-term studies were conducted to determine the inhibitor's potential to protect against oxidative stress due to exposure duration. The copper electrodes were subjected to 1 M HNO3 for 120 hours, followed by electrochemical and surface characterization investigations.4.1. Potentiodynamic measurements
Copper polarization graphs after 120 hours of immersion are shown in Fig. 9.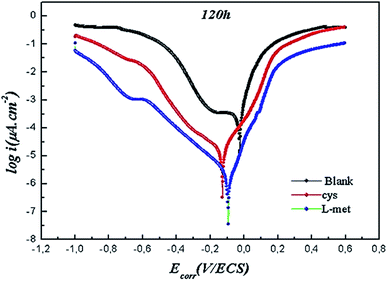 | ||
| Fig. 9 Potentiodynamic polarization curves of Cu after exposing to 1 M HNO3 solution in the absence and presence of 1 mM Cys or 1 mM L-Met for 120 h immersion. | ||
The current density rises substantially in the absence of the inhibitor when the exposure period is short (2 h), owing to the increased surface area created as Cu dissolves. However, the presence of both inhibitors significantly decreases the rate of Cu dissolution in the corrosive media. As seen in Table 3, the current densities are substantially reduced. In the case of inhibitors, the current densities are lower after 120 hours than during the shorter exposure period. Another critical aspect is that Cys grew more protective with prolonged exposure. The excellent inhibitory effect of the copper surface may be attributed to the development of a stable and protective layer. Therefore, the amino acids could act as a conventional barrier and prevent the penetration of corrosive media (H2O, O2, NO3−).84
| Cinb | Ecorr (mV) | icorr (μA cm−2) | IE (%) |
|---|---|---|---|
| 1 M HNO3 | −24.481 | 1654 | — |
| 1 mM Cys | −127.454 | 145.81 | 91,8 |
| 1 mM L-Met | −91.606 | 8.63 | 99.2 |
4.2. Electrochemical impedance measurements
Fig. 10 illustrates the Nyquist plots of Cu after 120 hours of immersion in 1 M HNO3 solution in the absence and presence of amino acids. As shown in Fig. 10, a main capacitive loop is found at high frequencies, while another appears in the low-frequency range. The first loop was ascribed to the charge transfer resistance between the metal and the OHP (outer Helmholtz plane) and the double-layer capacitance. At low frequencies, the second loop corresponds to the development of films on the metal surface and all other types collected at the metal/solution contact (inhibitor molecules, corrosion products, etc.). The sum of all resistance is polarization resistance (Rp).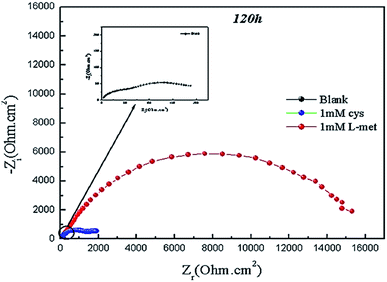 | ||
| Fig. 10 Nyquist plots of the Cu obtained in 1 M HNO3 solution in the absence and containing 1 mMCys or 1 mM L-Met after 120 h. | ||
After 120 hours of exposure in the absence of inhibitors, the polarization resistance and width of Nyquist plots of Cu were substantially decreased compared to 2 hours (see Fig. 2). On the other hand, resistances are considerably enhanced in the case of inhibitors, indicating that the surface inhibitor film is growing continuously and is approaching complete covering of the metal surface with the film.
Table 4 contains some electrochemical data deduced from Nyquist plots. Data acquired after a short exposure time (2 h, Table 1) are compared to those obtained after a longer exposure time (120 h, Table 4).
| C(inh) | Rs (Ω cm2) | Rf (Ω cm2) | CPEf (F cm−2) | Rct (Ω cm2) | CPEdl (F cm−2) | E (%) |
|---|---|---|---|---|---|---|
| 1 M HNO3 | 4.11 | 87.37 | 0.23 × 10⁻³ | 120 | 1.61 × 10⁻³ | — |
| 1 mM Cys | 1.77 | 278.7 | 45 × 10−5 | 1051 | 2.03 × 10⁻⁶ | 95.40 |
| 1 mM L-Met | 2.41 | 1378 | 0.22 × 10⁻⁶ | 16![[thin space (1/6-em)]](https://www.rsc.org/images/entities/char_2009.gif) 155 155 |
0.102.3 × 10−3 | 97.34 |
The values of Rf and Rct rise with a longer immersion duration (120 h) when compared to data obtained after a short exposure time (2 h). This finding is most likely owing to an increase in the inhibitors' surface coverage and the thickness of the protective layer, which results in greater inhibitory efficiency and enhanced protection capacity. After prolonged immersion, Cys offer superior protection. The EIS results and the polarization measurements match well.
4.3. Surface morphologies after long immersion
Fig. 11 shows the surface SEM images of copper after 120 hours of immersion in 1 M HNO3 solution without and with 1 mM Cys and 1 mM L-Met. Without inhibitors (Fig. 11a), the surface of copper was severely degraded; the number and depth of pits grew as copper breakdown was accelerated in the aggressive media. After the inhibitors were added, the metal surface was almost completely coated by inhibitor molecules, and protective inhibitor films were developed (Fig. 11b and c). The surface inhibitor coatings are compact and cling to the surface, providing high protection against corrosion. This shows that an effective protective layer of the tested inhibitor was adsorbed on the metal surface and that it effectively prevented surface steel corrosion.85 | ||
| Fig. 11 The SEM images of Cu after exposure to 1 M HNO3 solution in the absence (a) and presence of 1 mM Cys (b) or 1 mM L-Met (c) after 120 h. | ||
AFM studies were also used to inspect the surfaces of the same samples. Fig. 12 illustrates the electrode's 3D AFM pictures after exposure to Cu samples in test solutions. The data clearly show that copper develops high-quality amino acid films on its surface when exposed to an inhibitor-containing solution. These films provide a degree of protection that is unmatched in the industry.
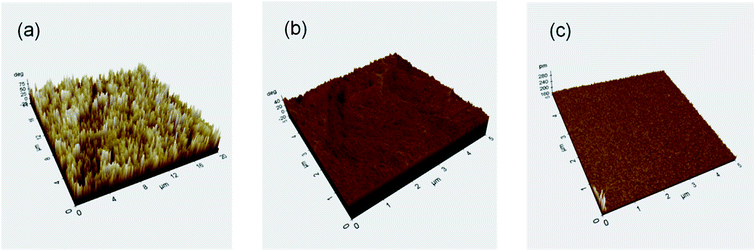 | ||
| Fig. 12 3D AFM images of Cu after exposing for 120 h to 1 M nitrate acid solution (a) without amino acids (b) Cys (1 M) (c) L-Met (1 M). | ||
5. Theoretical chemical calculation
The interaction between the studied amino acids and the copper surface was investigated and carried out in a simulation box (25.55 × 22.55 × 34.86 Å3) with periodic boundary conditions. COMPASS (Condensed Phase Optimized Molecular Potentials for Atomistic Simulation Studies) force field was used to optimize the structures of the components of the system.86 The quantum chemical parameters and geometric optimization results are given in Table 5.| EHOMO (eV) | ELUMO (eV) | GAP (eV) | χ | η | ω | ΔN | ||
|---|---|---|---|---|---|---|---|---|
| Cys | Neutral | −6.729 | −0.324 | 6.406 | 3.527 | 3.203 | 1.942 | 0.202 |
| Protonated | −7.214 | −0.912 | 6.302 | 4.063 | 3.151 | 2.619 | 0.120 | |
| L-Met | Neutral | −6.101 | −0.068 | 6.033 | 3.084 | 3.016 | 1.577 | 0.288 |
| Protonated | −6.261 | −0.797 | 5.464 | 3.529 | 2.732 | 2.280 | 0.236 |
EHOMO, the highest occupied molecular orbital, is often linked to a molecule's ability to donate electrons to other molecules. The high value of EHOMO indicates that inhibitor molecules seem to donate electrons to relevant low-energy receptor molecules with empty molecular orbitals. In contrast, the energy value of the lowest unoccupied molecular orbitals, ELUMO, is directly linked to the molecule's capacity to receive electrons. Reactivity of an inhibitor is heavily influenced by the HOMO and LUMO electron distributions, EHOMO and ELUMO, and the energy gap (ΔE).87
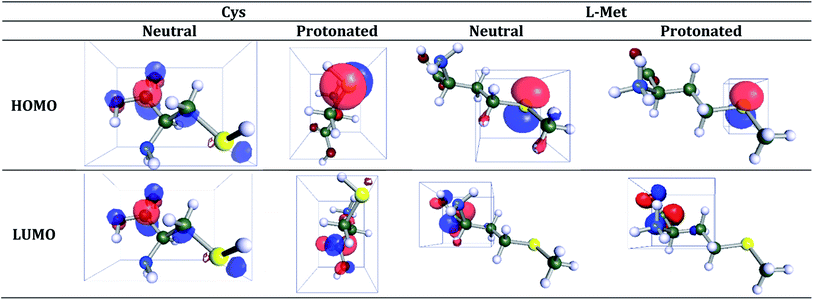
HOMO and LUMO orbitals of the neutral and protonated forms of both amino acids are illustrated in Fig. 13. The low values of ELUMO make it easier to accommodate additional negative charges from the surface of the metals. The value of gap (ΔE) is the difference between the EHOMO and ELUMO values. Therefore, the smaller value of ΔE would correspond to the inhibitor's higher reactivity and inhibition efficiency.
As shown in Table 5, the trend of EHOMO is L-Met > Cys (for the neutral and protonated forms). The higher EHOMO value of L-Met (neutral: −6.101 eV; protonated: −6.261 eV) indicates that the inhibition effect of this molecule is better, and the molecules are more likely to donate electrons to those molecules whose empty molecular orbital energy is lower. Furthermore, Cys ELUMO (neutral: −0.324 eV; protonated: −0.912 eV) < L-Met ELUMO (neutral: −0.068 eV; protonated: −0.797 eV) indicates that the Cys molecules tend to form a back-donating bond. Therefore, it will be easier for the inhibitor to accept electrons from the orbital “d”.88–90
The gap energy ΔE has a strong influence on the adsorption reactivity of the inhibitor molecules on the metal surface. When the ΔE value decreases, the molecule's reactivity increases, and the inhibition effect increases. As seen in Table 5, the ΔE value of the L-Met (neutral: 6.033 eV; protonated: 6.085 eV) is much lower than the Cys (neutral: 6.406 eV; protonated: 6.302 eV). This corresponds to a higher reactivity and inhibition efficiency of L-Met molecules, which agrees with the experimental results. According to Sanderson's principle of equalizing electronegativity, absolute electronegativity (χ) is the chemical characteristic that describes a molecule's ability to attract electrons. According to Lukovits,91 the effectiveness of inhibition is increased by enhancing the inhibitor's capacity to donate electrons to the metal surface. This implies that a higher ΔN value indicates a more significant inhibitory effect. Thus, positive values of ΔN represent electron transport from molecules to metal surfaces, while negative values represent electron transfer from metal surfaces to molecules.23,74,88,92–94
The results indicate that the ΔN value correlates substantially with experimental inhibition efficiencies (Table 5). Thus, the highest proportion of electron transfer (neutral: 0.288 eV; protonated: 0.236 eV) is associated with the most potent inhibitor, L-Met, which is experimentally confirmed.
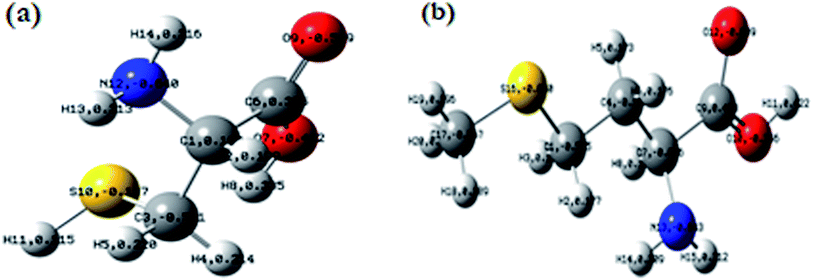
Mulliken analysis has been extensively used to estimate inhibitor adsorption sites.95 The Mulliken charge is proportional to the vibrational characteristics of the molecule and measures how the electronic structure is charged. It is mainly used to determine the charge distribution inside the molecule's skeleton, which provides information about the reactive sites. Thus, the more negatively charged the heteroatom, the higher the capacity for donor–acceptor absorption on the metal surface.
Fig. 14 illustrates the Mulliken charges for the two chemicals examined. These findings show all heteroatoms (nitrogen, oxygen, and sulfur) have negative charges and a high electron density. When these atoms contact the copper surface, they function as nucleophilic centers.
The COSMO-RS research is primarily concerned with the chemical molecular and comparative atomic reactivity sites. Various colors correspond to different values of the charge distribution at the surface (Fig. 15). Red denotes areas with the highest concentration of negative charges (high electron density), blue denotes regions with the most increased positive charges (low electron density), and green indicates areas with no charges. Charge levels rise in the following order: red, orange, yellow, green, blue, and purple (purple is only present for the cationic part of the protonated molecule).
As shown in Fig. 15, the electron-rich areas (red to orange color) are mainly concentrated around heteroatoms (N, O, and S) and conjugated double bonds, which favors an electrophilic attack. Hydrogen atoms are positively charged (blue) and serve as a target for nucleophilic assaults.
6. Monte Carlo
Monte Carlo simulations investigated the adsorption properties of the two amino acids examined (L-Met and Cys) on a copper surface (111). Cu(111)/Cys and Cu(111)/L-Met in water as solvent and HNO3 (acidic medium as H+ and NO3−) are determined via system optimization (Fig. 16). The collected data are shown in Table 6.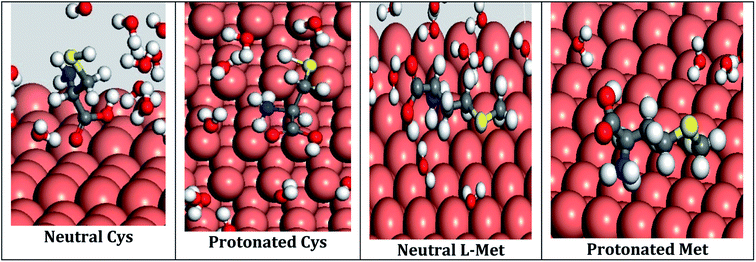 | ||
| Fig. 16 Equilibrium adsorption configurations of studied inhibitors on copper (111) surface obtained by molecular dynamics simulations Cys has relatively higher inhibition energy than L-Met. | ||
| Amino acid | Form | Total energy | Adsorption energy | Rigid adsorption energy | Deformation energy | dEad/dNi | |||
|---|---|---|---|---|---|---|---|---|---|
| Inhibitor | H2O | H3O+ | Cl− | ||||||
| L-Met | Neutral | −53.24 | −1780.79 | −60.57 | −1720.21 | −82.58 | −16.51 | ||
| Protonated | −60.29 | −2090.96 | −69.78 | −2021.17 | −22.58 | −16.52 | −36.10 | −0.53 | |
| Cys | Neutral | −48.79 | −1771.79 | −54.01 | −1717.78 | −75.95 | −16.51 | ||
| Protonated | −66.64 | −2098.37 | −74.98 | −2023.39 | −24.00 | −16.51 | −36.47 | −0.31 | |
Theoretically, the chemical inhibitor with the lowest adsorption energy value should have the highest inhibitory energy. The adsorption energies of two inhibitors in water are negative, as illustrated in Table 6. The significant negative result suggests inhibitor adsorption on Cu (111) happens spontaneously, becomes more stable, and is stronger.96–98
These results are attributable to an increase in active adsorption sites in the molecular structure of amino acids.99–101 Stiff adsorption energy is needed when the unrelaxed molecules (L-Met and Cys) are adsorbed on the copper (111) surface before the geometry optimization process. When the molecules of the adsorbed component are relaxed on the copper surface, the deformation energy is released.
As shown in Fig. 16, the studied inhibitor molecules were parallel adsorbed on the copper surface, promoting the interaction of the amino acid molecules' π-electrons (N atoms) with the copper surface.94–96
7. Mechanism of action of Cys and L-Met on the metal surface Cu
Experiments and theoretical investigations provide a comprehensive understanding of the corrosion inhibition mechanism and, as a result, the nature of inhibitor–Cu interactions.102The presence of nitric acid in the medium allows the protonation of the nitrogen of the amino acids to form the cationic derivatives. However, the variation in inhibition effectiveness between Cys and L-Met comes from the nature of the R substituents. Therefore, the nucleophilicity of sulfur is responsible for the inhibition. In general, the efficiency of an organic substance as an inhibitor for metallic corrosion depends on its molecule structure, the characteristics of the environment, and the mode of interaction with the metal surface. The presence of the long chain in L-Met decreases its polarity. This allows blocking the action of the corrosive solution. The molecule is absorbed on the metal surface by electron donation to the vacant d-orbital. Cys is more polar than L-Met, which explains the excellent inhibition of L-Met. In addition, the donor effect of the methyl group increases the electronic density of the sulfur group (Fig. 17).
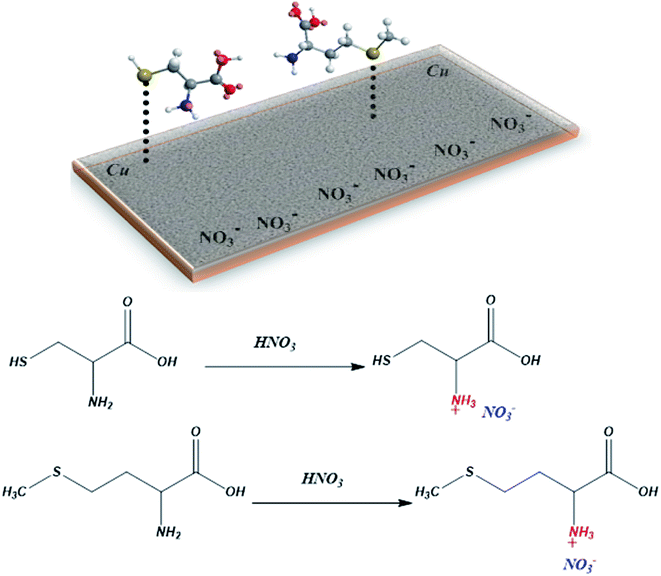 | ||
| Fig. 17 Schematic representation of the interaction between Cys and L-Met with copper surface in the presence of HNO3. | ||
Following the theoretical study performed on protonated Cys and L-Met, it was determined that the inhibition effect of the L-Met compound is more effective than the Cys. In the present investigations, the energy gap of L-Met is 5464 eV. A small energy gap of HOMO–LUMO means more chemically active, low kinetic stability, and shows that the compound can be easily excited, favoring the compound inhibition.
This table shows that all the Mulliken charges carried by the heteroatoms of L-Met are greater than the charges of Cys (Table 7).
| L-Met | Cys | ||
|---|---|---|---|
| S–CH3 | 0.089 | SH | 0.026 |
C![[double bond, length as m-dash]](https://www.rsc.org/images/entities/char_e001.gif) O O |
−0.391 | C![[double bond, length as m-dash]](https://www.rsc.org/images/entities/char_e001.gif) O O |
−0.382 |
| C–O | −0.507 | C–O | −0.503 |
| NH | −0.528 | NH | −0.521 |
8. Conclusions
• The obtained results showed that Cys and L-Met perform good inhibition efficiency for corrosion of Cu in 1 M HNO3 and affect by acting on both anodic and cathodic mechanisms.• The inhibition efficiency of the amino acids increases with the increasing exposure time due to thickening or better surface coverage of the surface films.
• The variation in inhibition effectiveness between Cys and L-Met comes from the nature of the R substituents. Therefore, the nucleophilicity of sulfur is responsible for the inhibition.
• The presence of the long-chain in L-Met decreases its polarity. This allows blocking the action of the corrosive solution. The molecule is absorbed on the metal surface by electron donation to the vacant d-orbital of copper. Cys is more polar than L-Met, which explains the excellent inhibition of L-Met. In addition, the donor effect of the methyl group increases the electronic density of the sulfur group.
• The surface analysis by SEM and AFM studies showed that the corrosion of copper in nitric acid occurs mainly through pitting. Adding inhibitors to the aggressive solution forms a protective film on a copper surface.
• As experimental and theoretical studies have shown, chemical interactions may occur through reactive areas inside molecules. The inhibitor molecules adsorb on the copper surface, protecting the hostile medium. Quantum chemical analysis corroborated the experimental results and established that the inhibitors under study have a strong tendency for adsorption onto the metallic surface.
Conflicts of interest
There are no conflicts to declare.Acknowledgements
The authors are immensely thankful to Bingöl University Central Laboratory for characterization measurements and Chemistry Department for electrochemical measurements. The authors are grateful for the support of the researchers supporting project number (RSP-2021/113), King Saud University, Riyadh, Saudi Arabia.References
- P. Thanapackiam, et al., Electrochemical evaluation of inhibition efficiency of ciprofloxacin on the corrosion of copper in acid media, Mater. Chem. Phys., 2016, 174, 129–137 CrossRef CAS.
- B. Tan, et al., Insight into the corrosion inhibition of copper in sulfuric acid via two environmentally friendly food spices: combining experimental and theoretical methods, J. Mol. Liq., 2019, 286, 110891 CrossRef CAS.
- J. He, et al., Insight into the anticorrosion mechanism of 2-aminobenzenethiol as the inhibitor for copper in acid environment, J. Mol. Liq., 2020, 320, 114494 CrossRef CAS.
- A. Jmiai, et al., A new trend in corrosion protection of copper in acidic medium by using Jujube shell extract as an effective green and environmentally safe corrosion inhibitor: Experimental, quantum chemistry approach and Monte Carlo simulation study, J. Mol. Liq., 2021, 322, 114509 CrossRef CAS.
- B. Tan, et al., Insights into the inhibition mechanism of three 5-phenyltetrazole derivatives for copper corrosion in sulfuric acid medium via experimental and DFT methods, J. Taiwan Inst. Chem. Eng., 2019, 102, 424–437 CrossRef CAS.
- L. Guo, et al., Eco-friendly food spice 2-furfurylthio-3-methylpyrazine as an excellent inhibitor for copper corrosion in sulfuric acid medium, J. Mol. Liq., 2020, 317, 113915 CrossRef CAS.
- A. Fateh, M. Aliofkhazraei and A. Rezvanian, Review of corrosive environments for copper and its corrosion inhibitors, Arabian J. Chem., 2020, 13(1), 481–544 CrossRef CAS.
- P. P. Samal, et al., Free Base Phthalocyanine Coating as A Superior Corrosion Inhibitor for Copper Surfaces: A Combined Experimental and Theoretical Study, Colloids Surf., A, 2022, 129138 CrossRef CAS.
- D. S. Chauhan, et al., Electrochemical, ToF-SIMS and computational studies of 4-amino-5-methyl-4H-1, 2, 4-triazole-3-thiol as a novel corrosion inhibitor for copper in 3.5% NaCl, J. Mol. Liq., 2019, 289, 111113 CrossRef CAS.
- C. Jing, et al., Photo and thermally stable branched corrosion inhibitors containing two benzotriazole groups for copper in 3.5 wt% sodium chloride solution, Corros. Sci., 2018, 138, 353–371 CrossRef CAS.
- C. U. Dueke-Eze, et al., Adsorption and inhibition study of N-(5-methoxy-2-hydroxybenzylidene) isonicotinohydrazide Schiff base on copper corrosion in 3.5% NaCl, Egypt. J. Pet., 2022, 31(2), 31–37 CrossRef.
- I. Kusumaningrum, et al., Investigation of Artocarpus Heterophyllus peel extract as non-toxic corrosion inhibitor for pure copper protection in nitric acid, Case Stud. Chem. Environ. Eng., 2022, 100223 CrossRef CAS.
- M. Hegazy, A. A. Nazeer and K. Shalabi, Electrochemical studies on the inhibition behavior of copper corrosion in pickling acid using quaternary ammonium salts, J. Mol. Liq., 2015, 209, 419–427 CrossRef CAS.
- A. Fiala, et al., Investigations of the inhibition of copper corrosion in nitric acid solutions by ketene dithioacetal derivatives, Appl. Surf. Sci., 2007, 253(24), 9347–9356 CrossRef CAS.
- A. Zarrouk, et al., Synthesis, characterization and comparative study of functionalized quinoxaline derivatives towards corrosion of copper in nitric acid medium. 2012 Search PubMed.
- D. Kumar, V. Jain and B. Rai, Imidazole derivatives as corrosion inhibitors for copper: a DFT and reactive force field study, Corros. Sci., 2020, 171, 108724 CrossRef CAS.
- Y. Abdallah and K. Shalabi, Comprehensive study of the behavior of copper inhibition in 1 M HNO3 by Euphorbia helioscopia linn. extract as green inhibitor, Prot. Met. Phys. Chem. Surf., 2015, 51(2), 275–284 CrossRef CAS.
- K. Shalabi, et al., Adsorption, Electrochemical Behavior, and Theoretical Studies for Copper Corrosion Inhibition in 1 M Nitric acid Medium using Triazine Derivatives, J. Mol. Liq., 2022, 348, 118420 CrossRef CAS.
- G. Karthik and M. Sundaravadivelu, Investigations of the inhibition of copper corrosion in nitric acid solutions by levetiracetam drug, Egypt. J. Pet., 2016, 25(4), 481–493 CrossRef.
- A. Fouda and H. A. Wahed, Corrosion inhibition of copper in HNO3 solution using thiophene and its derivatives, Arabian J. Chem., 2016, 9, S91–S99 CrossRef CAS.
- Y. Zeng, et al., Melamine modified carbon dots as high effective corrosion inhibitor for Q235 carbon steel in neutral 3.5 wt% NaCl solution, J. Mol. Liq., 2022, 349, 118108 CrossRef CAS.
- S. Wan, et al., Kapok leaves extract and synergistic iodide as novel effective corrosion inhibitors for Q235 carbon steel in H2SO4 medium, Ind. Crops Prod., 2022, 178, 114649 CrossRef CAS.
- B. El Ibrahimi, et al., Theoretical evaluation of some α-amino acids for corrosion inhibition of copper in acidic medium: DFT calculations, Monte Carlo simulations and QSPR studies, J. King Saud Univ., Sci., 2020, 32(1), 163–171 CrossRef.
- M. Bedair, et al., Synthesis, electrochemical and quantum chemical studies of some prepared surfactants based on azodye and Schiff base as corrosion inhibitors for steel in acid medium, Corros. Sci., 2017, 128, 54–72 CrossRef CAS.
- A. El Asri, et al., Computational and experimental studies of the inhibitory effect of imidazole derivatives for the corrosion of copper in an acid medium, J. Mol. Liq., 2022, 345, 117813 CrossRef CAS.
- A. K. Singh, et al., Hydroxy phenyl hydrazides and their role as corrosion impeding agent: A detail experimental and theoretical study, J. Mol. Liq., 2021, 330, 115605 CrossRef CAS.
- B. Chugh, et al., Relation of degree of substitution and metal protecting ability of cinnamaldehyde modified chitosan, Carbohydr. Polym., 2020, 234, 115945 CrossRef PubMed.
- A. K. Singh, et al., Green approach of synthesis of thiazolyl imines and their impeding behavior against corrosion of mild steel in acid medium, Colloids Surf., A, 2020, 599, 124824 CrossRef CAS.
- R. A. Sheldon, Green and sustainable manufacture of chemicals from biomass: state of the art, Green Chem., 2014, 16(3), 950–963 RSC.
- J.-H. Lee and V. F. Wendisch, Production of amino acids–genetic and metabolic engineering approaches, Bioresour. Technol., 2017, 245, 1575–1587 CrossRef CAS PubMed.
- S. A. Demerchi, et al., Effect of L-methionine feeding on serum homocysteine and glutathione levels in male and female Wistar rats, Adv. Biochem., 2020, 8(1), 21–25 CrossRef CAS.
- Z. Micovic, et al., The effects of subchronic methionine overload administered alone or simultaneously with L-cysteine or N-acetyl-L-cysteine on body weight, homocysteine levels and biochemical parameters in the blood of male wistar rats, Serb. J. Exp. Clin. Res., 2016, 17(3), 215–224 CrossRef CAS.
- V. Srivastava, et al., Amino acid based imidazolium zwitterions as novel and green corrosion inhibitors for mild steel: Experimental, DFT and MD studies, J. Mol. Liq., 2017, 244, 340–352 CrossRef CAS.
- D. S. Chauhan, et al., Thiosemicarbazide and thiocarbohydrazide functionalized chitosan as ecofriendly corrosion inhibitors for carbon steel in hydrochloric acid solution, Int. J. Biol. Macromol., 2018, 107, 1747–1757 CrossRef CAS PubMed.
- D. Kumar, et al., Amino acids as copper corrosion inhibitors: A density functional theory approach, Appl. Surf. Sci., 2020, 514, 145905 CrossRef CAS.
- Y. Xu, et al., Experimental and theoretical investigations of some pyrazolo-pyrimidine derivatives as corrosion inhibitors on copper in sulfuric acid solution, Appl. Surf. Sci., 2018, 459, 612–620 CrossRef CAS.
- J. Zhang, L. Zhang and G. Tao, A novel and high-efficiency inhibitor of 5-(4-methoxyphenyl)-3h-1, 2-dithiole-3-thione for copper corrosion inhibition in sulfuric acid at different temperatures, J. Mol. Liq., 2018, 272, 369–379 CrossRef CAS.
- E. Kowsari, et al., In situ synthesis, electrochemical and quantum chemical analysis of an amino acid-derived ionic liquid inhibitor for corrosion protection of mild steel in 1M HCl solution, Corros. Sci., 2016, 112, 73–85 CrossRef CAS.
- W. Gong, et al., 2-Amino-4-(4-methoxyphenyl)-thiazole as a novel corrosion inhibitor for mild steel in acidic medium, Prog. Org. Coat., 2019, 126, 150–161 CrossRef CAS.
- G. L. Mendonça, et al., Understanding the corrosion inhibition of carbon steel and copper in sulphuric acid medium by amino acids using electrochemical techniques allied to molecular modelling methods, Corros. Sci., 2017, 115, 41–55 CrossRef.
- J. Bao, et al., Biomass polymeric microspheres containing aldehyde groups: Immobilizing and controlled-releasing amino acids as green metal corrosion inhibitor, Chem. Eng. J., 2018, 341, 146–156 CrossRef CAS.
- A. Fawzy, et al., Thermodynamic, kinetic and mechanistic approach to the corrosion inhibition of carbon steel by new synthesized amino acids-based surfactants as green inhibitors in neutral and alkaline aqueous media, J. Mol. Liq., 2018, 265, 276–291 CrossRef CAS.
- A. Aouniti, K. Khaled and B. Hammouti, Correlation between inhibition efficiency and chemical structure of some amino acids on the corrosion of armco iron in molar HCl, Int. J. Electrochem. Sci., 2013, 8, 5925–5943 CAS.
- R. Farahati, et al., Synthesis and potential applications of some thiazoles as corrosion inhibitor of copper in 1 M HCl: Experimental and theoretical studies, Prog. Org. Coat., 2019, 132, 417–428 CrossRef CAS.
- A. Chirkunov, et al., Adsorption of 5-alkyl-3-amino-1, 2, 4-triazoles from aqueous solutions and protection of copper from atmospheric corrosion, Corros. Sci., 2018, 144, 230–236 CrossRef CAS.
- C. Loto, et al., Potentiodynamic Polarization and Gravimetric Evaluation of Corrosion of Copper in 2M H2SO4 and its inhibition with Ammonium Dichromate, Procedia Manuf., 2019, 35, 413–418 CrossRef.
- Ž. Z. Tasić, et al., Cephradine as corrosion inhibitor for copper in 0.9% NaCl solution, J. Mol. Struct., 2018, 1159, 46–54 CrossRef.
- G. Ji and R. Prakash, Composites of Donor-π-Acceptor type configured organic compound and porous ZnO nano sheets as corrosion inhibitors of copper in chloride environment, J. Mol. Liq., 2019, 280, 160–172 CrossRef.
- K. Vinothkumar and M. G. Sethuraman, Corrosion inhibition ability of electropolymerised composite film of 2-amino-5-mercapto-1, 3, 4-thiadiazole/TiO2 deposited over the copper electrode in neutral medium, Mater. Today Commun., 2018, 14, 27–39 CrossRef CAS.
- B. Tan, et al., A combined experimental and theoretical study of the inhibition effect of three disulfide-based flavouring agents for copper corrosion in 0.5 M sulfuric acid, J. Colloid Interface Sci., 2018, 526, 268–280 CrossRef CAS PubMed.
- K. El Mouaden, et al., Chitosan polymer as a green corrosion inhibitor for copper in sulfide-containing synthetic seawater, Int. J. Biol. Macromol., 2018, 119, 1311–1323 CrossRef CAS PubMed.
- X. He, et al., Corrosion inhibition of perimidine derivatives for mild steel in acidic media: electrochemical and computational studies, J. Mol. Liq., 2018, 269, 260–268 CrossRef CAS.
- T. Zhang, et al., Synthesis and localized inhibition behaviour of new triazine-methionine corrosion inhibitor in 1 M HCl for 2024-T3 aluminium alloy, Mater. Chem. Phys., 2019, 237, 121866 CrossRef CAS.
- J. Wysocka, et al., Carboxylic acids as efficient corrosion inhibitors of aluminium alloys in alkaline media, Electrochim. Acta, 2018, 289, 175–192 CrossRef CAS.
- H. Ashassi-Sorkhabi, Z. Ghasemi and D. Seifzadeh, The inhibition effect of some amino acids towards the corrosion of aluminum in 1 M HCl+ 1 M H2SO4 solution, Appl. Surf. Sci., 2005, 249(1–4), 408–418 CrossRef CAS.
- C. Verma, et al., Electrochemical, thermodynamic, surface and theoretical investigation of 2-aminobenzene-1, 3-dicarbonitriles as green corrosion inhibitor for aluminum in 0.5 M NaOH, J. Mol. Liq., 2015, 209, 767–778 CrossRef.
- L. Hamadi, et al., The use of amino acids as corrosion inhibitors for metals: a review, Egypt. J. Pet., 2018, 27(4), 1157–1165 CrossRef.
- A. Sedik, S. Abderrahmane and A. Himour, Cysteine inhibitor effects on copper corrosion in 1 M HNO3 solution, Sens. Lett., 2011, 9(6), 2219–2222 CrossRef CAS.
- A. Sedik, et al., Synergistic Effect of L-Methionine and KI on Copper Corrosion Inhibition in HNO3 (1M), Sens. Transducers J., 2014, 27, 326–335 Search PubMed (Special Issue)..
- M. F. Nassar, et al., Study to amino acid-based inhibitors as an effective anticorrosion material, J. Mol. Liq., 2022, 119449 CrossRef.
- A. Klamt and G. Schüürmann, COSMO: a new approach to dielectric screening in solvents with explicit expressions for the screening energy and its gradient, J. Chem. Soc., Perkin Trans. 2, 1993,(5), 799–805 RSC.
- S. G. Balasubramani, et al., TURBOMOLE: Modular program suite for ab initio quantum-chemical and condensed-matter simulations, J. Chem. Phys., 2020, 152(18), 184107 CrossRef CAS PubMed.
- K. Khaled, Corrosion control of copper in nitric acid solutions using some amino acids–A combined experimental and theoretical study, Corros. Sci., 2010, 52(10), 3225–3234 CrossRef CAS.
- M. Ebrahimzadeh, et al., Theoretical and experimental investigations on corrosion control of 65Cu–35Zn brass in nitric acid by two thiophenol derivatives, Appl. Surf. Sci., 2015, 332, 384–392 CrossRef CAS.
- K. Rybalka, L. Beketaeva and A. Davydov, Estimation of corrosion current by the analysis of polarization curves: Electrochemical kinetics mode, Russ. J. Electrochem., 2014, 50(2), 108–113 CrossRef CAS.
- I. Semenova, G. Florianovich, and A. Khoroshilov, Corrosion and corrosion protection, M.: FIZMATLIT, 2002, p. 298 Search PubMed.
- E. E. Stansbury and R. A. Buchanan, Fundamentals of electrochemical corrosion, ASM international, 2000 Search PubMed.
- F. Krid, E. Zouaoui and M. S. Medjram, Aqueous extracts of Opuntia Ficus-Indica as green corrosion inhibitor of A283C carbon steel IN 1N sulfuric acid solution, Chem. Chem. Technol., 2018, 12(3), 405–409 CrossRef CAS.
- H. Gadow, T. A. Farghaly and A. Eldesoky, Experimental and theoretical investigations for some spiropyrazoles derivatives as corrosion inhibitors for copper in 2 M HNO3 solutions, J. Mol. Liq., 2019, 294, 111614 CrossRef CAS.
- H. Ma, et al., inhibition of copper corrosion by several Schiff bases in aerated halide solutions, J. Appl. Electrochem., 2002, 32(1), 65–72 CrossRef CAS.
- D.-Q. Zhang, et al., Inhibition effect of some amino acids on copper corrosion in HCl solution, Mater. Chem. Phys., 2008, 112(2), 353–358 CrossRef CAS.
- H. Ferkous, et al., Corrosion inhibition of mild steel by 2-(2-methoxybenzylidene) hydrazine-1-carbothioamide in hydrochloric acid solution: Experimental measurements and quantum chemical calculations, J. Mol. Liq., 2020, 307, 112957 CrossRef CAS.
- A. Sedik, et al., Dardagan Fruit extract as eco-friendly corrosion inhibitor for mild steel in 1 M HCl: Electrochemical and surface morphological studies, J. Taiwan Inst. Chem. Eng., 2020, 107, 189–200 CrossRef CAS.
- N. Yilmaz, A. Fitoz and K. C. Emregül, A combined electrochemical and theoretical study into the effect of 2-((thiazole-2-ylimino) methyl) phenol as a corrosion inhibitor for mild steel in a highly acidic environment, Corros. Sci., 2016, 111, 110–120 CrossRef CAS.
- G. Sığırcık, T. Tüken and M. Erbil, Assessment of the inhibition efficiency of 3, 4-diaminobenzonitrile against the corrosion of steel, Corros. Sci., 2016, 102, 437–445 CrossRef.
- A. Khadiri, et al., Gravimetric, electrochemical and quantum chemical studies of some pyridazine derivatives as corrosion inhibitors for mild steel in 1 M HCl solution, J. Taiwan Inst. Chem. Eng., 2016, 58, 552–564 CrossRef CAS.
- R. Yıldız, An electrochemical and theoretical evaluation of 4, 6-diamino-2-pyrimidinethiol as a corrosion inhibitor for mild steel in HCl solutions, Corros. Sci., 2015, 90, 544–553 CrossRef.
- I. Merimi, et al., Insights into corrosion inhibition behavior of a triazole derivative for mild steel in hydrochloric acid solution, Mater. Today: Proc., 2019, 13, 1008–1022 CAS.
- G. Kardas and R. Solmaz, Electrochemical investigation of barbiturates as green corrosion inhibitors for mild steel protection, Corros. Rev., 2006, 24(3–4), 151–172 CAS.
- F. Bentiss, et al., 2, 5-Bis (4-dimethylaminophenyl)-1, 3, 4-oxadiazole and 2, 5-bis (4-dimethylaminophenyl)-1, 3, 4-thiadiazole as corrosion inhibitors for mild steel in acidic media, Corros. Sci., 2004, 46(11), 2781–2792 CrossRef CAS.
- R. Solmaz, Investigation of adsorption and corrosion inhibition of mild steel in hydrochloric acid solution by 5-(4-dimethylaminobenzylidene) rhodanine, Corros. Sci., 2014, 79, 169–176 CrossRef CAS.
- M. A. Chidiebere, et al., Ascorbic acid as corrosion inhibitor for Q235 mild steel in acidic environments, J. Ind. Eng. Chem., 2015, 26, 182–192 CrossRef CAS.
- P. Muthukrishnan, B. Jeyaprabha and P. Prakash, Adsorption and corrosion inhibiting behavior of Lannea coromandelica leaf extract on mild steel corrosion, Arabian J. Chem., 2017, 10, S2343–S2354 CrossRef CAS.
- S. Wan, et al., Anticorrosive reinforcement of waterborne epoxy coating on Q235 steel using NZ/BNNS nanocomposites, Prog. Org. Coat., 2021, 159, 106410 CrossRef CAS.
- A. Kahlouche, et al., Molecular insights through the experimental and theoretical study of the anticorrosion power of a new eco-friendly Cytisus multiflorus flowers extract in a 1 M sulfuric acid, J. Mol. Liq., 2022, 347, 118397 CrossRef CAS.
- H. Sun, COMPASS: an ab initio force-field optimized for condensed-phase applications overview with details on alkane and benzene compounds, J. Phys. Chem. B, 1998, 102(38), 7338–7364 CrossRef CAS.
- B. Chugh, et al., Investigation of phenol-formaldehyde resins as corrosion impeding agent in acid solution, J. Mol. Liq., 2021, 330, 115649 CrossRef CAS.
- Y. Karzazi, et al., Density functional theory modeling and monte carlo simulation assessment of N-substituted quinoxaline derivatives as mild steel corrosion inhibitors in acidic medium, J. Mater. Environ. Sci., 2016, 7, 3916–3929 CAS.
- L. O. Olasunkanmi and E. E. Ebenso, Experimental and computational studies on propanone derivatives of quinoxalin-6-yl-4, 5-dihydropyrazole as inhibitors of mild steel corrosion in hydrochloric acid, J. Colloid Interface Sci., 2020, 561, 104–116 CrossRef CAS PubMed.
- A. Belakhdar, et al., Computational and experimental studies on the efficiency of Rosmarinus officinalis polyphenols as green corrosion inhibitors for XC48 steel in acidic medium, Colloids Surf., A, 2020, 606, 125458 CrossRef CAS.
- I. Lukovits, E. Kalman and F. Zucchi, Corrosion inhibitors—correlation between electronic structure and efficiency, Corrosion, 2001, 57(1), 3–8 CrossRef CAS.
- B. El Ibrahimi, et al., Computational study of some triazole derivatives (un-and protonated forms) and their copper complexes in corrosion inhibition process, J. Mol. Struct., 2016, 1125, 93–102 CrossRef CAS.
- A. Kokalj, On the HSAB based estimate of charge transfer between adsorbates and metal surfaces, Chem. Phys., 2012, 393(1), 1–12 CrossRef CAS.
- L. H. Madkour, S. Kaya and I. B. Obot, Computational, Monte Carlo simulation and experimental studies of some arylazotriazoles (AATR) and their copper complexes in corrosion inhibition process, J. Mol. Liq., 2018, 260, 351–374 CrossRef CAS.
- B. Lv, et al., How did the corrosion inhibitor work in amino-functionalized ionic liquids for CO2 capture: Quantum chemical calculation and experimental, Int. J. Greenhouse Gas Control, 2019, 91, 102846 CrossRef CAS.
- S. Umoren, et al., Effect of degree of hydrolysis of polyvinyl alcohol on the corrosion inhibition of steel: theoretical and experimental studies, J. Adhes. Sci. Technol., 2015, 29(4), 271–295 CrossRef CAS.
- S. Kaya, et al., determination of corrosion inhibition effects of amino acids: quantum chemical and molecular dynamic simulation study, J. Taiwan Inst. Chem. Eng., 2016, 58, 528–535 CrossRef CAS.
- A. Ayuba, et al., Theoretical study of aspartic and glutamic acids as corrosion inhibitors on aluminium metal surface, Moroccan J. Chem., 2018, 6(1), 160–172 CAS.
- M. K. Awad, M. R. Mustafa and M. M. A. Elnga, Computational simulation of the molecular structure of some triazoles as inhibitors for the corrosion of metal surface, J. Mol. Struct.: THEOCHEM, 2010, 959(1–3), 66–74 CrossRef CAS.
- A. Jmiai, et al., Chitosan as an eco-friendly inhibitor for copper corrosion in acidic medium: protocol and characterization, Cellulose, 2017, 24(9), 3843–3867 CrossRef CAS.
- A. Jmiai, et al., Alginate biopolymer as green corrosion inhibitor for copper in 1 M hydrochloric acid: Experimental and theoretical approaches, J. Mol. Struct., 2018, 1157, 408–417 CrossRef CAS.
- B. Chugh, et al., An exploration about the interaction of mild steel with hydrochloric acid in the presence of N-(Benzo [d] thiazole-2-yl)-1-phenylethan-1-imines, J. Phys. Chem. C, 2019, 123(37), 22897–22917 CrossRef CAS.
| This journal is © The Royal Society of Chemistry 2022 |


