DOI:
10.1039/D1RA09268E
(Paper)
RSC Adv., 2022,
12, 2351-2360
Recovery of copper, zinc and lead from photovoltaic panel residue†
Received
22nd December 2021
, Accepted 11th January 2022
First published on 17th January 2022
Abstract
The increase in photovoltaic panel installations in Europe will generate vast amounts of waste in the near future. Therefore, it is important to develop new technologies that allow the recycling of end-of-life photovoltaic panels. This material can serve as a secondary resource, not only for precious metals (e.g. silver), but also for base metals. In this work, the extraction and recovery of the base metals copper, zinc and lead from a copper-rich photovoltaic panel residue was investigated. The material was first leached at 80 °C under microwave irradiation with a mixture of hydrochloric acid, sodium chloride and hydrogen peroxide solutions. Based on the Box–Behnken factorial design optimization, it was possible to extract 81.2% of Cu, 96.4% of Zn and 77.6% of Pb, under the following leaching conditions: [HCl] = 0.5 mol L−1, [NaCl] = 200 g L−1, [H2O2] = 7.5 wt% and t = 60 min. Cementation with iron powder at a 1.2 iron-to-copper stoichiometric ratio allowed the recovery of copper nearly quantitatively (99.8%) as a copper–iron sediment. The gas–liquid separation technique of ion flotation was employed to separate lead and zinc from the dilute copper-free leachate. Cetyltrimethylammonium bromide (CTAB), a cationic surfactant, selectively recovered lead (99.4%) over zinc as lead(II) tetrachloro cetyltrimethylammonium colloid, after eight ion flotation stages and [CTAB]total = 7.2 mmol L−1. The zinc that remained in the solution after the ion flotation step was recovered by precipitation and by adding sodium sulfide at 110% of the stoichiometric amount after removing iron as ferric hydroxide by slowly raising the pH to 3.7.
Introduction
Electricity production by photovoltaic panels (PVPs) is an efficient, environmentally friendly and well-established technology. In 2020, according to the International Energy Agency, PVP installations in the EU reached 151.3 GW of the total cumulative installed capacity with a growth rate of around 30% per year.1 However, the growth in PVP installations along with their moderate life span (25–30 years) will result in more than 60 million tons of PVP waste by the end of 2050 worldwide. Without proper management, this waste can pose a serious environmental threat (e.g. release of Pb or Cd to the environment) and a loss of valuable metals (e.g. Cu, Ag, etc.).2–4 Therefore, it is essential to develop new technologies for recycling the PVPs.
Current advances on metal recovery from PVPs are focussed on precious metals, like silver.5–9 Nevertheless, this material can also serve as a secondary resource for base metals such as copper, zinc and lead. As these metals are usually present in metallic or alloy form, green solvents such as ionic liquids or deep eutectic solvents could be employed for their extraction.4–11 Chloride leaching is also a very effective and industrialized hydrometallurgical process to extract copper, zinc and lead due to the propensity of these metals to form stable chloro complexes, according to the following general reaction:11–13
| | |
Mn+(aq) + xCl−(aq) → [MCln]xn−x(aq)
| (1) |
Although the use of HCl is known to be corrosive and volatile, industry has learnt how to deal with these negative properties. In particular, leaching is usually performed in pressurised closed reactors to prevent the release of chloride gas, which takes place at temperatures above 50 °C. Additionally, these reactors are made by materials with anticorrosive properties (e.g. PTFE).14–16 Chloride salts, such as sodium or magnesium chloride, could be added to increase the total chloride concentration of the lixiviant and/or reduce the acid consumption (i.e. HCl). Therefore, leaching with a mixture of HCl and a chloride salt could be employed for the extraction of copper, zinc and lead from PVPs. Given the mineralogy of metals in PVPs (metallic or alloy form), the presence of an oxidizing agent, such as H2O2, is necessary for their solubilization.4–9 Microwave (MW) irradiation could further enhance the leaching efficiencies of the targeted metals, reduce leaching time and offer a faster heating process compared to conventional vat and/or pressure leaching.17,18 Several researchers have evaluated the effect of microwave irradiation in chloride media and reported very promising results.19–22
Various hydrometallurgical techniques could be used for the recovery of copper from a copper-rich brine, such as chemical precipitation, cementation and solvent extraction followed by electrolysis (SX-EW).23 Cementation of copper with iron has been extensively investigated and appears to be the simplest method to recover copper from copper-rich chloride solutions in one step as a copper–iron sediment.24–26
Unlike metals in concentrated solutions, it is difficult to separate metals from a dilute aqueous solution. The recovery of metals from dilute aqueous solutions by solvent extraction, ion exchange and adsorption is hindered by high extractant losses, the high cost of selective adsorbents and large production of secondary waste, respectively.27 Ion flotation is a gas–liquid separation technique that is based on differences in surface activity and it is capable for recovering metals from dilute aqueous solutions.28–31 More specifically, the solution to be treated is sparged with gas bubbles and surfactants are added to generate a mobile gas–liquid interface. Metal counterions or metal complexes, also known as colligends, are adsorbed to this interface due to chemical or electrostatic interactions with the hydrophilic group of the surfactants. This interaction results in either the formation of insoluble colloid complexes (sublates) or barely soluble metal-surfactant complexes, which are concentrated in a stable foam phase on top of the aqueous phase. The technique has attracted researchers' attention due to its simplicity, fast operation and high metal recovery yields.32–41 Previous research has established that it can potentially be considered as an alternative hydrometallurgical operation for the recovery of valuable or precious metals (e.g. Cu, Zn, PGMs, rare earths), as well as a detoxification technique for the removal of hazardous metals (e.g. Cd, As) from dilute systems. On the other hand, the implementation of ion flotation in hydrometallurgical or detoxification operations has been impeded by a number of limitations, mostly concerning the reusability of the collectors. Recent studies though have successfully developed methods for recycling the surfactants used in ion flotation.42–44
Zinc and lead could occur at relative low concentrations in many chloride leachates. In many cases one is interested in selectively recovering or removing one metal over the other. Although the ion flotation of zinc and lead has already been investigated, it has barely been tested under realistic conditions.32,36,45–48 The interpretation of experimental data from synthetic solutions to real ones might prove problematic, due to the complexity of the chemical matrix of hydrometallurgical leachates.
The objectives of this paper are to determine the optimum microwave leaching conditions for the extraction of copper, zinc and lead from a copper-rich PVP residue and to assess the separation of lead from zinc from diluted real brine solutions by ion flotation. Leaching was carried out by introducing a lixiviant consisting of a mixture of HCl, NaCl and H2O2. Prior to the ion flotation experiments, copper was recovered by cementation.
Experimental
Materials
Cetyltrimethylammonium bromide, CTAB (≥98%), sodium chloride (a.r.), hydrogen peroxide solution (30 wt%) and sodium sulfide (a.r.) were purchased from Merck KGaA (Darmstadt, Germany). Multi element standard solution (100 mg L−1 in 2–5% HNO3) and iron powder (<44 mm, 97%) were obtained from Sigma-Aldrich (Overijse, Belgium). Hydrochloric acid solution (37 wt%) was purchased from VWR (Fontenay-sous-Bois, France). Tetrafluoroboric acid solution (50% w/w), ethanol (EtOH, 99.8+%, absolute) and sodium hydroxide (pearls, a.r.) were obtained from Fisher Scientific (ThermoFisher Scientific, Loughborough, United Kingdom). Nitric acid solution (65 wt%) and silver standard solution (1000 mg L−1 in 2–5% HNO3) were purchased from Chem-Lab NV (Zedelgem, Belgium). Water was always of ultrapure quality, deionized to a resistivity of 18.2 MΩ cm with a Millipore ultrapure water system. All chemicals were used as received without any further purification. The photovoltaic panel residue was produced in the PVP recycling installation of Groupe Comet (Belgium).
Instrumentation
The mineralogical composition of the starting material and the Cu and Fe precipitates was characterized by X-ray diffraction analysis using a Philips PW 1380 diffractometer equipped with Cu cathode, a graphite monochromator, and a receiving slit (1 mm) in continuous scanning mode at a voltage of 45 kV, a current of 30 mA. The raw data were processed with Profex software (version 4.0). The starting material was also characterized by stereo microscopy using a Leica M 165C stereo microscope. A DigiPREP Block Digestion System (SCP Science) was used for the digestion of the starting material and solid residue. Microwave-assisted leaching experiments were performed in 100 mL pressured sealed vessels, in a Milestone® FlexiWave laboratory set-up, equipped with two 950 W magnetrons providing an overall power of 1.8 kW at a 2.45 GHz frequency. The pH and the oxidation–reduction potential (ORP) of the pregnant leaching solutions (PLS) was measured with Mettler–Toledo pH and ORP electrodes respectively, after calibration with standard buffer solutions. Cementation of copper from the PLS was carried out in glass vials in Thermoshakers from ThermoFisher Scientific. Ion flotation experiments were carried out in a glass column (45 cm high and 4.5 cm internal diameter) equipped with a sintered glass disc (D4 pore size, ∼10–15 μm), described in previous publications of the authors.41,49 The carbon, hydrogen and nitrogen content of the sublate was measured in triplicate using a Thermo Scientific FLASH2000 CHN analyzer. The precipitation of iron and zinc after the ion flotation stage was set-up in 150 mL round bottom flasks on RCT classic magnetic stirrer. After leaching, cementation and precipitation, the solid phases were separated from the liquid phases by vacuum filtration with a 1.6 μm filtration paper. Concentrations of elements in all solutions were measured by an inductively coupled plasma-optical emission spectrometer (ICP-OES; PerkinElmer Avio 500) equipped with an axial/radial dual plasma view and GemCone High Solids nebulizer. Dilutions were made with 5 wt% HNO3 solutions and all ICP-OES samples were measured in triplicate. The dilution factor was chosen so that the final concentration was lower than 25 mg L−1 and scandium was used as internal standard. A Heraeus D-6450 oven was employed to dry the solid samples.
Preparation and characterization of photovoltaic panel residue
The PVP residue was received as a fine (<2 mm) polymetallic fraction. The silicate phases were separated from the metallic phases by wet gravimetric separation in shaking tables. The metallic fraction was dried and sieved into two fractions (<250 μm and >250 μm). From the <250 μm fraction, the majority of the iron (Fe) content was removed by employing dried magnetic separation and one microwave leaching step with HCl solution under the following conditions: [HCl] = 4 mol L−1, liquid-to-solid (L/S) ratio 10 mL g−1 and t = 60 min at 80 °C. The solid residue was dried at 40 °C for 1 day and was used for the subsequent microwave-assisted leaching experiments (Fig. S1†). The chemical composition was determined by ICP-OES analysis after digestion with HCl/HNO3/HBF4 (6/2/4 volume ratio of concentrated HCl, HNO3 and HBF4) for 2 h at 105 °C in a heating block. The material was also characterized by XRD using the McCrone method.50 More specifically, 1.8 g of sample were mixed with 0.2 g of rutile (TiO2), which was used as internal standard. The solid mixture was then homogenized by adding ethanol and milled for 5 min in a McCrone micronizing mill. The mixture was left to dry overnight and then measure by XRD.
Leaching experiments
The microwave-assisted leaching experiments were performed at L/S ratio of 10 mL g−1 (10 mL/1 g). The lixiviant mixture was prepared before mixing it with the mass of the examined sample. The vessels were sealed and placed in the microwave reactor. The microwave heating program consisted of a 15 min ramp up to 80 °C, followed by a set holding time, after which microwave irradiation was stopped and the vessels were left to cool. Immediately after the filtration, aliquots from the PLS were withdrawn and diluted with HNO3 (5 wt%) for ICP-OES analysis. At the relevant optimal leaching conditions, larger volumes of PLS were prepared by mixing 5 g of PVP sample with 50 mL of lixiviant. The leaching efficiency EL(%) was calculated according to equation (eqn (2)):| |
 | (2) |
where CPLS is the metal ion concentration in the PLS (mg L−1), VLIX is the recovered volume of the lixiviant used for leaching (L), ms is the mass of the solid material used for leaching (kg) and Cs is the concentration of the metal in the material before leaching (mg kg−1). The pH and ORP of the PLS was also measured after filtration. The optimum leaching conditions of Cu, Zn and Pb were determined based on Box–Behnken design. This experimental design consists of an incomplete factorial design with three levels (low, medium and high; −1, 0, +1) and N number of experiments according to the following:| | |
N = 2k × (k − 1) + Co
| (3) |
where, k is the number of factors and Co is the number of replicates at the central point. The design performed in this study comprised 4 factors (the concentration of HCl (A), NaCl (B), and H2O2 (C), and leaching time (D)) and 3 central points, resulting in total of 27 randomly carried out experiments.51 The investigated parameters, as well as their ranges, were chosen based on preliminary experiments. Table 1 shows the independent variables, as well as their decodified values, distributed in three levels. Minitab® software (version 17.10) was used to estimate the model coefficients through regression analysis and to calculate the response surfaces for each leaching yield (copper, zinc and lead). HSC Chemistry® (version 10.0.6.7) was used for the calculation of Eh–pH (Pourbaix) diagrams of the generated PLS at the relevant best leaching conditions (i.e. [HCl] = 0.5 mol L−1, [NaCl] = 200 g L−1, [H2O2] = 7.5 wt% and t = 60 min) and for the calculation of the Gibbs free energy (ΔG) of eqn (10)–(16).
Table 1 Experimental parameters for the 43 Box–Behken design
| Independent variables |
Code |
Levels |
| −1 |
0 |
+1 |
| HCl (mol L−1) |
A |
0 |
1.5 |
3 |
| NaCl (g L−1) |
B |
0 |
100 |
200 |
| H2O2 (wt%) |
C |
0 |
5 |
10 |
| Time (min) |
D |
10 |
35 |
60 |
Cementation experiments
The recovery of copper by cementation was performed by mixing 5 mL of the PLS of the most optimal leaching system (i.e. [HCl] = 0.5 mol L−1, [NaCl] = 200 g L−1, [H2O2] = 7.5 wt% and t = 60 min) with 50, 100, 150, 200 and 250 mg of iron powder. The vials were sealed and shake in a shaker for 30 min at room temperature. At the end of the experiments the solutions were filtered and aliquots were withdrawn for ICP-OES analysis. The cementation efficiency of copper EC(%) was calculated based on eqn (4):| |
 | (4) |
where CiCu and CrCu are the initial and residual copper concentration of the bulk solution (mg L−1), respectively. The cementation precipitate was washed with Milli-Q water, dried at 40 °C for 24 h and characterized by XRD. At the relevant best cementation conditions larger volumes (50 mL) of copper-free solutions were prepared for the subsequent ion flotation experiments.
Ion flotation experiments
The ion flotation experiments were performed by mixing the solution after the cementation stage with 94.8 mg of CTAB ([CTAB] = 0.9 mmol L−1). The solutions were stirred for 15 min with a magnetic stirring bar on a magnetic stirrer at low speed (200 rpm), to avoid the generation of foam. The solutions were then poured slowly in the flotation column using a funnel. Subsequently, nitrogen gas was bubbled through the solution from the bottom. Aliquots were withdrawn for ICP-OES analyses and pH measurements from the bulk solution were performed before and after the flotation experiments. The efficiency of flotation results was expressed as the recovery percentage (Re%) according to the following:| |
 | (5) |
where Ci and Cr are the initial and residual metal ion concentration of the bulk solution (mg L−1), respectively. In all the ion flotation experiments 0.5% (v/v) of ethanol (EtOH) was added as a frother. The generated foam was collected into a beaker and was left to physically collapse. The concentrated solution was then centrifuged in order to separate and collect the sublate, which was characterized by CHN analysis.
Precipitation experiments
The precipitation of iron from the solution after the ion flotation stage was performed by slowly raising the pH to 4 through sodium hydroxide addition at room temperature. At specific pH values, aliquots were withdrawn for ICP-OES analysis. The solution was filtered and the precipitate was characterized by XRD analysis. For the zinc recovery experiments, the required amount of sodium sulfide was added to the filtered iron-free solution, which was then stirred at room temperature for 30 min. The precipitate was washed with Milli-Q water and dried at 40 °C for 24 h. The precipitate was then digested in hydrochloric acid (37 wt%) at room temperature and its metal content was determined by ICP-OES analysis. The precipitation efficiency EP(%), was calculated according to eqn (6):| |
 | (6) |
where CP and CM are the concentrations of metals (mg L−1) after and before the precipitation, respectively.
All experiments were performed at least in duplicate (N = 2) and data points in figures represent mean values. Error bars were calculated as the standard deviation. When the error bar is not visible in the figure, it is smaller than the marker.
Results and discussion
Characterization of photovoltaic panel residue
As presented in Table 2, the examined sample mainly consisted of Cu, Pb, Fe and Zn. Mineralogical analyses revealed a composition of mainly Cu- and Pb-bearing mineral and non-crystalline phases (Fig. 1). Copper phases were represented by metallic copper and malachite (Cu2CO3(OH)2), which were also confirmed by the microscopic observations (Fig. S2a†). The detected lead-bearing phases were assigned to litharge (PbO) and laurionite (PbCl(OH)). The presence of laurionite was probably related to the fact the examined sample was first pre-treated by a chloride-leaching step. Unlike copper phases, lead-bearing minerals were not distinguishable by the stereo microscope (Fig. S2b†). Although little information can be found in the literature about mineralogy of PVPs, it is most likely that non-crystalline phases were different types of alloys and Si-based structures (e.g. Si tubes, silicon metals, amorphous silicon), based on the microscopic observations (Fig. S2c†).9,52–55 These non-crystalline phases produced broad and low-intensity peaks, which probably hindered the detection of some minor trace phases (e.g. metallic or alloy form of Zn and Pb), which were observed as black wires (Fig. S2d†).
Table 2 Main elemental composition of the photovoltaic panel residue
| Element |
wt% |
Element |
wt% |
| Ag |
0.2 |
Na |
0.9 |
| Al |
0.6 |
Ni |
0.5 |
| Ba |
0.5 |
Pb |
21.0 |
| Ca |
0.6 |
Sb |
0.2 |
| Cr |
0.6 |
Si |
3.2 |
| Cu |
43.3 |
Sn |
0.9 |
| Fe |
7.1 |
Ti |
0.3 |
| Mg |
0.4 |
Zn |
2.6 |
| Mn |
0.2 |
|
|
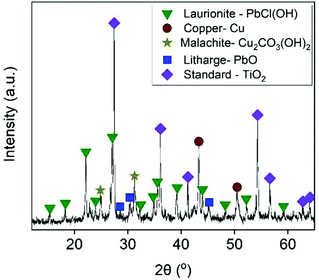 |
| | Fig. 1 X-ray diffractogram of starting material. | |
Microwave-assisted leaching of PVP residue
The leaching efficiencies of Cu, Zn and Pb of the 43 Box–Behnken design are presented in Table S1.† Closer inspection on this table shows that high leaching yields (>80%) were obtained for Cu and Zn at experiment numbers 20, 23, 5, 7 and 27. The conditions in these experiments were 1.5 or 3.0 mol L−1 of HCl, 100 or 200 g L−1 and 5 wt% of H2O2. On the other hand, neither Cu nor Zn were leached whenever the concentration of H2O2 was close to 0% (experiment numbers 2, 3, 10, 21 and 24), indicating that they were present in the PVP material as metallic Cu and Zn and an oxidizing agent was necessary for their solubilization. Leaching time did not appear to have any significant impact on the leaching efficiencies of Cu and Zn. The highest leaching efficiencies for Pb were obtained at experiment numbers 8 (81.9%), 27 (69.4%) and 7 (67.8%), where the NaCl concentration was 200 g L−1 and the concentration of HCl and H2O2 were at medium levels (1.5 mol L−1 and 5 wt%, respectively). A longer leaching time appeared to have a slight beneficial impact on the leachability of Pb compared to Cu and Zn. The average leachability of Fe in all experiments was around 30% and was highly dependent on the total chloride concentration of the lixiviant. Ag showed a moderate leachability between 40–55% whenever high levels of HCl (3 mol L−1) and NaCl (200 g L−1) were tested. However, after 24 h a small amount of a white precipitate was noticed in the PLS. After re-measuring the metal content, Ag solubilization was almost negligible, which was probably related to the formation of AgCl precipitate.12
The results presented in Table S1† were evaluated through regression analysis. Eqn (7)–(9) express the models for leaching of Cu, Zn and Pb respectively over the range of the examined experimental conditions.
| | |
EL(Cu)(%) = −64.8 + 31.6A + 0.4B + 18.65C+ 0.5D − 1.72A2 − 1.12C2 − 0.12A × B
| (7) |
| | |
EL(Zn)(%) = −77.6 + 51.7A + 0.52B + 27.84C+ 0.47D − 7.63A2 − 1.74C2 − 0.15A × B
| (8) |
| | |
EL(Pb)(%) = −6.4 + 11.4A + 0.15B + 6.71C+ 0.91D − 2.07A2 − 0.64C2 − 0.4A × C− 0.25A × D
| (9) |
where
A,
B and
C are the concentrations of HCl, NaCl and H
2O
2 and
D the leaching time. To assess the adequacy of the models, described by the above mentioned equations, the coefficients of determination (
R2) were calculated. Based on the regression analysis the
R2 values of
eqn (6)–(8) were 0.87, 0.90 and 0.88 (Fig. S3, S4 and S5
†), respectively. Since these values are greater than 0.7, the models were considered as adequate to explain the leaching behavior of Cu, Zn and Pb from the PVP residue.
56
The interaction plots for Cu, Zn and Pb leachabilities (Fig. S6–S8†) along with the p-values (Fig. S3–S5†) obtained from the regression analysis confirmed the initial observations. It is noted that when p < 0.05, the factor is considered as statistically significant.51 More specifically, for Cu leaching the significant factors were H2O2 (p = 0.00), HCl (p = 0.005) and NaCl (p = 0.02) concentration. The leaching efficiency of Zn was significantly affected by H2O2 (p = 0.00) and HCl (p = 0.01) concentration. Finally, the solubilization of Pb was mainly depended on NaCl concentration (p = 0.00).
The significance of H2O2 concentration in Cu leachability is illustrated in the contour plot of Fig. 2a. Based on the statistical model, at [H2O2] > 6 wt% the leaching efficiency of Cu was expected to be above 80% with low content of HCl, provided that [NaCl] = 200 g L−1 and t = 60 min. At [H2O2] < 6 wt% and medium to high levels of HCl concentration Cu leachability was expected to be 60–80%. As can be seen from Fig. 2b, high leaching efficiencies of Cu (>80%) could be obtained with reduced acid consumption ([HCl] < 1 mol L−1) and [NaCl] = 200 g L−1. A similar trend can be observed from the contour plots of Zn leachability (Fig. 3a and b). Medium levels of H2O2 and HCl content (5 wt% and 1.5 mmol L−1) at high levels of NaCl concentration (200 g L−1) were expected to leach more than 80% of Pb based on the contour plots of Fig. 4a and b.
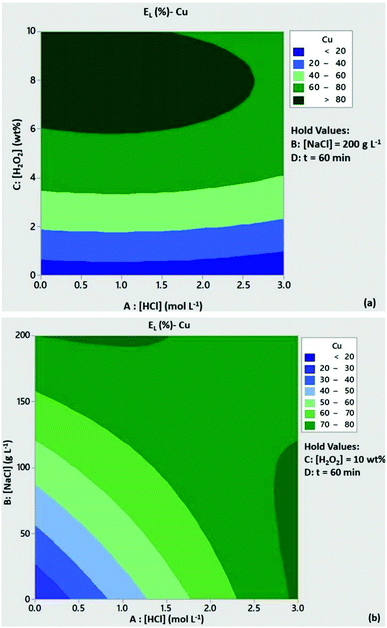 |
| | Fig. 2 Contour plots of Cu leaching efficiency as a function of (a) [HCl]/[H2O2] and (b) [HCl]/[NaCl]. Conditions: L/S = 10 mL g−1, T = 80 °C, t = 60 min and (a) [NaCl] = 200 g L−1, (b) [H2O2] = 10 wt%. | |
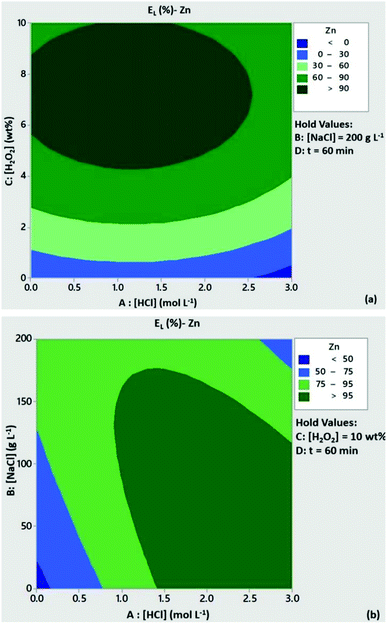 |
| | Fig. 3 Contour plots of Zn leaching efficiency as a function of (a) [HCl]/[H2O2] and (b) [HCl]/[NaCl]. Conditions: L/S = 10 mL g−1, T = 80 °C, t = 60 min and (a) [NaCl] = 200 g L−1, (b) [H2O2] = 10 wt%. | |
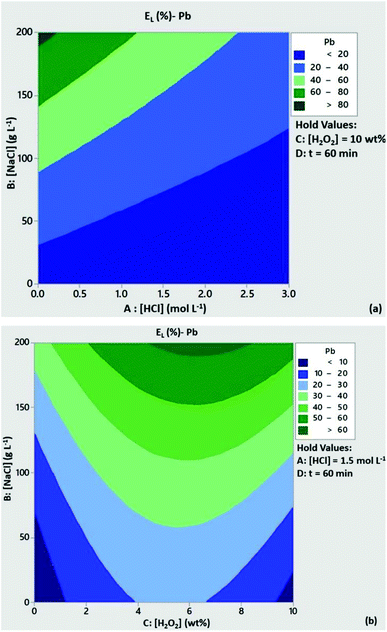 |
| | Fig. 4 Contour plots of Pb leaching efficiency as a function of (a) [HCl]/[NaCl] and (b) [H2O2]/[NaCl]. Conditions: L/S = 10 mL g−1, T = 80 °C, t = 60 min and (a) [H2O2l] = 10 wt%, (b) [HCl] = 1.5 mol L−1. | |
According to the response optimization of the examined system, the best leaching efficiencies for Cu, Zn and Pb should be obtained under the following conditions: [HCl] = 0.5 mol L−1, [NaCl] = 200 g L−1, [H2O2] = 7.5 wt% and t = 60 min. The leaching efficiencies obtained after microwave leaching of the PVP residue under these conditions were 81.2% for Cu, 96.4% for Zn and 77.6% for Pb. The Pourbaix diagrams (Fig. S9–S11†) suggested that the thermodynamically stable Cu, Zn and Pb species were CuCl+, ZnCl3− and PbCl42−, at the measured pH (0.21 ± 0.2) and ORP (480 ± 50 mV vs. Ag/AgCl) of the generated leachate. The chemical composition of the solid residue is provided at Table S2.†
Based on the discussion above, it can be suggested that the leaching mechanism of the metallic Cu and Zn phases was controlled by eqn (10)–(13), whereas the solubilization of Pb from PbCl(OH), metallic Pb and PbO phases was regulated by eqn (14)–(16).
| | |
Cu(s) + H2O2(aq) + 2H+ → Cu2+(aq) + 2H2O(l), ΔG80°C = −283.26 kJ
| (10) |
| | |
Cu2+(aq) + Cl−(aq) → CuCl+(aq), ΔG80°C = −4.06 kJ
| (11) |
| | |
Zn(s) + H2O2(aq) + 2H+ → Zn2+(aq) + 2H2O(l), ΔG80°C = −454.54 kJ
| (12) |
| | |
Zn2+(aq) + 3Cl−(aq) → ZnCl3−(aq), ΔG80°C = −10.70 kJ
| (13) |
| | |
PbCl(OH) + H+ → Pb2+(aq) + Cl−(aq) + H2O(l), ΔG80°C = −2.11 kJ
| (14) |
| | |
Pb2+(aq) + 4Cl−(aq) → 4PbCl42−(aq), ΔG80°C = −11.33 kJ
| (15) |
| | |
PbO(s) + 4Cl−(aq) + 2H+ → 4PbCl42−(aq) + 2H2O(l), ΔG80°C = −85.09 kJ
| (16) |
Recovery of copper by cementation
As discussed in the introduction, cementation with iron is a simple and fast method to selectively recover copper from chloride solutions. Based on the previous section, at the relevant optimal leaching conditions, copper was present in the PLS as a CuCl+ complex. Therefore, the recovery of copper by the addition of iron powder can be described by the following displacement reaction:| | |
CuCl+(aq) + Fe(s) → Cu(s) + FeCl+(aq)
| (17) |
The effect of Fe/Cu stoichiometric ratio as function of Cu recovery is illustrated in Fig. 5. Increasing the Fe/Cu stoichiometric ratio from 0.6 to 1.2 resulted into a steep increase in the cememtation efficiency from 32.4% to almost 100%. As expected from eqn (17), the cementation process enriched the solution with Fe species. At the optimal cementation conditions the Fe content was increased from 2.7 g L−1 (PLS before cementation) to 29.5 g L−1. The XRD analysis (Fig. 6) of cementation precipitate (Fig. S13†) verified the presence of metallic Cu and Fe. Small peak intensities of Pb and Zn phases were also detected and assigned to PbO and ZnFe2O4.
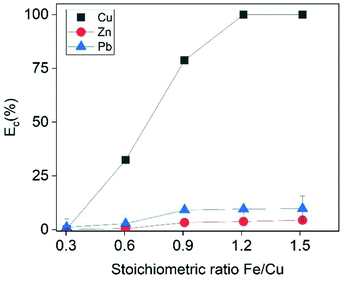 |
| | Fig. 5 Cementation efficiency of Cu as a function of the stoichiometric ratio Fe/Cu. Conditions: t = 30 min, [Cu]I = 500 mmol L−1, [Zn]I = 23 mmol L−1, [Pb]I = 23 mmol L−1. | |
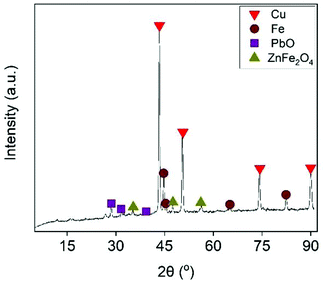 |
| | Fig. 6 55 min (5 min per stage) [EtOH] = 0.5% (v/v), V = 50 mL, flowrate = 25 mL min−1. | |
Recovery of lead by ion flotation
The Cu-depleted PLS after the cementation step contained Pb and Zn as well as high amount of Fe. Based on the discussion in the previous sections, Pb and Zn were present as the negatively charged species PbCl42− and ZnCl3−. Fe was present as the positively charged complex FeCl+ (eqn (17) and Fig. S12†). Theoretically, the addition of a cationic collector, such as CTAB, should electrostatically attract the negatively charged PbCl42− and ZnCl3− complexes and repel the positively charged FeCl+ complex. As a consequence, Pb and/or Zn could be recovered by ion flotation with rejection of iron. The experimental results supported this hypothesis, since 12.3% of Pb was recovered within the first 5 min, while at the same time the floatabilities of Fe and Zn were negligible (Fig. 7). Although both Pb and Zn were present as negatively charged species, the addition of CTAB favored the recovery of Pb over Zn. This behavior might be attributed to the difference in the charges of Pb and Zn chloro-complexes (PbCl42− and ZnCl3−, respectively). Previous studies evaluating the selectivity in ion flotation have shown that the separation of two different colligends with different charges of the same sign was relatively straightforward to explain. For positively charged species; the higher the charge of a colligend, the higher its affinity to interact with the collector over another colligend of lower valence.33,57–59 In reviewing the literature, no data was found concerning the selectivity of negatively charged species of different valence. To the best of our knowledge, previous researchers have only investigated the selectivity of negatively charged species of the same valence.60 Based on the reported results of this study, the trend was similar with that of the positively charged species theory, as the highest-charged complex (PbCl42−) was favorably adsorbed to the gas–liquid interface. A note of caution is due here since this explanation is rather empirical, because it relies on observations of specific experimental data and not on a well-established theory. Future work is required to establish the validity of this hypothesis, which was beyond the scope of the present study.
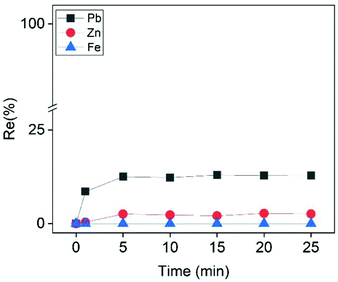 |
| | Fig. 7 Effect of ion flotation time on the recovery efficiency of Zn, Pb and Fe from the PLS after the cementation step. Conditions: [CTAB] = 0.9 mmol L−1, [Zn]i= 22.5 mmol L−1, [Pb]i = 3.5 mmol L−1, [Fe]i = 500 mmol L−1, [EtOH] = 0.5% (v/v), V = 50 mL, flowrate = 25 mL min−1. | |
The separation mechanism involved an electrostatic interaction of the hydrophilic part of the collector (CTA+) with the PbCl42− complex at the gas–liquid interface. This interaction resulted in the formation of a sublate (Fig. S14†), according to the eqn (18). CHN and ICP-OES analysis showed that the elemental composition of the sublate was 48.6 wt% C, 3.9 wt% N, 8.4 wt% H and 23.2 wt% Pb. These experimental results had very small deviations from the theoretical wt% of the suggested chemical formula of the sublate (i.e. 49.7 wt% C, 3.1 wt% N, 9.2 wt% H and 22.6 wt% Pb).
| | |
PbCl42−(aq) + 2CTA+(aq) → (CTA)2[PbCl4](s)
| (18) |
Despite the fact that the system was selective for Pb, the recovery efficiency was poor (12.3%). The lead concentration in the initial solution was 3.5 mmol L−1 and based on eqn (18) at least 2 molecules of CTAB were required to adsorb one molecule of PbCl42− at the gas–liquid interface. Consequently, CTAB concentration should be at least at the stoichiometric amount of 7 mmol L−1 for a quantitatively recovery of Pb from that solution. However, this was not possible because the critical micelle concentration (CMC) of CTAB is around 0.9 mmol L−1.61 The formation of micelles has a negative impact on the efficiency of ion flotation technique, because the colligends cannot interact with hydrophilic group of the collector.30 For this reason the concentration of CTAB was carefully calculated to be below its CMC value in all ion flotation experiments. As a result, it was practically impossible to recover all the Pb in one step at the examined conditions.
On the other hand, 12.3% of Pb was recovered very fast (5 min) according to Fig. 7. Provided that repeated dosages of CTAB were added in the solution, it would be possible to enhance the overall recovery efficiency of lead in multiple ion flotation stages and in a relevant short treatment time. In a previous study by the authors it was proven that the addition of extra dosages was beneficial for the overall recovery efficiency of the colligend.50
As shown in Fig. 8, the addition of extra dosages of CTAB progressively increased the overall recovery efficiency of Pb from 12.3% to almost 100% after eight ion flotation stages. In particular, the recovery efficiency increased by approximately 10% during each of the first three ion flotation stages (12.3%, 20.2%, 30.8% respectively), followed by a steep increase to 47.5%, 73.2% and 88.5% after the 4th, 5th and 6th stage. This steep increase was likely to be related to the fact that, by the end of each stage, the solution was more and more dilute in Pb content. At the end of the 8th stage the recovery efficiency of Pb reached a plateau of 99.4%, which was considered the optimal value. The total CTAB consumption after 8 ion flotation stages was equal to 7.2 mmol L−1, slightly above the stoichiometric amount required (7 mmol L−1) according to eqn (16).
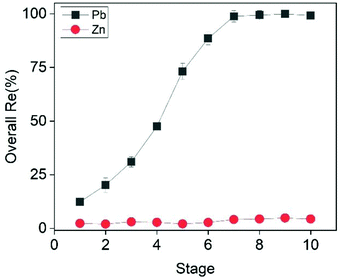 |
| | Fig. 8 Effect of ion flotation stage on the recovery efficiency of Pb and Zn. Conditions: [Zn]i= 22.5 mmol L−1, [Pb]i = 3.5 mmol L−1, [CTAB]total = 9 mmol L−1 (0.9 mmol L−1 per stage), ttotal = 50 min (5 min per stage) [EtOH] = 0.5% (v/v), V = 50 mL, flowrate = 25 mL min−1. | |
Removal of iron and recovery of zinc
In order to recover a pure Zn precipitate from the solution after the ion flotation stage, it was important to first remove iron. Several researchers have investigated the precipitation of iron from chloride media either as ferric hydroxide or oxide. Iron can be recovered as hematite (Fe2O3) after heating the solution to temperatures above 80 °C for reaction times up to 3 h, provided the addition of a sufficient amount of Fe2O3 seeds. The removal of Fe as Fe2O3 is perhaps the most preferential technology because it produces a high-density Fe-rich precipitate with market value (i.e. cement industries) without the generation of sludge phases, in contrast to hydroxide precipitation.62,63 Nonetheless, the formation of Fe2O3 is hindered by the HCl concentration. Previous studies have shown that increasing the HCl concentration above 0.15 mol L−1 resulted in very poor precipitation efficiencies due to the dissolution of Fe2O3 seeds.
For this reason, Fe was removed from the examined solution by slowly adding NaOH. This was expected to precipitate out Fe as its hydroxide when the pH of the solution was close to 4. As shown in Fig. 9, Fe was completely removed at pH = 3.7. A further increase of the pH resulted in co-precipitation of Zn, and pH = 3.7 was considered the optimum value. Interestingly, the generated precipitate (Fig. S15†) had very good filtration properties and the XRD analysis (Fig. 10) revealed that it was mainly composed of halite phases (NaCl). The goethite phase (FeO(OH)) could be observed in the XRD diffractogram as broad peaks, indicating its presence as an amorphous phase. The high chloride concentration (∼6 mol L−1) and the addition of excess Na was probably beneficial for the formation of NaCl phases.
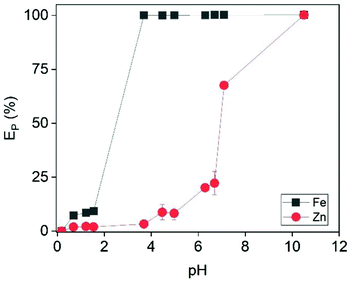 |
| | Fig. 9 Effect of pH on the precipitation efficiency of Fe and Zn. Conditions: [Zn]i = 22 mmol L−1, [Fe]i = 500 mmol L−1. | |
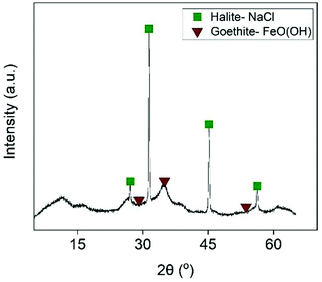 |
| | Fig. 10 X-ray diffractogram of the iron-rich precipitate. | |
The addition of 110% of the stoichiometric amount of sodium sulfide in the iron-free solution precipitated 100% of Zn. The generated precipitate (Fig. S16†) was dissolved in HCl and no other metals were detected by ICP, indicating a high purity Zn precipitate.64 Additionally, in the chemical composition of the final solution no Zn content was detected (Table S3†).
Conclusions
In this work the, recovery of copper, lead and zinc from a photovoltaic panel solid residue was investigated. The PVP residue was first leached in a microwave oven at 80 °C with a mixture of HCl, NaCl and H2O2 solutions. The regression analysis of the 43 Box–Behnken design showed that the H2O2 concentration was the most significant parameter for the leaching of copper and zinc, while the NaCl concentration was for lead leaching. According to the statistical model and the experimental results, the best leaching efficiencies for Cu (81.2%), Zn (96.4%) and Pb (77.6%) were obtained under the following conditions: [HCl] = 0.5 mol L−1, [NaCl] = 200 g L−1, [H2O2] = 7.5 wt% and t = 60 min. Although the plethora of different types of PVP panels, they have similar chemical and mineralogical composition. Hence, the same leaching strategy, i.e. a microwave-assisted leaching in oxidative mixtures of hydrochloric acid, sodium chloride and hydrogen peroxide, is considered as universal, as high leaching yields of Cu, Zn and Pb are expected after leaching optimization. Copper was quantitatively recovered from the PLS as copper–iron sediment, after adding iron powder at Fe/Cu = 1.2 molar ratio. In the copper-free PLS, lead (99.4%) was selectively recovered over zinc by ion flotation, with the cationic surfactant CTAB, as a (CTA)2[PbCl4] colloid, after eight ion flotation stages and [CTAB]total = 7.2 mmol L−1. Lead was selectively adsorbed to the gas–liquid interface, probably due to the valence difference of PbCl42− and ZnCl3− complexes. The zinc that remained in the solution after the ion flotation step was recovered by precipitation and by adding sodium sulfide at 110% of the stoichiometric amount, after removing iron by slowly raising the pH to 3.7 by adding NaOH. The overall recovery rates of Cu, Zn and Pb from the examined material were 81.2%, 96.4% and 77.1%, respectively. The results were found to be very promising for the recovery of copper, zinc and lead from end of life products such as PVPs.
Author contributions
Panagiotis Xanthopoulos: conceptualization, methodology, formal analysis, investigation, writing – original draft, visualization. Srećko Bevandić: conceptualization, methodology, formal analysis, investigation, writing – review & editing. Jeroen Spooren: conceptualization, formal analysis, writing – original draft, writing – review & editing, supervision, project administration, funding acquisition. Koen Binnemans: conceptualization, formal analysis, writing – original draft, writing – review & editing, supervision, project administration, funding acquisition. Frantisek Kukurugya: conceptualization, investigation, data curation, writing – review & editing.
Conflicts of interest
There are no conflicts to declare.
Acknowledgements
The research leading to these results has received funding from the European Union's EU Framework Programme for Research and Innovation Horizon 2020 Programmes under Grant Agreements No. 812580 (SULTAN) and No. 958302 (PEACOC). The authors thank Wendy Wouters (VITO) for her precious experimental support.
References
- Snapshot of Global of Global PV Markets, https://iea-pvps.org/snapshot-reports/snapshot-2021/, accessed November 2021 Search PubMed.
- W. S. Chen, Y. J. Chen, C. H. Lee, Y. J. Cheng, Y. A. Chen, F. W. Liu, Y. C. Wang and Y. L. Chueh, Processes, 2021, 9, 1–16 Search PubMed
 .
. - M. S. Chowdhury, K. S. Rahman, T. Chowdhury, N. Nuthammachot, K. Techato, M. Akhtaruzzaman, S. K. Tiong, K. Sopian and N. Amin, Energy Strategy Rev., 2020, 27, 100431 CrossRef
 .
. - J. Tao and S. Yu, Sol. Energy Mater. Sol. Cells, 2015, 141, 108–124 CrossRef CAS
 .
. - P. Dias, S. Javimczik, M. Benevit, H. Veit and A. M. Bernardes, Waste Manage., 2016, 57, 220–225 CrossRef CAS PubMed
 .
. - J. K. Lee, J. S. Lee, Y. S. Ahn and G. H. Kang, Sustainability, 2019, 11, 3659 CrossRef CAS
 .
. - E. H. Yang, J. K. Lee, J. S. Lee, Y. S. Ahn, G. H. Kang and C. H. Cho, Hydrometallurgy, 2017, 167, 129–133 CrossRef CAS
 .
. - G. A. Heath, T. J. Silverman, M. Kempe, M. Deceglie, D. Ravikumar, T. Remo, H. Cui, P. Sinha, C. Libby, S. Shaw, K. Komoto, K. Wambach, E. Butler, T. Barnes and A. Wade, Nat. Energy, 2020, 5, 502–510 CrossRef CAS
 .
. - F. C. S. M. Padoan, P. Altimari and F. Pagnanelli, Sol. Energy, 2019, 177, 746–761 CrossRef
 .
. - G. Zante and M. Boltoeva, Sustainable Chem., 2020, 1, 238–255 CrossRef
 .
. - J. Park, Y. Jung, P. Kusumah, J. Lee, K. Kwon and C. K. Lee, Int. J. Mol. Sci., 2014, 15, 15320–15343 CrossRef PubMed
 .
. - B. Bahram and M. Javad, Res. J. Chem. Environ., 2011, 15, 1–8 Search PubMed
 .
. - T. Chmielewski, K. Gibas, K. Borowski, Z. Adamski, B. Wozniak and A. Muszer, Physicochem. Probl. Miner. Process., 2017, 53, 893–907 CAS
 .
. - C. Lei, B. Yan, T. Chen, X. L. Wang and X. M. Xiao, J. Cleaner Prod., 2018, 181, 408–415 CrossRef CAS
 .
. - R. Winand, Hydrometallurgy, 1991, 27, 285–316 CrossRef CAS
 .
. - S. Guy and C. P. Broadbent, Hydrometallurgy, 1983, 10, 243–255 CrossRef CAS
 .
. - R. Lommelen, T. Vander Hoogerstraete, B. Onghena, I. Billard and K. Binnemans, Inorg. Chem., 2019, 58, 12289–12301 CrossRef CAS PubMed
 .
. - M. Al-Harahsheh and S. W. Kingman, Hydrometallurgy, 2004, 73, 189–203 CrossRef CAS
 .
. - M. Lovás, I. Murová, A. Mockovciaková, N. Rowson and Š. Jakabský, Sep. Purif. Technol., 2003, 31, 291–299 CrossRef
 .
. - M. Al-Harahsheh and S. Kingman, Chem. Eng. Process., 2007, 46, 883–888 CrossRef CAS
 .
. - T. Abo Atia and J. Spooren, Chem. Eng. Process., 2021, 164, 108378 CrossRef CAS
 .
. - T. Abo Atia, W. Wouters, G. Monforte and J. Spooren, Resour., Conserv. Recycl., 2021, 166, 105349 CrossRef
 .
. - T. Abo Atia and J. Spooren, J. Hazard. Mater., 2020, 398, 122814 CrossRef CAS PubMed
 .
. - J. Szymanowski, J. Radioanal. Nucl. Chem., 1996, 208, 183–194 CrossRef CAS
 .
. - W. Djoudi, F. Aissani-Benissad and S. Bourouina-Bacha, Chem. Eng. J., 2007, 133, 1–6 CrossRef CAS
 .
. - T. N. Lung, Hydrometallurgy, 1986, 17, 113–129 CrossRef CAS
 .
. - T. Stefanowicz, M. Osińska and S. Napieralska-Zagozda, Hydrometallurgy, 1997, 47, 69–90 CrossRef CAS
 .
. - G. Crini and E. Lichtfouse, Environ. Chem. Lett., 2019, 17, 145–155 CrossRef CAS
 .
. - F. Sebba, Nature, 1959, 184, 1062–1063 CrossRef CAS
 .
. - F. M. Doyle, Int. J. Miner. Process., 2003, 72, 387–399 CrossRef CAS
 .
. - L. Chang, Y. Cao, G. Fan, C. Li and W. Peng, RSC Adv., 2019, 9, 20226–20239 RSC
 .
. - W. Peng, L. Chang, P. Li, G. Han, Y. Huang and Y. Cao, J. Mol. Liq., 2019, 286, 110955 CrossRef CAS
 .
. - C. Mcdonald and A. Suleiman, Sep. Sci. Technol., 1979, 14, 219–225 CrossRef CAS
 .
. - F. M. Doyle and Z. Liu, J. Colloid Interface Sci., 2003, 258, 396–403 CrossRef CAS PubMed
 .
. - Z. Liu and F. M. Doyle, Langmuir, 2009, 25, 8927–8934 CrossRef CAS PubMed
 .
. - F. S. Hoseinian, B. Rezai, E. Kowsari and M. Safari, Miner. Eng., 2018, 119, 212–221 CrossRef CAS
 .
. - M. Ulewicz, W. Walkowiak, Y. Jang, J. S. Kim and R. A. Bartsch, Anal. Chem., 2003, 75, 2276–2279 CrossRef CAS PubMed
 .
. - L. H. V. Thanh and J. C. Liu, Colloids Surf., A, 2021, 616, 126326 CrossRef CAS
 .
. - X. C. He, Talanta, 1991, 38, 319–323 CrossRef CAS PubMed
 .
. - C. Micheau, O. Diat and P. Bauduin, J. Mol. Liq., 2018, 253, 217–227 CrossRef CAS
 .
. - A. Eivazihollagh, J. Tejera, I. Svanedal, H. Edlund, A. Blanco and M. Norgren, Ind. Eng. Chem. Res., 2017, 56, 10605–10614 CrossRef CAS
 .
. - P. Xanthopoulos and K. Binnemans, J. Sustain. Metall., 2021, 7, 78–86 CrossRef
 .
. - P. Xanthopoulos and K. Binnemans, J. Sustain. Metall., 2021, 7, 1565–1574 CrossRef
 .
. - A. Masuyama, T. Okano, M. Okahara and E. Section, Ind. Eng. Chem. Res., 1990, 29, 290–294 CrossRef CAS
 .
. - A. Eivazihollagh, J. Bäckström, M. Norgren and H. Edlund, J. Chem. Technol. Biotechnol., 2018, 93, 1421–1431 CrossRef CAS
 .
. - A. A. Mohammed, S. E. Ebrahim and A. I. Alwared, J. Chem., 2013, 2013, 1–6 CrossRef
 .
. - A. J. Rubin and W. L. Lapp, Anal. Chem., 1969, 41, 1133–1135 CrossRef CAS
 .
. - M. Taseidifar, F. Makavipour, R. M. Pashley and A. F. M. M. Rahman, Environ. Technol. Innovation, 2017, 8, 182–190 CrossRef
 .
. - G. A. Stalidis, K. A. Matis and N. K. Lazaridis, Sep. Sci. Technol., 1989, 24, 97–109 CrossRef CAS
 .
. - P. Xanthopoulos, D. Kalebić, N. Kamariah, J. Bussé, W. Dehaen, J. Spooren and K. Binnemans, J. Sustain. Metall., 2021, 7, 1552–1564 CrossRef
 .
. - J. Środoń, V. A. Drits, D. K. Mccarty, J. C. C. Hsieh and D. D. Eberl, Clays Clay Miner., 2001, 49, 514–528 CrossRef
 .
. - S. L. C. Ferreira, R. E. Bruns, H. S. Ferreira, G. D. Matos, J. M. David, G. C. Brandão, E. G. P. da Silva, L. A. Portugal, P. S. dos Reis, A. S. Souza and W. N. L. dos Santos, Anal. Chim. Acta, 2007, 597, 179–186 CrossRef CAS PubMed
 .
. - S. Guha, J. Yang and A. Banerjee, Prog. Photovoltaics, 2000, 8, 141–150 CAS
 .
. - C. Latunussa, L. Mancini, G. Blengini, F. Ardente and D. Pennington, Analysis of material recovery from silicon photovoltaic panels, Publications Office of the European Union, Luxemburg, 2016 Search PubMed
 .
. - Y. Y. Bang, N. J. Hong, D. Sung Lee and S. R. Lim, Int. J. Green Energy, 2018, 15, 550–557 CrossRef
 .
. - B. Ratner and J. Targeting, Meas. Anal. Mark., 2009, 17, 139–142 Search PubMed
 .
. - K. Kubota and S. Hayashi, Can. J. Chem. Eng., 1977, 55, 286–292 CrossRef CAS
 .
. - C. Walling, E. E. Ruff and J. L. Thorton, J. Phys. Chem., 1957, 61, 486–489 CrossRef CAS
 .
. - R. Lemlich, Adsorptive bubble separation techniques, Elsevier, Amsterdam, 2012 Search PubMed
 .
. - J. D. Morgan, D. H. Napper, G. G. Warr and S. K. Nicol, Langmuir, 1994, 10, 797–801 CrossRef CAS
 .
. - A. S. Bisht, Commercial Surfactants for Remediation, Springer Nature, Singapore, 2018 Search PubMed
 .
. - B. Cohen, D. S. Shipley, A. R. Tong, S. J. G. Casaroli and J. G. Petrie, Miner. Eng., 2005, 18, 1344–1347 CrossRef CAS
 .
. - P. A. Riveros and J. E. Dutrizac, Hydrometallurgy, 1997, 46, 85–104 CrossRef CAS
 .
. - N. Rodriguez Rodriguez, L. Gijsemans, J. Bussé, J. Roosen, M. A. R. Önal, V. Masaguer Torres, Á. Manjón Fernández, P. T. Jones and K. Binnemans, J. Sustain. Metall., 2020, 6, 680–690 CrossRef
 .
.
Footnote |
| † Electronic supplementary information (ESI) available: Responses' table of Box–Behnken design, interaction plots and regression analysis of DoE. Eh–pH diagrams of Cu, Zn and Pb, stereo microscopic pictures of starting material, chemical composition of solid residue and final solution, and pictures of the iron precipitate, zinc precipitate and Pb sublate. See DOI: 10.1039/d1ra09268e |
|
| This journal is © The Royal Society of Chemistry 2022 |
 Open Access Article
 a,
Srećko Bevandićb,
Jeroen Spooren
 c,
Koen Binnemans
 *a and
Frantisek Kukurugya
 *c
*c


.
.
.
.
.
.
.
.
.
.
.
.
.
.
.
.
.
.
.
.
.
.
.
.
.
.
.
.
.
.
.
.
.
.
.
.
.
.
.
.
.
.
.
.
.
.
.
.
.
.
.
.
.
.
.
.
.
.
.
.
.
.
.


