 Open Access Article
Kinetics study of dyeing bicomponent polyester textiles (PET/PTT) using environmentally friendly carriers
Marwa Souissi *ab,
Ramzi Khiariac,
Mohamed Abdelwaheba,
Mounir Zaagd,
Nizar Meksiab and
Hatem Dhaouadia
aUniversity of Monastir, Laboratory of Environmental Chemistry and Cleaner Process (LCE2P- LR21ES04), 5019 Monastir, Tunisia. E-mail: souissi.marwa20@yahoo.com
bUniversity of Monastir, National Engineering School of Monastir, 5019 Monastir, Tunisia
cHigher Institute of Technological Studies (ISET) of Ksar-Hellal, 5070 Ksar-Hellal, Tunisia
dSociété Industrielle des Textiles (SITEX), 5070 Ksar-Hellal, Tunisia
First published on 17th January 2022
Abstract
The biobased carriers o-vanillin, p-vanillin, and coumarin, can be used to dye poly(ethylene terephthalate)/poly(trimethylene terephthalate) (PET/PTT) bicomponent filaments at low temperature without affecting their excellent elasticity and elastic recovery. These ecological carriers, which are free from any toxic product, present an effective solution for obtaining an ecological and economical dyeing process. This paper presents a study of the effects of the kinetics when dyeing bicomponent (PET/PTT) filaments with three disperse dyes having different molecular weights at 100 °C (upon adding ecological carriers) and at a high temperature (130 °C). The physicochemical characterization of bicomponent filaments was done using several techniques, such as SEM, BET and DSC, before carrying out a modelling study. Different models (pseudo first-order, pseudo second-order, Elovich, and intra-particle diffusion models) were used to identify an acceptable dyeing mechanism. The dyeing rate constants, the half dyeing times, and the rise time coefficients were then determined and analyzed. The results of this work explain the adsorption mechanism during the dyeing process of bicomponent (PET/PTT) filaments using ecological carriers and provide an experimental foundation for future research.
1. Introduction
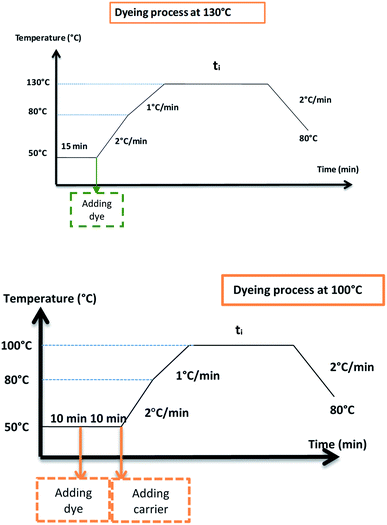
Bicomponent polyester filaments are used more and more in the textile sector. They are particularly used in sportswear, swimsuits, and so on, giving good levels of comfort,1,2 soft touch, good mechanical properties3,4 and excellent elastic recovery.5,6 However, being very crystalline, polyester filaments absorb very little water and hardly swell, which considerably limits the penetration and migration of dye molecules.7 Only disperse dyes are used for dyeing polyester. In this case, dyeing can be done either at a high temperature of 130 °C or by adding carriers if the dyeing temperature does not exceed 100 °C.8,9Indeed, dyeing polyester filaments in a full bath at a high temperature is efficient and does not require the addition of chemical products. However, this dyeing process seems not to be economical in terms of energy, and does not allow dyeing of mixtures (polyester and other components). In this last case (dyeing of mixtures), it is not easy to carry out the dyeing and it requires the use of a specific device such as an autoclave.
Likewise, full bath dyeing at 100 °C requires the use of carriers. These agents break the internal structure of the polyester filaments which allows the disperse dye to penetrate the interior of the fiber quicker.10 The carriers giving the best results are generally based on halogenated aromatic hydrocarbons and o-phenylphenol. They present, overall, a low solubility in water and disperse as small droplets in the dye bath.7,10 The most used are butyl benzoate, methylnaphthalene, dichlorobenzene, diphenyl, o-phenylphenol, and so on.8,11 Despite their effects in speeding up the dye rate when added to the dye bath, these conventional carriers have inherent drawbacks and dangers such as toxicity, a foul odor, and vapor volatility.11
In a previous study, the feasibility of dyeing bicomponent polyester filaments with disperse dyes using bio-based carriers namely: o-vanillin, p-vanillin and coumarin have been studied and proved to improve the dying performance.12 This seems to be the ideal solution because this new dyeing process avoids all the environmental and health problems caused by the use of conventional carriers, as well as the drawbacks relating to the high temperature in dyeing process (without a carrier).11,12
Although dyeing polyester with disperse dyes seems to consist of a simple process of transferring the dye from the solution to the interior of the fiber, the dyeing mechanism is much more complex. There are some factors must be considered such as the state of the dye in the bath, the influence of the dyeing aids, the possible changes in fiber structure during dyeing, and the nature of the interaction forces between dye and carrier, and so on. Various theories have been advanced to explain the action of the mechanism of carriers in the dyeing process. Some researchers suggest that there is the formation of a loose complex between the dye and the carrier, and that this complex will go more easily into the fiber than the dye molecules alone. However, the absence of various carriers of groups that can act in this way, as well as the spectrophotometric analysis of the dye-carrier systems tend to refute this theory.13 Other researchers have found that the carrier action resulting in an increase in the water solubility of the dye, and therefore an increase in the rate of dyeing, was then suggested.14 Another hypothesis about the carrier action is the possible formation of a carrier layer on the surface of the fiber, a layer rich in dye, and from which the dyeing takes place.15 Some studies have tried to relate the rise of the carrier on the substrate, to an increase in the water impregnation of the hydrophobic fibers, thus creating a medium which accepts the partially soluble disperse dye.16,17 The various studies carried out previously demonstrate that the mechanisms of action of the carriers results in a modification of the microstructure of the fiber. A progressive decrease in the glass transition temperature (Tg) was observed as the quantity of carrier is increased.18
Several researchers have studied the kinetics of dyeing 100% PET filaments and this led to several findings and theories. However, no recent research has been focused on the kinetics of dyeing bicomponent polyester filaments with disperse dyes, using both high temperature processes or using a carrier. This research is devoted to the study of the dyeing kinetics of poly(ethylene terephthalate)/poly(trimethylene terephthalate) (PET/PTT) bicomponent filaments using two different processes: dyeing at 100 °C with the use of ecological carriers, and dyeing at 130 °C without carriers. Four models were applied to determine a suitable dyeing mechanism. The results obtained provide a theoretical basis for dyeing bicomponent (PET/PTT) filaments.
2. Materials and methods
2.1. Reagents
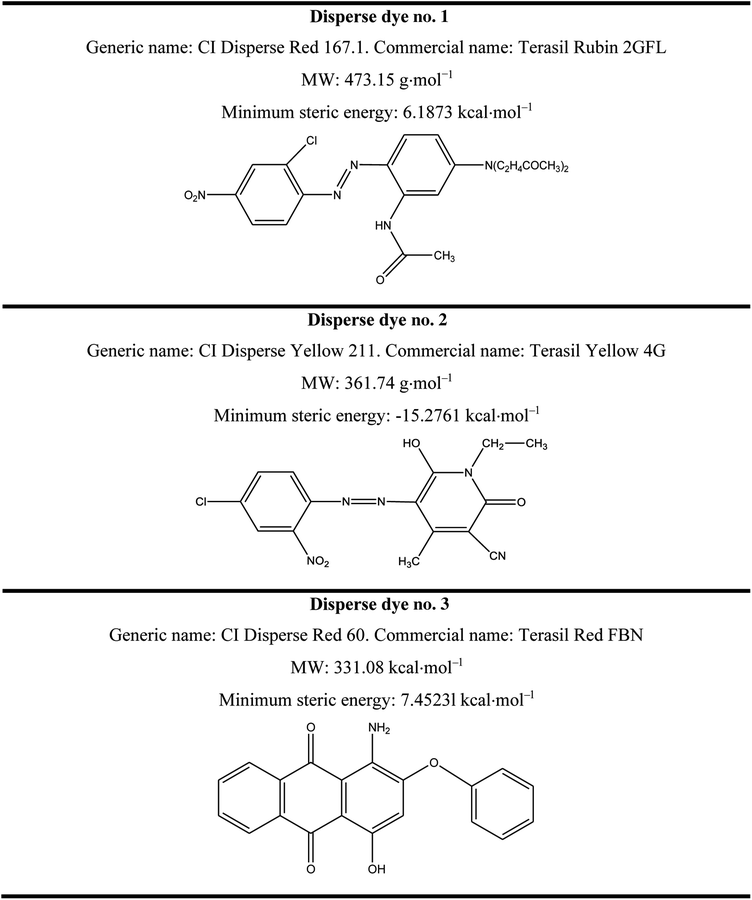
Three disperse dyes were investigated in this study: CI Disperse Red 60, CI Disperse Yellow 211 and CI Disperse Red 167.1, which had three different molecular weights: low, medium and high, respectively. They were purchased from the Huntsman Company (Basel, Switzerland). Their chemical characteristics are presented in Table 1.Sodium bicarbonate (NaHCO3, CAS no. 144-55-8, Lot no. S5761), sodium hydroxide (NaOH, CAS no. 1310-73-2, Lot no. S5881) and sodium hydrosulfite (Na2S2O4, CAS no. 7775-14-6, Lot no. 157953) were procured from Sigma-Aldrich and were used without any purification steps.
2.2. Bicomponent (PET/PTT) filaments
The bicomponent filaments used during this study were composed of 60% PET and 40% PTT filaments placed side by side. These multifilament yarns had a linear density of 83 dtex and contained 64 filaments per yarn.2.3. Experimental methods
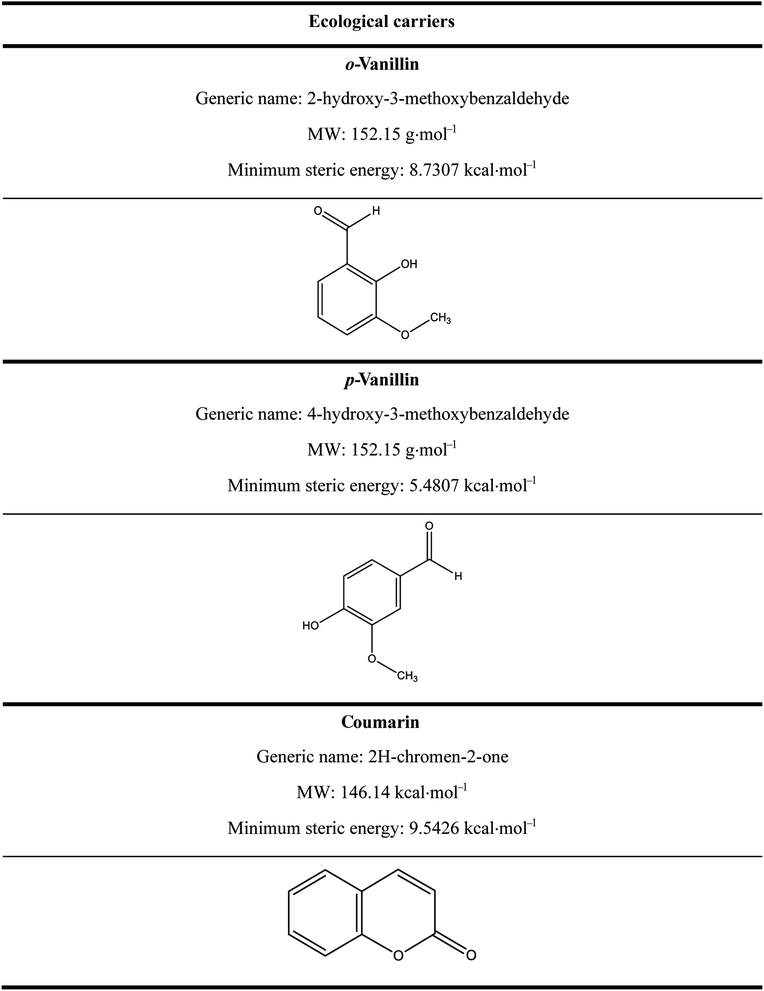
Three ecological carriers were used in this study: o-vanillin, p-vanillin and coumarin. Their chemical structures are illustrated in Table 2. After dyeing, the samples were post-treated at 50 °C for 10 min using 2 mL L−1 of NaOH solution (36°Be) and 2 g L−1 of Na2S2O4 before the analysis and characterization.
All the pretreatments, dyeing and post-treatments were carried out in an Ahiba Nuance pressure autoclave (Datacolor, USA). For dyeing, the liquor-to-fiber ratio was 10![[thin space (1/6-em)]](https://www.rsc.org/images/entities/char_2009.gif) :
:![[thin space (1/6-em)]](https://www.rsc.org/images/entities/char_2009.gif) 1.
1.
- Scanning electron microscopy (SEM, Hitachi S-2360, Japan) was used to determine the morphology of the bicomponent (PET/PTT) filaments.
- Differential scanning calorimetry (DSC, Mettler Instrument with STARe SW 9.20 thermal analysis software) was carried out. The sample (10 mg) was heated from 0 °C to 300 °C with a heating rate of 10 °C min−1. Each test was carried out at least three times.
- The characterization of the bicomponent (PET/PTT) filaments and conventional PET filaments were carried out by N2 physical adsorption at −196 °C (Micromeritics, TriStar 3000, Norcross, GA, USA). Before measurement, the samples underwent degassing for 2 h at 100 °C to remove any contaminants which may have been adsorbed onto the surface or pores of the samples. The Brunauer–Emmett–Teller (BET) equation was used to estimate the apparent surface area, using the N2 adsorption isotherms at −196 °C. This equation was valid in the range of the relative pressure P/P0 between 0.18 to 0.28 m2 g−1 and 0.16 to 0.23 m2 g−1 for the bicomponent (PET/PTT) filaments and conventional (PET) filaments, respectively.
All the analysis conditions were reported in more detail in our previous studies.3,19,20
| A = ε × C × l | (1) |
In the experimental part, if the value ε for a substance is known, under given conditions, the concentration of a solution can be deduced by measuring the corresponding absorbance.
 | (2) |
 | (3) |
| Model | Equation | Modeling |
|---|---|---|
| a Where: qe (mg g−1) is the adsorption capacity at equilibrium, qt (mg g−1) is the adsorption capacity at time t, K1 (min−1) is the pseudo first-order rate constant, K2 (g mg−1 min−1) is the pseudo second-order rate constant, α (mg g−1 min−1) is the Elovich constant, which represents the initial sorption rate, β (mg g−1 min−1) is the Elovich constant, which represents the extent of surface coverage, Kint (mg g−1 min−1) is the intra-particle diffusion rate constant. | ||
| Pseudo first-order |  |
 |
| Pseudo second-order |  |
 |
| Elovich |  |
 |
| Intra-particle diffusion |  |
 |
| Model | Equation |
|---|---|
| a Where: Cf (mg g−1) is the quantity of dye absorbed on the absorbent, Ce (mg L−1) is the dye concentration at equilibrium, KN (mg g−1) is the Nernst constant, which represents the maximum amount of dye adsorbed on a unit weight of fiber, Cmax (mg g−1) is the Langmuir constant, which represents the maximum amount of dye absorbed per unit weight of fiber, KL (L mg−1) is the Langmuir constant related to the affinity of the binding sites, KF (L mg−1) is the Freundlich constant, which represents the adsorption capacity, n is the Freundlich constant, which represents the adsorption intensity. | |
| Nernst | Cf = CeKN |
| Freundlich | Cf = KFCe1/n |
| Langmuir |  |
3. Results and discussion
3.1. Physicochemical characterization of bicomponent (PET/PTT) filaments using SEM, BET, and DSC
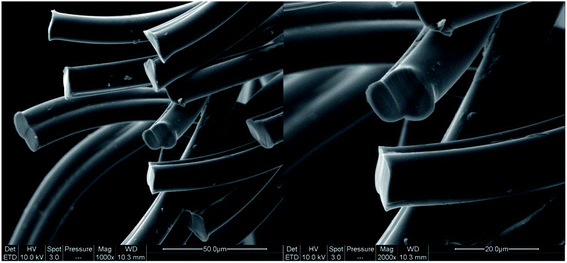
The dyeing kinetics were influenced by several physicochemical factors particularly the nature of the dye, the bath ratio, the aqueous medium, and especially by the textile material to be dyed (chemical composition, radius and external surface, specific surface and free volume). Dyeing bicomponent (PET/PTT) filaments differs from dyeing conventional polyester filaments. Indeed, the bicomponent filaments studied contained 60% PET and 40% PTT extruded side by side from a special spinneret as shown in Fig. 2. Their adsorption surface was greater than that of conventional polyester filaments made with 100% PET.The specific area of the bicomponent (PET/PTT) filaments, determined using the BET specific area measurement, was 0.3244 m2 g−1 with an average particle size of 0.0185 mm. This value seemed to be important when it was compared to the conventional polyester which was found to have values of 0.2313 m2 g−1 and 0.0259 mm for specific area and average particle size, respectively. This proved that the dyeing of bicomponent (PET/PTT) filaments had higher dyeing yields than those obtained for conventional polyester filaments. This was due to their larger external surface and their amorphous zone, which were much larger, because of the configuration of PTT which had a more flexible trimethylene sequence and a trans-left–left-trans conformation. Likewise, the crystalline percentage of the bicomponent filaments was about 60% which was much lower than that of conventional polyester which reached up to 80%. These deductions and others were reported in our previous studies.3,19,20
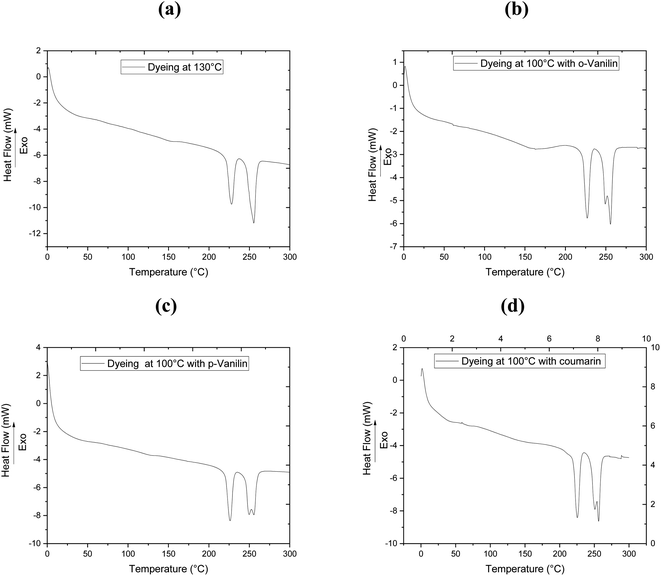
To clarify the effect of the different dyeing processes on the thermal properties of the filaments studied, DSC analysis was carried out after dyeing the bicomponent filaments with CI Disperse Red 167.1 at 130 °C without carriers, and at 100 °C by incorporating 0.08 mol L−1 of the three carriers (o-vanillin, p-vanillin and coumarin). The results obtained from the DSC determination are presented in Fig. 3 and Table 5. The existence of two melting temperatures (Tm) can be seen at about 226 °C and 248 °C, and these values corresponded to the Tm of PTT and PET, respectively. As shown in Table 4, the bicomponent (PET/PTT) filaments before dyeing had Tg values of 37 °C (PTT) and 62 °C (PET).
| Dyeing process | Tg (PTT) (°C) | Tg (PET) (°C) | Tm (PTT) (°C) | Tm (PET) (°C) |
|---|---|---|---|---|
| Before dyeing | 37 | 62 | 222 | 248 |
| After dyeing at 130 °C | — | 60 | 226 | 255 |
| After dyeing at 100 °C with o-vanillin | — | 61 | 226 | 255 |
| After dyeing at 100 °C with p-vanillin | 36 | 59 | 225 | 255 |
| After dyeing at 100 °C with coumarin | 33 | 50 | 226 | 255 |
After dyeing at 130 °C, a microstructural modification of the bicomponent filament was observed: the Tg of PET showed a slight decrease (Tg = 60 °C) whereas that of PTT was camouflaged. Both Tm increased slightly and reached values of 226 °C and 255 °C for PTT and PET, respectively.
However, adding ecological carriers to the dye bath made it possible to slightly reduce the Tg values of the bicomponent filaments to 61, 59 and 50 °C, by adding 0.08 mol L−1 of the carriers o-vanillin, p-vanillin and coumarin, respectively. Thus, predictions can be made about changes in the microstructures of polyester filaments during their dyeing at low temperature upon adding carriers.18
3.2. Extinction coefficients of the dyes studied
The kinetics of the dye correspond to the determination of the concentration of dye in the bath over time. The molar extinction coefficient of the Beer–Lambert law allows the relationship of the absorbance of the solution to the corresponding dye concentration to be calculated. For this, the absorbance of solutions containing different concentrations of dyes studied was measured at maximum wavelength values. i.e., 524, 452 and 492 nm for CI Disperse Red 60, CI Disperse Yellow 211, and CI Disperse Red 167.1, respectively.Fig. 4a shows examples of the absorption spectra of the dyes studied, with a concentration of 1.2 g L−1, and Fig. 4b shows the Beer–Lambert law plots of the dyes.
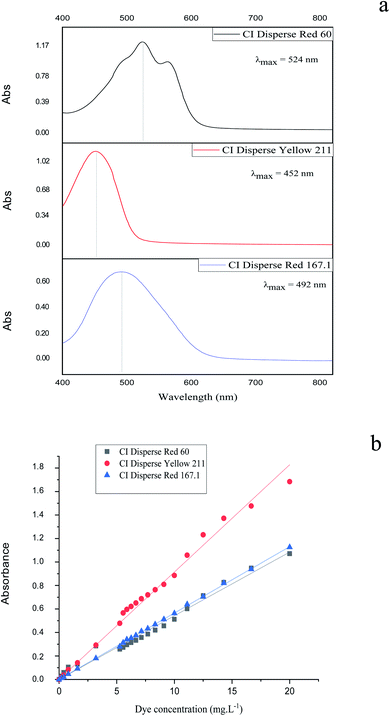 | ||
| Fig. 4 (a) Absorption spectra of the studied dyes (concentration = 1.2 g L−1) and (b) Beer–Lambert law plots of the dyes. | ||
Table 6 shows the extinction coefficients for dyes studied and their relative correlation coefficients. It is important to note that the CI Disperse Yellow 211 had a higher extinction coefficient than the CI Disperse Red 60 and CI Disperse Red 167.1.
| Dye | λmax (nm) | ε (L mg−1 cm−1) | R2 |
|---|---|---|---|
| CI Disperse Red 60 | 524 | 0.0542 | 0.9926 |
| CI Disperse Yellow 211 | 452 | 0.0914 | 0.9962 |
| CI Disperse Red 167.1 | 492 | 0.0565 | 0.9998 |
3.3. Determination of the exhaustion rates
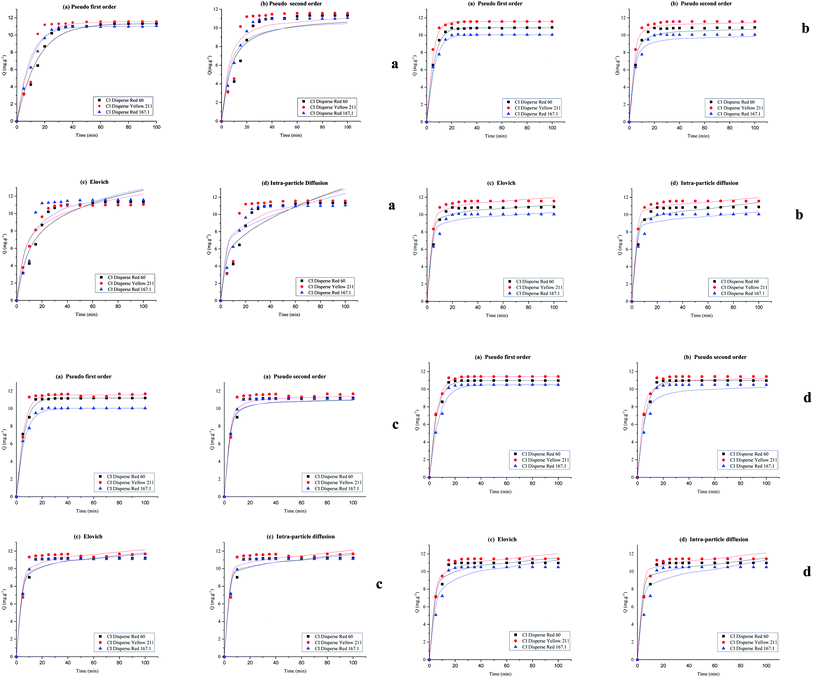
To study the dyeing kinetics of the bicomponent filaments using the two different processes (dyeing at 130 °C without carriers, and at 100 °C by adding ecofriendly carriers), the exhaustion (%) of the dye bath was measured at various times during the dyeing process (5, 10, 15, 20, 25, 30, 35, 40, 50, 60, 70, 80, 90 and 100 min).Fig. 5 shows the kinetics curves of dyeing bicomponent (PET/PTT) filaments with the dyes studied at 130 °C and at 100 °C, with o-vanillin, p-vanillin and coumarin as carriers. From the results obtained, it can be seen that the shape of the different curves was similar for the two processes tested. However, the dye bath exhaustion became constant faster when dyeing the bicomponent filament using carriers (less than 20 min), whereas with the high temperature process, a time of 30 min was required to obtain maximum values of the dye bath exhaustion.
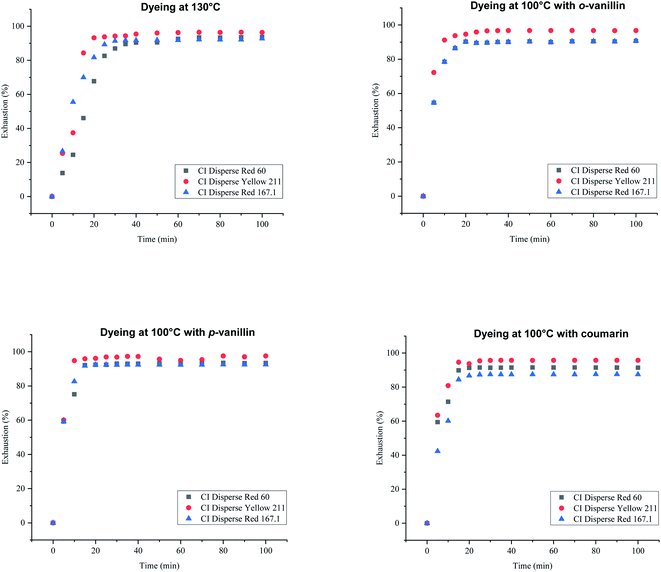 | ||
| Fig. 5 Kinetics curves for dyeing bicomponent (PET/PTT) filaments with dyes at 130 °C (without carriers) and at 100 °C with o-vanillin, p-vanillin, and coumarin. | ||
This confirmed that the carriers increased the rate of adsorption of the dispersed dye by the polyester filaments, and there was better dye migration, than when dyeing at 130 °C. This increase in adsorption rate was due to the improvement in the solubility of the dye in water because of the presence of the carrier, which generated significant kinetics of the dye molecules in the chain segments of the fiber. The maximum values of dye bath exhaustion, the half dyeing time, the rise time and the fixation time of the dyes studied were evaluated and are shown in Table 7. The half-dyeing time (denoted as t½) corresponded to the time taken by the polyester filaments to absorb half of the amount of dye that it will have absorbed when equilibrium is reached. This parameter also allows the comparison of several dyes from the point of view of their rise kinetics on the fibers: the shorter the half-dyeing time is, the faster the dyeing speed is, and therefore, the higher the diffusion coefficient is. The fixation time is the necessary time for the dye to be adsorbed, then diffused and finally fixed into the amorphous zones of the filaments.
| Dyeing process | Dye | Exhaustion (%) | Half-dyeing timea (min) | Rise timeb (min) | Fixation timec (min) |
|---|---|---|---|---|---|
| a The half-dyeing time t½ is the time required to reach 50% of the exhaustion time.b The rise time = 2 × t½.c The fixation time = 4 × t½. | |||||
| Dyeing at 130 °C | CI Disperse Red 60 | 92.86 | 15.89 | 31.78 | 63.56 |
| CI Disperse Yellow 211 | 96.37 | 11.36 | 22.72 | 45.44 | |
| CI Disperse Red167.1 | 92.06 | 9.028 | 18.06 | 36.11 | |
| Dyeing at 100 °C with o-vanillin | CI Disperse Red 60 | 90.45 | 4.32 | 8.64 | 17.28 |
| CI Disperse Yellow 211 | 96.74 | 3.44 | 6.88 | 13.76 | |
| CI Disperse Red 167.1 | 83.69 | 4.39 | 8.78 | 17.56 | |
| Dyeing at 100 °C with p-vanillin | CI Disperse Red 60 | 93.42 | 4.22 | 8.44 | 16.88 |
| CI Disperse Yellow 211 | 96.65 | 4.15 | 8.30 | 16.60 | |
| CI Disperse Red167.1 | 92.46 | 4.21 | 8.42 | 16.84 | |
| Dyeing at 100 °C with coumarin | CI Disperse Red 60 | 91.49 | 6.73 | 13.46 | 26.92 |
| CI Disperse Yellow 211 | 95.73 | 3.93 | 7.86 | 15.72 | |
| CI Disperse Red 167.1 | 87.50 | 3.83 | 7.66 | 15.32 | |
While, observing the results in Table 7, it can be seen that the exhaustion rates of dyeing at equilibrium using the three dyes (low, medium and high energy) had similar values, in the majority higher than 90%, and then the use of ecological carriers, in particular p-vanillin, was efficient and lead to equal dyeing yields being obtained at the high dyeing temperature of 130 °C. From these results (Table 7), it was obvious that the half-dyeing time, the rise time and the fixation time of dyeing bicomponent filaments with the three dyes studied present all lower values when using ecofriendly carriers. So, the dyeing process at 100 °C and using ecological carriers, gave a saving in terms of energy (100 °C instead of 130 °C), and also in terms of dyeing duration (more than 30 min).
3.4. Determination of the adsorption kinetics
To understand the dyeing kinetics, the quantity of dye adsorbed during the dyeing process at time intervals ranging from 5 min to 100 min for the two processes (dyeing at 130 °C without carrier and dyeing at 100 °C using carriers with a concentration of 0.04 mol L−1 of o-vanillin, p-vanillin and coumarin) were determined using eqn (2). The choice to use a carrier concentration of 0.04 mol L−1 was based on previous studies.12 It was proved that this carrier concentration value of 0.04 mol L−1 was sufficient to maximize the color yield (K/S) of the dyed samples and the exhaustion (E (%)) of the dye bath. The reaction kinetics models used to elucidate the adsorption mechanism and to validate the experimental data were: the pseudo first-order, pseudo second-order, Elovich and intra-particle models. By applying the equations of these four models, the curves of the instantaneous adsorbed quantity as a function of the dyeing time were plotted. Fig. 6a–d show the kinetics of the dyeing of the bicomponent (PET/PTT) filaments at 130 °C (without using carriers) and at 100 °C using 0.04 mol L−1 of o-vanillin, p-vanillin and coumarin. By observing the shape of the plotted curves, it was concluded that for the pseudo first-order model, the experimental values were almost similar to the theoretical ones.Table 8 presents the correlation coefficients of the fitting curves of each model as well as the values of the different adsorption constants: the adsorption capacity at equilibrium qe (mg g−1), the pseudo first-order rate constant K1 (min−1), the pseudo second-order rate constant K2 (g mg−1 min−1), the Elovich constant which represents the initial sorption rate α (mg g−1 min−1), the Elovich constant which represents the extent of surface coverage β (mg g−1 min−1), and the intra-particle diffusion rate constant Kint (mg g−1 min−1).
| Dyeing process | Dye | Pseudo first-order model | Pseudo second-order model | Elovich model | Intra-particle diffusion model | ||||||||
|---|---|---|---|---|---|---|---|---|---|---|---|---|---|
| qe (mg g−1) | K1 (min−1) | R2 | qe (mg g−1) | K2 (g mg−1 min−1) | R2 | α (mg g−1 min−1) | β (mg g−1 min−1) | R2 | Kint (mg g−1 min−1) | Cint (mg g−1 min−1) | R2 | ||
| a Where: qe (mg g−1) is the adsorption capacity at equilibrium; K1 (min−1) is the pseudo first-order rate constant; K2 (g mg−1 min−1) is the pseudo second-order rate constant; α (mg g−1 min−1) is the Elovich constant, which represents the initial sorption rate. β (mg g−1 min−1) is the Elovich constant, which represents the extent of surface coverage. Kint (mg g−1 min−1) is the intra-particle diffusion rate constant. | |||||||||||||
| 130 °C | CI Disperse Red 60 | 11.31 | 0.07 | 0.97 | 11.31 | 0.01 | 0.83 | 2.21 | 0.34 | 0.92 | 0.97 | 3.39 | 0.83 |
| CI Disperse Yellow 211 | 11.57 | 0.09 | 0.95 | 11.57 | 0.02 | 0.85 | 4.06 | 0.38 | 0.87 | 0.81 | 5.23 | 0.75 | |
| CI Disperse Red 167.1 | 11.00 | 0.01 | 0.91 | 11.00 | 0.02 | 0.98 | 5.23 | 0.45 | 0.91 | 0.71 | 5.30 | 0.83 | |
| o-Vanillin | CI Disperse Red 60 | 10.85 | 0.19 | 0.99 | 10.85 | 0.05 | 0.96 | 71![[thin space (1/6-em)]](https://www.rsc.org/images/entities/char_2009.gif) 933.06 933.06 |
1.45 | 0.93 | 0.31 | 8.45 | 0.91 |
| CI Disperse Yellow 211 | 11.57 | 0.26 | 0.99 | 11.57 | 0.08 | 0.98 | 71![[thin space (1/6-em)]](https://www.rsc.org/images/entities/char_2009.gif) 933.06 933.06 |
1.33 | 0.97 | 0.23 | 9.83 | 0.95 | |
| CI Disperse Red 167.1 | 10.04 | 0.18 | 0.99 | 11.04 | 0.05 | 0.97 | 911.83 | 0.94 | 0.94 | 0.28 | 9.44 | 0.91 | |
| p-Vanillin | CI Disperse Red 60 | 11.20 | 0.19 | 0.99 | 11.20 | 0.05 | 0.96 | 758.97 | 0.94 | 0.94 | 0.32 | 8.72 | 0.92 |
| CI Disperse Yellow 211 | 11.55 | 0.21 | 0.98 | 11.55 | 0.06 | 0.93 | 3087.19 | 1.03 | 0.91 | 0.28 | 9.44 | 0.89 | |
| CI Disperse Red 167.1 | 10.94 | 0.21 | 0.99 | 11.09 | 0.07 | 0.96 | 3087.19 | 1.08 | 0.94 | 0.26 | 9.06 | 0.91 | |
| Coumarin | CI Disperse Red 60 | 10.98 | 0.19 | 0.99 | 10.98 | 0.05 | 0.95 | 785.55 | 0.96 | 0.94 | 0.31 | 8.57 | 0.91 |
| CI Disperse Yellow 211 | 11.44 | 0.19 | 0.99 | 11.44 | 0.05 | 0.97 | 911.83 | 0.93 | 0.94 | 0.28 | 9.44 | 0.91 | |
| CI Disperse Red 167.1 | 10.50 | 0.14 | 0.99 | 10.50 | 0.04 | 0.90 | 37.32 | 0.68 | 0.89 | 0.44 | 7.10 | 0.84 | |
The results obtained show that the pseudo first-order model presented the most important correlation coefficients so that was the best model for describing the dyeing kinetics of the bicomponent (PET/PTT) filaments with disperse dyes. In this case, the adsorption of the dye by the bicomponent filaments was produced on localized sites without interaction between the adsorbed ions. The maximum adsorption corresponded to a single layer of dye on the surface of the bicomponent filaments. It was noted that the two processes studied at 130 °C (without carriers) or at 100 °C with the addition of the three different carriers, obeyed the same adsorption mechanisms. The reaction speed, which was observed using the value of the pseudo first-order dyeing rate constant (K1), was much greater when dyeing occurred at 100 °C with added ecological carriers.
Moreover, by evaluating the dyeing kinetics at 130 °C, it was evident that the insertion of the low and medium energy dyes (having low and medium molecular weights, respectively) into the fiber was easier than the insertion of the high energy dye (having a high molecular weight). Consequently, as can be seen in Table 8, CI Disperse Red 60 and CI Disperse Yellow 211 dyes have higher values of the dyeing rate constant K1 than the CI Disperse Red 167.1 dye.
For dyeing at 100 °C using o-vanillin, p-vanillin and coumarin, the three disperse dyes studied showed different values of the dyeing rate constant K1. It should be noted that the medium energy dye had the highest dyeing rate constant K1 when compared to that of the low energy dye. This proved that the molecular weight of the dye certainly influenced its adsorption kinetics on the textile support but also its solubility, polarity and ability to create interactions with the carrier which will thus promote its rapid insertion into the fiber.
More importantly, the results show that carrier, p-vanillin was compatible with the three classes of disperse dyes, allowing for a better dyeing rate constant K1 to be obtained even with CI Disperse Red 167.1 which belonged to the high energy class.
It can also be seen that the rate constant (K1) was not similar for each carrier. So, it could be concluded that the chemical structure influenced the adsorption of dye into the polyester fabric, and the distribution of the carrier between water and fiber had a great impact on dyeing performance. It was noted that among the carriers studied, o-vanillin, and p-vanillin were hydrophilic unlike coumarin which was rather hydrophobic.26–28
Based on those results, it was assumed that the action of both hydrophobic and hydrophilic carriers was based on the breaking of the inter-chain forces in the fiber. Indeed, the aromatic part of the hydrophilic carrier molecule had a van der Waals type attraction towards the hydrophobic fiber, and the hydrophilic part of the carrier attracted water molecules. Thus, when the carrier was absorbed by the fiber, it carries with it a certain quantity of water (thanks to the –OH or –NH2 type groups) which made it possible to fix a greater quantity of dye.
There is also a theory which assumes that there is a certain loosening of the compact structure of the fiber, and then the carrier is adsorbed by the fiber in a manner comparable to that of the disperse dyes. As the carriers have smaller molecular sizes than the disperse dyes, they penetrate more easily into the amorphous areas of the fiber by pushing the dye molecules away from the polymer chains. This mechanism facilitated the diffusion of the molecules of the larger dye into the new spaces created.
In addition, as described next, the insertion of the molecules of the three carriers generated a change in the microstructure of the bicomponent (PET/PTT) filaments, and a decrease in the Tg was observed by adding a large amount of 0.08 mol L−1 of o-vanillin, p-vanillin and coumarin. The addition of a high concentration of carrier in the dye bath generated a plasticizing effect resulting in a decrease in Tg and was accompanied by a variation in the mechanical and dyeing properties of the fiber. This effect was more visible with coumarin as carrier because being hydrophobic its insertion in the polyester filaments was rather abrupt and it spread the polymer chains more to let the dye pass. For a more hydrophilic carrier such as o-vanillin and p-vanillin, it reduced the size of the dye molecules and thus promoted their insertion into the polyester. Moreover, this type of carrier does not act on the microstructure of the studied filaments but rather it tended to conserve the mechanical and physical properties of the bicomponent (PET/PTT) filaments which are known to have excellent elasticity and elastic recovery.
3.5. Determination of the adsorption isotherms
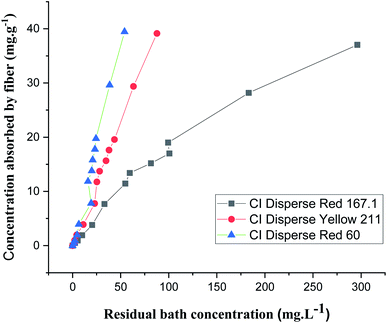
The adsorption isotherms were obtained for each disperse dye at concentrations of 0.05, 0.1, 0.2, 0.4, 0.8, 1.2, 1.4, 1.8, 2, 3, and 4 g L−1. The samples in jersey knits (100% bicomponent (PET/PTT) filaments) were introduced into dye baths preheated to the dyeing temperature which was 130 °C.From Fig. 7, it could be deduced that there was a linear relationship between the concentration of dye absorbed by the fiber and the concentration which persisted in the dye bath for the three types of disperse dyes studied. Nernst's linear model was the best model for describing the adsorption isotherm of the disperse dyes on the bicomponent filaments.
However, it could also be seen that the slopes, which represented the partition coefficients of the three curves showing the isotherms of the three dyes (with different molecular weights), were not similar. In fact, the lower the molecular weight of the dye, the easier its penetration into the bicomponent (PET/PTT) filaments. This resulted in a greater exhaustion of the dye bath and therefore gave a greater partition coefficient.
Based on the Freundlich, Langmuir and Nernst, equations, the nonlinear representations of these models for the three studied dyes were plotted. Fig. 8 shows the results obtained. Table 9 summarizes the obtained adsorption isotherm constants of the Freundlich, Langmuir and Nernst models. The assessment of the suitability of the isotherm models was controlled by the regression coefficient R2.
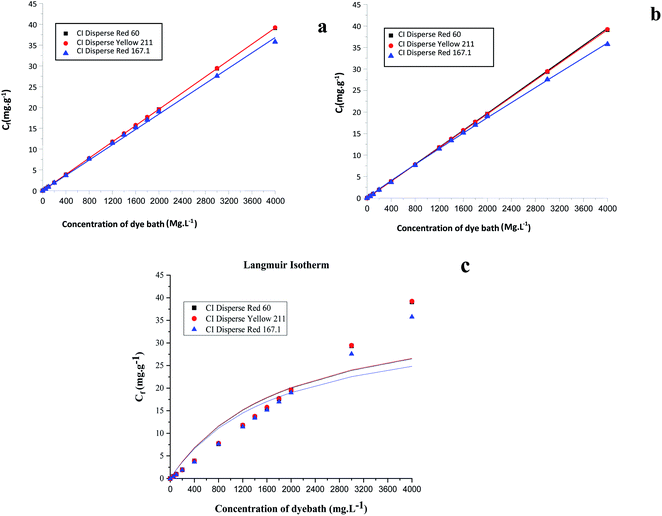 | ||
| Fig. 8 Linear representations of adsorption isotherms: (a) Nernst model, (b) Freundlich model, and (c) Langmuir model. | ||
| Model | Constants | Dyes | ||
|---|---|---|---|---|
| CI Disperse Red 167.1 | CI Disperse Yellow 211 | CI Disperse Red 60 | ||
| Nernst | KN (mg g−1) | 0.0091 | 0.0097 | 0.0097 |
| R2 | 0.9984 | 0.9999 | 0.9999 | |
| Freundlich | n | 0.9999 | 0.9986 | 0.9975 |
| KF (L mg−1) | 0.0138 | 0.0096 | 0.0096 | |
| R2 | 0.9998 | 0.9999 | 0.9997 | |
| Langmuir | Cmax (mg g−1) | 35.7605 | 39.0778 | 39.2224 |
| KL (L mg−1) | 0.0006 | 0.0005 | 0.0005 | |
| R2 | 0.8214 | 0.8018 | 0.8037 | |
By comparing the different models, it should be noted that the evolution of the concentration of the three disperse dyes followed the two linear distribution laws of Nernst and Freundlich. However, the value of the Freundlich exponent (1/n) is very close to 1. The linear equation of the Nernst model is therefore the most suitable. It can be concluded that for dyeing the bicomponent (PET/PTT) filaments with disperse dyes, the adsorption isotherm took the form of the Nernst isotherm which means that there was a linear relationship between the dye concentration in the bath and that in the filament over a wide range of concentrations until the filament is saturated with dye. In addition, by observing the curves of the different models (Fig. 8), it could be noted that the bicomponent (PET/PTT) filaments were not yet saturated with disperse dyes, even at concentrations of 4%. By comparing the results obtained with those found in the literature for the dyeing of 100% PET filaments with disperse dyes, it could be deduced that the bicomponent (PET/PTT) filaments have more amorphous areas and a much larger free volume than a conventional PET. Indeed, according to the study carried out on the isotherms of dyeing PET filaments at 130 °C with CI Disperse Yellow 42 and CI Disperse Orange 3 dyes, it could be concluded that the saturation concentrations of the dyes were lower at 1%.29
4. Conclusions
In this study, bicomponent (PET/PTT) filaments were dyed with different disperse dyes at a dyeing temperature of 100 °C, and with the addition of different ecofriendly carriers. The obtained results showed excellent dyeing yields, similar to those obtained at a dyeing temperature of 130 °C. The dyeing process at 100 °C allows savings in terms of energy and time. The adsorption kinetics were investigated and controlled. The pseudo first-order kinetics model presented good agreement with the kinetics behavior of dyeing bicomponent (PET/PTT) filaments with all types of disperse dyes at a dyeing temperature of 100 °C with the addition of carriers, and at a high temperature of 130 °C without using carriers. In addition, it is found that the hydrophilia of the carriers influences the dyeing mechanism, the microstructure, and the mechanical and physical properties of the dyed filaments. The findings of this work give an experimental foundation for future research and investigations, as they clarify and explain the adsorption mechanism during the dyeing process of bicomponent (PET/PTT) filaments at 100 °C using ecofriendly carriers and/or at 130 °C without carriers.Conflicts of interest
There are no conflicts to declare.Acknowledgements
This project is carried out under the MOBIDOC scheme, funded by the EU through the EMORI program and managed by the ANPR.References
- H. M. Jeong, B. K. Ahn, S. M. Cho and B. K. Kim, J. Polym. Sci., Part B: Polym. Phys., 2000, 38, 3009–3017 CrossRef.
- N. Ozdil and S. Anand, Electronic Journal of Vehicle Technologies, 2014, 8, 68–83 Search PubMed.
- M. Souissi, R. Khiari, M. Zaag, N. Meksi and H. Dhaouadi, Polym. Bull., 2021, 78, 2685–2707 CrossRef.
- P. Bansal, S. Maity and S. K. Sinha, J. Nat. Fibers, 2018, 8, 1184–1198 Search PubMed.
- J. Yang, G. Sidoti, J. Liu, P. H. Geil, C. Y. Li and S. Z. D. Cheng, Polym. J., 2001, 42, 71–81 Search PubMed.
- C. L. Moore and H. A. Bruck, Smart Mater. Struct., 2002, 11, 130–139 CrossRef CAS.
- A. D. Broadbent, Basic Principles of Textile Coloration, Society of Dyers and Colourists, Sherbrooke, 2001 Search PubMed.
- M. A. Tavanaie, A. M. Shoushtari and F. Goharpey, J. Cleaner Prod., 2010, 18, 1866–1871 CrossRef CAS.
- F. J. Carrion Fité, Text. Res. J., 1995, 65, 362–368 CrossRef.
- S. M. Burkinshaw, Chemical Principles of Synthetic Fibre Dyeing, Blackie Academica & Professional, London, 1995 Search PubMed.
- M. A. Iskender, B. Becerir and A. Koruyucu, Text. Res. J., 2005, 75, 462–465 CrossRef CAS.
- M. Souissi, R. Khiari, M. Zaag, N. Meksi and H. Dhaouadi, RSC Adv., 2021, 11, 25830–25840 RSC.
- A. Fern and H. R. Hadfield, J. Soc. Dyers Colour., 1955, 71, 840–856 CAS.
- J. Lindberg, Text. Res. J., 1953, 26, 528 Search PubMed.
- T. Vickerstaff, The physical chemistry of dyeing, Oliver and Boyd, London, 2nd edn, 1955 Search PubMed.
- H. E. Millson, Am. Dyest. Rep., 1955, 44, 417 Search PubMed.
- F. Fortess and V. S. Salvin, Text. Res. J., 1958, 28, 1009–1021 CrossRef CAS.
- W. Ingamells, R. H. Peters and S. R. Thornton, J. Appl. Polym. Sci., 1973, 17, 3733–3746 CrossRef.
- M. Souissi, R. Khiari, W. Haddar, M. Zaag, N. Meksi and H. Dhaouadi, Processes, 2020, 8, 501 CrossRef CAS.
- A. Beer, Ann. Phys. Chem., 1852, 86, 78–88 CrossRef.
- J. H. Lambert, Photometrie: photometria, sive de mensura et gradibusluminis, colorum et umbrae, W. Engelmann, Leipzig, 1760 Search PubMed.
- S. Chaouch, A. Moussa, I. Ben Marzoug and N. Ladhari, J. Text. Inst., 2018, 1–9 Search PubMed.
- Y. S. Ho and G. McKay, Chem. Eng. J., 1998, 70(2), 115–124 CrossRef CAS.
- C. H. Y. Yu, C. H. Wu, T. H. Ho and P. K. Andy Hong, Chem. Eng. J., 2010, 158, 578–583 CrossRef CAS.
- W. J. Weber and J. C. Morris, J. Sanit. Eng. Div., Am. Soc. Civ. Eng., 1963, 89, 31–60 CrossRef.
- E. M. Pearce, Encyclopedia of chemical technology, 3rd edn, vol. 1, J. Polym. Sci., Polym. Lett. Ed., 1978, 16, 248 CrossRef.
- K. N. Venugopala, V. Rashmi and B. Odhav, BioMed Res. Int., 2013, 1–14 Search PubMed.
- S. Radei, F. J. Carrion-Fité, M. Ardanuy and J. M. Canal, Polym. J., 2018, 10, 1–11 Search PubMed.
- S. Dhouib, A. Lallam and F. Sakli, Text. Res. J., 2006, 76, 271–280 CrossRef CAS.
| This journal is © The Royal Society of Chemistry 2022 |

