 Open Access Article
Creative Commons Attribution 3.0 Unported Licence
A conceptual model of northern midlatitude tropospheric ozone†
Charles A.
Mims
*a,
David D.
Parrish
 b,
Richard G.
Derwent
c,
Mohammad
Astaneh
d and
Ian C.
Faloona
d
aDepartment of Chemical Engineering & Applied Chemistry, University of Toronto Ontario, Canada
bDavid D. Parrish, LLC, 4630 MacArthur Ln, Boulder, Colorado, USA
crdscientific, Newbury, Berkshire, UK
dDepartment of Land, Air, & Water Resources, University of California, Davis, California, USA
First published on 6th September 2022
Abstract
A simple compartmental model is used to simulate the average (climatic) annual and seasonal distribution of ozone in the Northern Hemisphere midlatitude troposphere. The model (reminiscent of earlier examples) consists of a circular set of segments – 4 marine and 5 continental – which span the globe. Each segment consists of two well-mixed compartments, one representing the free troposphere overlying one representing the boundary layer. A minimal set of parameters with values taken from generally accepted and measured behavior is used to describe the ozone sources and sinks within the segments and inter-compartmental flow and mixing. The model accurately simulates measured seasonal cycles of ozone throughout the midlatitude troposphere. By virtue of relatively rapid circular zonal flow the model reproduces the observed nearly uniform free troposphere that behaves as a reservoir, responding to the combined boundary layer and stratospheric inputs. The distinctive seasonal cycles of the free troposphere and the marine boundary layer are well reproduced by the strong seasonal dependence of the loss mechanism initiated by ozone photolysis that yields O1D. The critical role of the marine boundary layer in the global ozone balance and the constraints that it places on the net continental production are clearly revealed. Sensitivity analysis identifies which of the basic set of process parameters most require better understanding. Minimalist models such as this, used in conjunction with detailed CTM model simulations, can help provide a comprehensive understanding of the climatic behavior and trends in tropospheric ozone.
Environmental significanceOzone is a species of great importance to the Earth's climate and air quality. Generally, our understanding of its spatial and temporal distribution is derived from extremely complex Earth System Models, which treat the atmosphere through detailed Chemical Transport Models. Here we use a simple compartmental model to simulate the average (climatic) annual and seasonal distribution of ozone in the Northern Hemisphere midlatitude troposphere. A minimal set of parameters with values taken from generally accepted and measured behavior is used to describe the ozone sources and sinks within the compartments and inter-compartmental flow and mixing. Minimalist models such as this, used in conjunction with detailed CTM model simulations, can help provide a comprehensive understanding of the climatic behavior and trends in tropospheric ozone. |
1 Introduction
The detailed processes determining the ozone distribution in the Earth's troposphere are extremely complex, involving chemical and transport processes spanning a large range of temporal and spatial scales.1 With advances in measurement and computational power, computer modelling efforts have increased in complexity, combining detailed transport and mechanistic chemistry (Chemical Transport Models – CTMs) in an effort to replicate the highly variable spatial and temporal observations in as much detail as possible and to understand nature's and humanity's influence on the amount of this toxic molecule in the air we breathe.2 Importantly, ozone also plays a central role in atmospheric photochemistry, controlling the oxidative capacity of the atmosphere, and thereby influencing the production of secondary aerosols and determining the lifetime of short-lived greenhouse gases such as methane.3 It is also a powerful anthropogenic greenhouse gas on its own accord, as well as a potent phytotoxin that can impede uptake of carbon by the biosphere.1Despite the large variability caused by the vagaries of weather, clear patterns (climates) are revealed when weather is averaged over sufficient time and space. This averaged behaviour becomes reproducible because it responds to and is confined by overall constraints governing the behavior of the atmosphere. The response of the atmosphere on our orbiting, tilted planet to a finite amount of reproducibly distributed radiant energy yields the familiar atmospheric superstructure with zonal flow patterns, overturning circulations and seasonal changes in temperature, humidity, winds and vegetation. Embedded in this atmosphere is the minor constituent ozone, delivered from the stratosphere, transiently formed and destroyed in the troposphere from precursors both natural and anthropogenic, and lost to the surface. And though the ozone concentration at a given location and time may vary to a similar degree as the weather itself, its average is similarly constrained by average actinic flux, transport properties and emissions of precursor species.
Over time, as atmospheric modelling efforts have become more complex and model output more detailed, the connection of the average response of the atmosphere to the large-scale driving processes has become obscured by the high variability of the fine-scale temporal and spatial observations and simulations. Consequently, a realization has dawned of the utility in developing a ‘hierarchy’ of models4 of varying complexity in order to assist in the understanding of extremely complex systems like the Earth's climate. Here we aim to do just that; viz., develop a simple model that can reproduce reported large-scale average ozone gradients and seasonal variations at northern hemisphere midlatitudes with sufficient fidelity to be broadly instructive. The model intentionally includes only the atmospheric processes we find to be essential, and whose parameterizations we derive from analysis of properly averaged observational data. The goals of this exercise are to frame simple explanations of observations, to separately investigate the effects of specific ozone sources and sinks, and to provide a framework for interpreting more sophisticated modeling results. Such a methodology of intentionally making the maximum possible number of simplifications in order to reduce a complex problem to some form of its pared-down, essential core has long been used to great effect in the field of geophysical fluid dynamics;5 here we apply this approach to the atmospheric chemistry of ozone.
2 Model description
We focus solely on the northern midlatitudes since they have been the dominant region of human industrial activities leading to the pronounced increase in background ozone throughout the 2nd half of the 20th Century.6 Late 20th Century inventories attribute ∼60% of the global NOx emissions, likely the most consequential ozone precursor, to the 30–60 N latitude belt.7,8 More recent emission increases in East Asian subtropical regions, and other developing megacities, are shifting the distribution equatorward, but ∼50% of the global emissions remain in the 30–60 N band.The northern midlatitude troposphere is treated as a circular series of completely mixed compartments (continuous stirred tank reactors, CSTRs in chemical engineering terminology) with transport amongst them and chemistry within them included, as in other atmospheric “box” models. Such compartmental models have long been used to characterize and investigate complex systems in diverse scientific fields.9–11 As illustrated by Fig. 1, nine longitudinal model segments correspond to nine significant longitudinal segments of the Northern Hemisphere: western and eastern North Pacific, western and eastern North America, western and eastern North Atlantic, and the continental segments of Europe, central Asia and eastern Asia. Each segment is divided into a free troposphere (FT) compartment directly above a boundary layer (BL) compartment. The FT compartments participate in a circular, west-to-east zonal flow, receiving ozone from the stratosphere above, while mixing with the BL compartments below. Transport and reactive processes are parameterized from extensive studies of their average measured or modeled properties. Here we concentrate on annual mean properties and their seasonal cycles that persist within longer multidecadal trends, currently of much concern regarding climate modeling and regulatory exercises.
The motivating principle behind this simplified model arises from the simplistic 3-cell model of global circulation with weak easterlies in the tropics giving way to strong prevailing westerlies in the middle latitudes, where the mean zonal winds are an order of magnitude larger than mean meridional components, with a less well-defined picture at high latitudes. The ERA 40 reanalysis cross section (Fig. 2) shows that a dominant current of fast-moving air that circumnavigates the globe is contained in our selected 30–60 N latitude band. This rapid longitudinal transport creates a unique environment where the horizontal advection timescale is less than or comparable to the net photochemical ozone production and loss12 providing the necessary conditions for the validity of our simplified model.
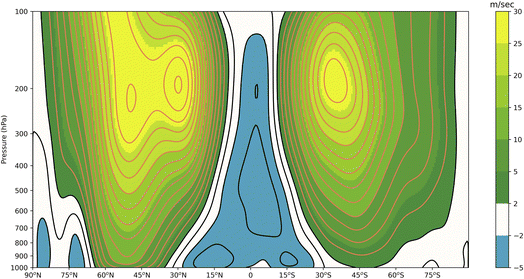 | ||
| Fig. 2 Cross section of annual mean zonal winds derived from the ERA 40 reanalysis. Isotach spacing 2 m s−1. | ||
Despite very modest average meridional flows in this latitude band there is the possibility of significant mean and eddy (transient and spatial) transport into and out of the 30–60 N atmospheric channel. Miyazaki et al. (2005)13 calculate the meridional ozone fluxes in both the stratosphere and troposphere using five years of the Meteorological Research Institute – Japan Meteorological Agency (MRI-JMA) ozone reanalysis system on the basis of mass-weighted isentropic zonal means (similar to the more common Transformed Eulerian Mean). Their Fig. 3e–h shows how the poleward mean fluxes in the midlatitude middle to upper troposphere are largely compensated by the equatorward eddy fluxes at the same levels and similar equatorward ozone fluxes in the lower troposphere. Nevertheless, even at times of the greatest fluxes in the northern midlatitudes (winter/spring), the largest net fluxes reported13 of ∼200 kg s−1 amount to a rate of change in the 20–60 N latitude band of <0.01 ppb day−1.
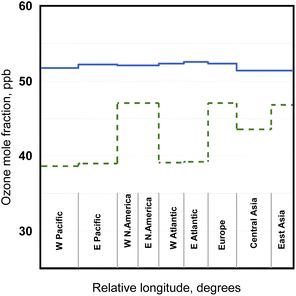 | ||
| Fig. 3 Simulated annual mean ozone mixing ratios (FT solid blue, BL dashed green) in the 18 model compartments. | ||
2.1 Compartment balance equations
Each compartment obeys the following mass balance equations. The dynamic O3 balance for a given BL compartment can be expressed as| dXB,i/dt = PB,i − kB,i × XB,i + (XT,i − XB,i)/τB,i | (1) |
The dynamic O3 balance for a FT compartment is given by
| dXT,i/dt = STEi + (XT,i-1 − XT,i)/τu,i + (XB,i − XT,i)/τT,i | (2) |
The first term is the influx from the stratosphere in units of ppb day−1. The second term represents net west-to-east zonal flow, denoted by subscript u, from compartment i-1 to the compartment i. The global circulation is completed with the last compartment flowing into the first compartment. The time constant τu,i is the characteristic zonal flow time through compartment i. Note that for simplicity, no zonal advection term is included for the BL compartments due to the much slower flow velocity at lower altitudes (e.g., Fig. S1† of Parrish et al. 2021).12 Estimates of the impacts of neglecting this term and other simplifications of the model are presented in Section S8.† The complete mixing within each compartment assumed here washes out more subtle spatial distribution aspects (e.g., vertical ozone gradients in the FT evident in ozone sonde records, e.g., Oltmans et al., 2008),14 and imparts an exponential distribution of residence times in each compartment (i.e., air parcels entering a compartment have a distribution of residence times, t, proportional to e−t/τ). The last term is a companion vertical mixing term with its respective BL compartment. The characteristic mixing times of paired BL and FT compartments are related by
| τT,i/τB,i = mfT,i/mfB,i | (3) |
The coupled equation set can be integrated in order to model time dependent behavior or, the derivatives can be set to zero and solved algebraically using constant inputs in order to calculate a notional steady state that would represent annual means. In place of the specific compartment index, i, the indices m and c are substituted for general discussions of the groups of marine and continental compartments, respectively.
2.2 Model parameters
The tropospheric column is assigned to be the atmosphere below 220 hPa. For the marine compartments 86% of the tropospheric mass16 is in the free troposphere (consistent with a ∼1000 m interface17) and for continental compartments 79% is in the free troposphere (consistent with a ∼1500 m interface17). Topographical effects and seasonal variations are ignored.There is general agreement that the predominant source of ozone to the marine boundary layer (MBL) is mixing (entrainment) from the free troposphere with loss dominated by boundary layer photochemistry.18,19 We set photochemical production within the MBL to zero, as it is small compared to entrainment. The upward mixing time of the MBL, τB,m, is set to 5.9 days (see ESI S2†). This result is generally consistent with estimates from aircraft20 and satellite21 analyses, but is somewhat longer than the 3.9 day value derived from the vertical MBL entrainment velocity of 0.3 cm s−1 estimated from the observed ozone diurnal cycle at Cape Grim, Australia.18 ESI S2† gives further consideration of MBL entrainment, and the sensitivity of the model results to this transport parameter is discussed below.
The continental BL compartments are given a value of 2.5 days for upward mixing, τB,c. This yields a downward mixing time τT,c of 10 days, in agreement with the average convective transport times reported in Fig. S1† of Parrish et al. (2021).12 As discussed below, the conclusions of this study are not sensitive to the exact value of this parameter.
The zonal flow times, τu,i, are calculated from the average midlatitude (30–60 N) flow velocities of the troposphere (200–800 hPa), reported in Fig. 1 and 2 of Kousky and Ropelewski (2009)22 and the widths, wi, assigned for each compartment. The mass averaged zonal flow velocity range between 11 m s−1 in July to 18 m s−1 in January, values consistent with other reported velocity distributions.23,24 These values give average global circuit times of 18 to 28 days. The corresponding flow residence time in each compartment is derived from a median 23 day time. Significantly, these compartment flow residence times are shorter than the free troposphere compartment downward mixing times, and the model predictions are insensitive to the precise choice of this parameter.
Parameters related to the ozone budget are chosen from published observational analyses and reviews of modeling studies of the global annual ozone budget. A critical parameter is the magnitude of stratosphere–troposphere exchange (STE), which is difficult to measure and is the subject of continuing research. Ozone flux measurements specific to the northern hemisphere based on O3/90Sr correlations25 yield a value of 7.8 × 10¹⁰ molecules cm−2 s−1. This flux adds 0.37 ppb day−1 when mixed into the total midlatitude troposphere. Tracer-derived mass transfer measurements,26 combined with measured tropopause ozone mixing ratios, give similar values. The review of ACCENT suite of models27 cite a global stratospheric source of 550 Tg year−1; a value of 0.4 ppb day−1 results from this source when delivered evenly to the midlatitude troposphere. We choose that latter value for this study; the STE parameter in eqn (2) is given by dividing this value by the free troposphere fraction of a given longitudinal segment.
Recent modeling studies report a range of total tropospheric photochemical ozone production (natural and anthropogenic) that are 5–10 times the STE contribution. The ACCENT cases report 5110 Tg year−1 while the IPCC-TAR studies report 3435 Tg year−1.27 We select a median global production of 4300 Tg year−1, and as a crude approximation, assign 50% of that total to the NH continental BL compartments, consistent with the zonal fraction of total NOx emissions.8 This allocation gives a photochemical production to STE ratio of 3.9 in the northern midlatitude belt and a global ratio of 7.9. This assignment results in 50 ppb day−1 ozone production rates in the continental BL, with a lower amount of 45 ppb day−1 arbitrarily assigned to central Asia. This artificial contrast serves to monitor the effect of regional source variability in our simple model, and to crudely acknowledge less industrialization in central Asia. Importantly, the model results for the MBL and FT are insensitive to this artificial spatial distribution of the total ozone production, although the spatial distribution of ozone within the continental BL is affected by this choice.
Ozone is lost from the BL compartments by first-order loss rate coefficients, kB,c and kB,m, which account simultaneously for the manifold of photochemical destruction reactions as well as dry deposition. Earlier 2D modelling28 indicated that net photochemical production is largely contained within the continental BL, consistent with our treatment. See ESI S8† for further discussion. The magnitude of these coefficients remain undetermined. Each must compensate for ozone entrainment from the FT, which in turn depends on the ozone mixing ratios in the BL compartments and the overlying FT compartments. The total loss in all BL compartments must balance the total ozone sources to the troposphere, i.e., total ozone production within the continental BL compartments plus the total STE to the FT compartments. Solution of the model involves iterative variation of kB,c and kB,m until annual mean MBL and FT mixing ratios converge to 39 ppb and 52 ppb, respectively. These values are consistent with reported29 mean baseline ozone concentrations at northern midlatitudes. Importantly, these concentrations are observed to be zonally quite similar; for example an ∼18% difference in mean MBL ozone concentrations between the west coasts of Europe and North America29 is the largest variation in mean zonal ozone at northern midlatitudes of which we are aware. The “base case” input parameters and derived kB,I values are summarized in Table 1.
| Compartment | w i deg. | mfB,i | τ u,i day | τ B,i day | τ T,i day | STEi | P B,i | k B,i day−1 |
|---|---|---|---|---|---|---|---|---|
| a Units: STE and PB,i are given as ppb day−1. | ||||||||
| West Pacific | 55 | 0.14 | 3.5 | 5.9 | 37 | 0.45 | 0 | 0.056 |
| East Pacific | 55 | 0.14 | 3.5 | 5.9 | 37 | 0.45 | 0 | 0.056 |
| West N. Amer. | 30 | 0.21 | 1.9 | 2.5 | 9.4 | 0.52 | 50 | 1.11 |
| East N. Amer. | 30 | 0.21 | 1.9 | 2.5 | 9.4 | 0.52 | 50 | 1.11 |
| West Atlantic | 35 | 0.14 | 2.2 | 5.9 | 37 | 0.45 | 0 | 0.056 |
| East Atlantic | 35 | 0.14 | 2.2 | 5.9 | 37 | 0.45 | 0 | 0.056 |
| Europe | 40 | 0.21 | 2.6 | 2.5 | 9.4 | 0.52 | 50 | 1.11 |
| Central Asia | 50 | 0.21 | 3.2 | 2.5 | 9.4 | 0.52 | 45 | 1.11 |
| East Asia | 30 | 0.21 | 1.9 | 2.5 | 9.4 | 0.52 | 50 | 1.11 |
Held (2005)4 discusses the balance between elegance versus elaboration in the development of a hierarchy of models: “An elegant model is only as elaborate as it needs to be to capture the essence of a particular source of complexity, but is no more elaborate.” The model defined here clearly emphasizes elegance at the expense of elaboration; many complex processes that affect ozone are not treated (seasonal dependence of interzonal mixing, boundary layer advection, complex kinetics, etc.). The impact of the omission of some of the more important processes are discussed in Section S8 of the ESI.†
3 Results
3.1 Stationary state simulation
Fig. 3 illustrates the steady-state result using the parameter values of Table 1. The solid and dashed line segments give the ozone mixing ratios in the free troposphere, XT,i and boundary layer XB,i, respectively. These results illustrate several key points.First, the substantial spatial variation in BL source intensity, from zero over the ocean to finite land sources, results in significant variation in the boundary layer ozone contents, but only minor variation in the overlying free troposphere; this agrees well with the early suggestion30 and recent confirmation29 that the northern hemisphere free troposphere can be viewed as a well-mixed ozone reservoir. The time required to exchange the contents of a free troposphere compartment with its underlying boundary layer is substantially longer than the residence time given by zonal flow. Therefore, the free troposphere serves as a large reservoir mixing with the surface layers as it flows over them. This damps out its spatial variation, much like a capacitor in an electrical circuit. This capacitance effect is also evident in seasonal variability considered in the next section.
Second, for our chosen MBL mixing time, the derived value for kB.m is 0.056 day−1 – close to the 0.051 day−1 value determined in the ESI S1† from measured photolysis rates and sea surface temperatures. The model results are quite sensitive to the choice of this parameter. This sensitivity arises from the counterbalancing “see saw” relationship that exists between the marine and continental regions in the overall ozone balance. Together, the boundary layer compartments must remove all the ozone photochemically produced and injected from the stratosphere – what the MBL compartments do not remove, the continental compartments must. This balance depends on the chosen parameter values. Our particular “base case” result in Fig. 3 shows a positive ozone gradient between the continental BL compartments and their overlying FT compartments; this gradient indicates a net downward flux over the continents. A modest ozone increase is seen in the MBL compartments from west to east, which reflects the increases in the overlying FT, accompanied by decreases across the continents. At steady-state, ozone loss in each MBL compartment, in units of ppb day−1 from the entire northern midlatitude troposphere, is given by
| LB,m = mfB,m × wm/360 × (XT,m − XBmi)/τB,m | (4) |
The sum of LB,m over the MBL compartments gives the total contribution of the MBL to the northern midlatitude budget. In the above base case, the MBL compartments remove 0.151 ppb day−1, 38% of the 0.40 ppb day−1 provided by STE. This is less than the areal percentage of the oceans (∼50% from 30 N to 60 N), leaving the continental BL responsible for more than its share of removal of the STE input. This forces the trends discussed above.
This “see saw” balance between the marine and continental regions is affected by the values of the marine parameters. According to eqn (4) the amount of ozone removed by the marine layers depends on the height of the boundary layer, Zm, which determines mfB,m, and on the characteristic boundary layer exchange time, τB,m. Results from a series of model runs with various Zm (500 m to 1 km) and τB,m (1 day to 1 week) are shown in Fig. 4 and 5. In each simulation kB,m, is varied to hold the mean MBL mixing ratio at 39 ppb, and the ozone removed by the marine compartments is expressed as the fraction of the global STE. As this fraction increases, the ozone in the continental boundary layers (Fig. 4) must increase as these compartments export more ozone to the FT to maintain the mean FT mixing ratio at 52 ppb. Since the continental production is fixed, increasing continental BL ozone requires that the first order loss rate constant in these compartments, kB,c, decrease (Fig. 5). Intuitively, kB,c should be unity if continental boundary layer loss only has to account for photochemical ozone production and none of the STE. It should be greater than 1 if the continents remove some STE and less than 1 if the marine layers remove more than the total STE; Fig. 5 shows kB,c cross from above to below 1. The marine boundary layer parameter combination kB,m × Zm increases smoothly in accordance with this balance. Notably, these results from the 18-compartment model in Fig. 1 are well represented by the solid lines in Fig. 4 and 5, which were derived from an analytical solution to the simpler, 3-box model described in the ESI S4.†
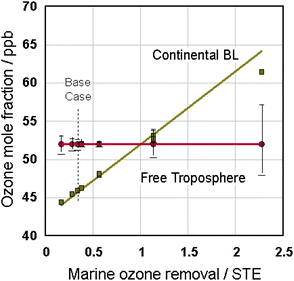 | ||
| Fig. 4 Simulated mean ozone mixing ratios in the FT (red circles) and continental BLs (green squares) for different marine layer removal rates relative to STE. The vertical dashed line connects base case condition symbols. Bars indicate the range of values among FT compartments. The simpler, 3 box model described in ESI S4† predicts the solid lines. | ||
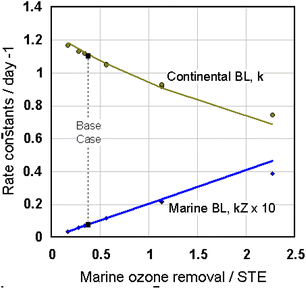 | ||
| Fig. 5 Derived values of the marine (kB,m – blue circles) and continental (kB,c – green circles) ozone removal rate constants for different marine layer removal rates relative to STE. The vertical dashed line connects base case condition symbols. The simpler, 3 box model described in ESI S4† predicts the solid lines. | ||
The general picture of the free troposphere serving as a reservoir is appropriate throughout the parameter range of Fig. 4 and 5, but It does begin to fail with the most rapid MBL mixing (τB,m = 1 day, Zm = 1 km) on the far right of the graphs. At this mixing rate, a substantial portion of the overlying FT is exchanged during its passage time over an underlying BL compartment. This compromises the separate identities of the two compartments and results in a significant variation (∼ ±10%) in the ozone levels in the FT compartments as shown by the bars in Fig. 4. The increased importance of continental removal at low marine ozone removal rates (far left of Fig. 4 and 5) increases the variation in the FT due to the contrasting central Asia compartment.
Finally, the dependence of ozone concentrations in the different FT compartments on the total continental photochemical ozone production is of interest, as it gives some insight into discussions of the historical record of mean northern midlatitude ozone concentrations.31Fig. 6 shows the response of the model to varying continental ozone production relative to the base case. Expressed as a multiple of the STE source term, this ratio is varied from zero to 1.5 times the base case value of 12.9. The mean BL and FT ozone concentrations respond linearly with all other base case parameters, including loss rate constants, held fixed. The continental loss rate constant, kB,c, is larger than the marine kB,m (see Table 1) implying that the losses over land (both photochemical and dry deposition) are more effective than the marine photochemical losses. As a result, at low enough production rates, ozone levels in the continental BL become lower than in the MBL. This cross-over is consistent with recent discussion of preindustrial ozone concentrations being larger in the southern hemisphere, which is dominated by oceans, than in the northern hemisphere, which has much larger continental areas.32
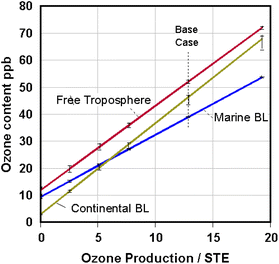 | ||
| Fig. 6 Effect of total photochemical ozone production, relative to STE, on the mean ozone content of the FT (red), continental BL (green) and MBL (blue) compartments. The vertical dashed line connects base case condition symbols. Bars indicate the range of values among compartments. The simpler, 3 box model described in ESI S4† predicts the solid lines. | ||
In summary, this simple model and the foregoing calculations illustrate how the ozone contents in all segments of the northern midlatitude zone are interconnected through a relatively well-mixed free troposphere and the required total zonal mass balance. The “see-saw” relationship noted above between the marine and continental regions shows how processes in one component (e.g. the marine layers) illuminates and constrains those occurring in the other (continental) layers. This simple overview of the atmosphere frames the complex measurements and simulations of tropospheric ozone and, as we discuss later, can guide and aid in their interpretation.
3.2 Seasonal cycle simulation
Time dependence, seasonal cycles as well as long term trends, is an important feature of mean tropospheric ozone concentrations. Surface and sonde data at marine sites29,34 show that the MBL and the overlying free troposphere have distinctly different seasonal cycles. This clearly indicates that mixing between the two is slow enough to preserve their distinct dynamics. In order to understand this behavior, we first introduce into the model the seasonal time dependence of two critical terms in the ozone budget for which there is suitable experimental characterization: (1) ozone transport from the stratosphere (STE) and (2) the loss coefficient kB,m in the MBL. The following time-dependent function is used:| F(θ) = 〈F〉 × {A + B*([sin(θ + φ) + 1]/2)n} | (5) |
| θ = calendar day of the year × 2π/365 | (6) |
As discussed in ESI S3,† the function inside the outer brackets allows variation in amplitude, phase and width of the seasonal maximum; its average over the year is unity. 〈F〉 then scales the function to give the correct annual average of the variable F.
| hν(<350 nm) + O3 → O2 + O(1D) |
| O(1D) + H2O → 2OH |
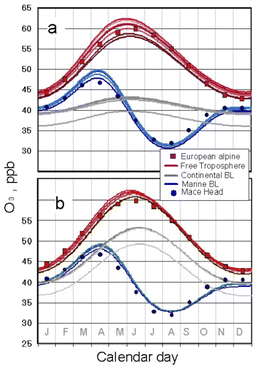
Fig. 7 shows the results of including these time-dependent parameters, one at a time, into differential eqn (1) and (2) and integrating. In Fig. 7a the FT is seen to respond to the oscillatory input from the stratosphere, but the “capacitance” effect of the FT affects both the amplitude and phase of the response. The long FT lifetime of ozone and mixing with the constant continental sources reduce the factor of 4 range of eqn (7) to only ∼±20% and cause a phase lag of ∼40 days. The close clustering of the FT curves arises from the “reservoir” function of the FT. The MBL compartments respond with a similar oscillation to that in the FT as they have no internal sources (and no seasonal loss dependence yet included). A slight further delay results from the mixing time of the MBL with the FT. The continental BLs respond to a lesser degree due to their constant internal sources, which dilute the stratospheric influence. These seasonal trends are compared with measured monthly means29 from Mace Head, an MBL site on the windward coast of Ireland, and from neighboring European alpine sites (considered to be dominated by the FT). The seasonal cycle calculated for the FT matches the European alpine data well. The MBL Mace Head data differ greatly from the FT however, indicating its distinct and compartmentalized seasonal behavior.
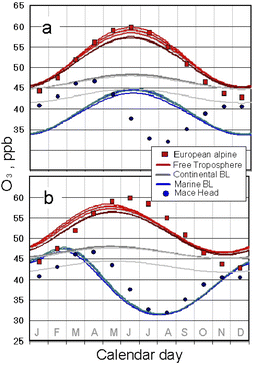 | ||
| Fig. 7 Simulated seasonal dependence driven by seasonal cycles in STE and MBL loss defined by eqn (7) and (10). (a): STE cycle included. (b): both STE and MBL loss cycles included. Upper (red) and lower (blue) curves indicate FT and MBL compartments, respectively, with continental BL compartments in the middle (grey); Central Asia is the outlier. Observed seasonal cycles29 for the MBL at Mace Head (blue circles) and the FT from European alpine sites (red squares) are shown for comparison. | ||
Fig. 7b shows the results of adding the simulated seasonal cycle of kB,m of eqn (5) into eqn (1). Here 〈kB,m〉 = 0.061 day−1, similar to the 0.051 day−1 value directly derived from consideration of photolysis rates and sea surface temperature in ESI S1.† This seasonal dependence produces a marked change in the simulated MBL seasonal cycle. The late summer maximum in the MBL removal rate brings the MBL seasonal cycle into approximate agreement with the Mace Head observations. Because of the integrating “capacitance” effect of the FT however, the FT compartments respond to the MBL effects with a shift in the phase which is mirrored in the underlying continental BL compartments. That shift causes a mismatch in the phase and amplitude of the FT seasonal cycle. In the MBL, the summer losses of ozone appear to begin approximately one month too early in the simulation. Nevertheless, the gross features of these seasonal cycles are well reproduced.
The remaining differences between the simulation and observations can be attributed to two sources: (1) the differences between our time-dependent STE and MBL loss functions and their true seasonal behavior, and (2) the hitherto ignored seasonal dependence of the continental boundary layer sources. We consider these in turn, with the results presented in Fig. 8.
Fig. 8 shows that, together with the correction to the MBL loss function which faithfully reproduces the early (Jan–Mar) ozone increase, either (1) the adjustment of the STE seasonal cycle or (2) introduction of a seasonal cycle in photochemical ozone production over the continents can produce excellent simulations of the observed behaviour at Mace Head and the European alpine sites.
Fig. 8a shows that uncertainties in the STE and MBL loss seasonal cycles are large enough to allow good fits without including a seasonal dependence in the continental sources. Fig. 8b shows that continental seasonal behaviour is also able to produce an excellent fit if the STE simulation by eqn (5) is returned to the initial parameters given in Table S1† and a seasonal cycle in the continental photochemical production is introduced by eqn (5) with the parameters in Table S1.† This function gives a summer solstice maximum in the continental photochemical production 30% larger than its minimum value (Fig. S7†). The FT and MBL behaviour are well represented by either of the two simulations in Fig. 8, but the continental BL seasonal behaviour is sensitive to this choice. The increased STE flux in Fig. 8a requires the continents to remove more ozone, creating a larger gradient between the FT and the boundary layers compared to Fig. 8b. Thus, observations of the ozone seasonal cycle within the continental BL would be helpful in further evaluating these simulations; however, care must be taken to select regionally representative data from the vast set of continental ozone measurements, given the great spatial and temporal ozone variability, the greater seasonal variability in vertical mixing rates over the continents, and the bias of nearby urban centers. Fig. 9 compares the simulated continental BL seasonal cycles in Fig. 8b with the mean seasonal ozone cycle measured at surface sites in the Clean Air Status and Trends Network (CASTNET) sites of the US EPA (https://www.epa.gov/castnet). Notably, this comparison has not been used in the above optimizations of the fits to the MBL and FT seasonal cycles; thus, it does increase our confidence in those efforts. It is the total net continental sources over all three northern midlatitude continents that governs the FT behavior however, so observations from other continents must be considered before reaching firm conclusions.
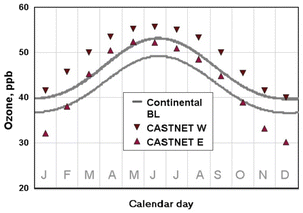 | ||
| Fig. 9 Comparison of mean seasonal ozone cycles in the continental BL between the simulation shown in 8b, and observations from western and eastern North American CASTNET sites (see ESI S6† for details). | ||
The tropospheric ozone column and its seasonal dependence has been measured by satellite over most of the globe.36 These data, averaged over northern midlatitudes, are shown in Fig. 10 and compared with our model results from the simulations in Fig. 8a and b. The model behavior is similar to the satellite observations, though the satellite measurements show a maximum later by one month. Since the model constrains the FT and MBL ozone mixing ratio, the difference in the two simulations results from the different ozone content in the continental boundary layers. Introduction of seasonal dependence of the continental boundary layer height could bring the model results into closer agreement with the satellite data.
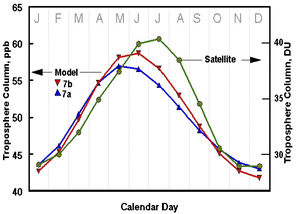 | ||
| Fig. 10 Total tropospheric ozone column measured by satellite (green circles, right hand axis) with the total column amounts in the simulations in Fig. 8 (triangles, left hand axis). | ||
4. Conclusions
We have shown that the simple representation of the northern midlatitude troposphere illustrated in Fig. 1 can simulate with significant accuracy observed ozone concentrations and their seasonal cycles in the MBL, the continental BL and the FT (see Fig. 8–10). We provide a conceptual model encapsulating the first-order atmospheric processes that drive the northern midlatitude ozone distribution in the background troposphere. The effects of such processes are often difficult or impossible to resolve from the noise of the day-to-day meteorological chaos observed and mimicked in complex CTMs. The macroscopic model parameters here represent very complex processes. An associated Monte Carlo study, described in ESI S7,† confirms that within the frame of this model the parameter values are reliable measures of the complicated systems they represent.Simple studies such as presented in this paper raise the general question: “How well is average behavior explained by the behavior of the averages?” Such work can identify over-arching averaged atmospheric properties, and in parallel with detailed modelling efforts, can illuminate critical atmospheric parameters, such as the rate of mixing between the MBL and the free troposphere highlighted here. Such efforts can guide in the extraction of such averages from the beautifully detailed results of modern CTM modelling. Such reasoning could also possibly identify the reasons for current disagreements among the simulations of different CTMs. The model's attribution of the source of the ozone burden – unobservable in nature – agrees with the findings of complex CTM models33 – this indicates that our simplified description captures some kernel of the scientific understanding found in more complex CTMs.
The over-arching averaged atmospheric properties identified in this work include:
• As first identified by Junge30 in 1962, and more recently emphasized,12,29 the northern hemisphere free troposphere can be viewed as a well-mixed ozone reservoir. Thus, long-term trends and seasonal cycles are expected (and observed) to have pronounced zonal similarity. This similarity is a clear feature of the simulations shown here.
• The primary source of ozone to the MBL is entrainment from the free troposphere, but the MBL is isolated enough and has much faster ozone loss processes, so that its ozone seasonal cycle differs markedly from that in the free troposphere. The generally accepted picture of an overall springtime ozone maximum in tropospheric ozone37 requires a more nuanced description; within the background MBL and the free troposphere, the seasonal maxima differ, occurring in April in the MBL, and in early June in the free troposphere.
• The early picture of ozone in the free troposphere suggested by Junge30 turns out to be approximately correct – ozone in the free troposphere “exhibit(s) a uniform seasonal variation, the phase of which is delayed by about 2 months with respect to the injection (of ozone) into the troposphere” by STE. Here we find a shorter lag time, with the free troposphere ozone maximum nearly coincident with the late spring, early summer maximum of STE. This occurs in spite of photochemical ozone production we prescribe to be a factor of 12.8 larger than STE at northern midlatitudes. This situation arises because the net seasonal influence of photochemical ozone production is largely confined to the continental BL, with no large influences in the free troposphere.
Despite the simplicity of the model presented here, it does provide a useful context for understanding additional first-order and second-order features of the northern midlatitude ozone distribution that can be revealed through observations and more elaborate model simulations. Some of the more important omissions of this CSTR model and their likely impact are briefly discussed in ESI S8.†
In our view, the primary utility of such a simple model is in providing the reader/researcher with a mental picture on which to base evaluation of published literature and the reader's own measurement or modeling results. As observed in Held,4 “On the one hand, we try to simulate by capturing as much of the dynamics as we can in comprehensive numerical models. On the other hand, we try to understand by simplifying and capturing the essence of a phenomenon in idealized models, or even qualitative pictures”. Simple idealized models bring understanding to real-world measurements as well as to the computer attempts to simulate reality. Here, our idealized simple model provides a simple explanation of the average seasonal cycle of ozone in the northern mid-latitude troposphere. The simplifications in this model have their limits and reliable measurements as well as complex models test the limits of the approximations, and can lead to more useful and detailed pictures. Simultaneously, the simple model identifies areas or subsystems that require more understanding. The two efforts mutually support each other, correcting each other, in a manner that is at the heart of science. In ESI S9,† we expand this discussion to illustrate uses of the basic model. The discussion is forward looking, prompting questions to be gleaned from complex measurements and model results as well as cautionary, discussing examples where simple understanding of the over-arching constraints contained in our model could have been used to identify problems in measurements or more sophisticated model results.
Author contributions
This paper arose from discussions among four authors (C. A. M., D. D. P., R. G. D., I. C. F.). C. A. M. developed the model, performed the simulations and wrote the original draft. M. A. provided analysis of the ATom data set. All authors contributed to the critical review and revision of the final manuscript.Conflicts of interest
The authors have no conflicts of interest to declare.Acknowledgements
We thank Thomas M. Smith, Boyin Huang and Huai-Min (John) Zhang of the NCEI (National Center for Environmental Information) for their assistance with the sea surface temperature data. I. C. Faloona's effort was supported by the USDA National Institute of Food and Agriculture, [Hatch project CA-D-LAW-2481-H, “Understanding Background Atmospheric Composition, Regional Emissions, and Transport Patterns Across California”]. I. C. Faloona would like to thank T. Nathan and D. Yang for very helpful conversations on the utility of simplified models in understanding complex phenomena. The authors would also like to thank M. Prather and H. Guo for sharing and discussing their modeling data stream from the NASA ATom project. ERA reanalysis data for Fig. 2 from Kalnay, E. and Coauthors, The NCEP/NCAR Reanalysis 40-year Project. Bull. Amer. Meteor. Soc., 1996, 77, 437–471 provided by the NOAA/ESRL Physical Sciences Laboratory, Boulder Colorado from their Web site at https://psl.noaa.gov/data/composites/reference.htmlReferences
- P. S. Monks, et al., Tropospheric ozone and its precursors from the urban to the global scale from air quality to short-lived climate forcer, Atmos. Chem. Phys., 2015, 15, 8889–8973 CrossRef CAS.
- P. J. Young, et al., Tropospheric Ozone Assessment Report: Assessment of global-scale model performance for global and regional ozone distributions, variability, and trends, Elem. Sci. Anth., 2018, 6, 10, DOI:10.1525/elementa.265.
- I. S. A. Isaksen, et al., Atmospheric Ozone and Methane in a Changing Climate, Atmosphere, 2014, 5, 518–535, DOI:10.3390/atmos5030518.
- I. M. Held, The gap between simulation and understanding in climate modeling, Bull. Am. Meteorol. Soc., 2005, 86, 1609–1614, DOI:10.1175/BAMS-86-11-1609.
- G. K. Vallis, Geophysical fluid dynamics: whence, whither and why?, Proc. R. Soc. A, 2016, 472, 20160140, DOI:10.1098/rspa.2016.0140.
- O. R. Cooper, et al., Global distribution and trends of tropospheric ozone: An observation-based review, Elem. Sci. Anth., 2014, 2, 000029, DOI:10.12952/journal.elementa.000029.
- M. Kanakidou and P. J. Crutzen, Scale problems in global tropospheric chemistry modeling: comparison of results obtained with a three-dimensional model, adopting longitudinally uniform and varying emissions of NOx and NMHC, Chemosphere, 1993, 26(1–4), 787–801 CrossRef CAS.
- Y. Zhang, O. R. Cooper, A. Gaudel, A. M. Thompson, P. Nédélec, S.-Y. Ogino and J. J. West, Tropospheric ozone change from 1980 to 2010 dominated by equatorward redistribution of emissions, Nat. Geosci., 2016, 9(12), 875–879 CrossRef CAS PubMed.
- K. Godfrey, Compartmental Models and Their Application, Academic, London, 1983 Search PubMed.
- C. A. Mims and L. E. McCandlish, Evidence for rapid chain growth in the Fischer-Tropsch synthesis over iron and cobalt catalysts, J. Phys. Chem., 1987, 91, 929–937 CrossRef CAS.
- A. Abou-Ismail, Compartmental models of the COVID-19 pandemic for physicians and physician-scientists, SN Compr. Clin. Med., 2020, 2, 852–858 CrossRef CAS.
- D. D. Parrish, R. G. Derwent and I. C. Faloona, Long-term baseline ozone changes in the Western US: A synthesis of analyses, J. Air Waste Manage. Assoc., 2021, 71(11), 1397–1406, DOI:10.1080/10962247.2021.1945706.
- K. Miyazaki, T. Iwasaki, K. Shibata and M. Deushi, Roles of transport in the seasonal variation of the total ozone amount, J. Geophys. Res.: Atmos., 2005, 110(D18), 309, DOI:10.1029/2005JD005900,2005.
- S. J. Oltmans, A. S. Lefohn, J. M. Harris and D. S. Shadwick, Background ozone levels of air entering the west coast of the U.S. and assessment of longer-term changes, Atmos. Environ., 2008, 42, 6020–6038 CrossRef CAS.
- D. S. Stevenson, et al., Multimodel ensemble simulations of present-day and near-future tropospheric ozone, J. Geophys. Res., 2006, 111, D08301, DOI:10.1029/2005JD006338.
- U.S. Standard Atmosphere, U.S. Government Printing Office, Washington D.C., 1976, NOAA-S/T 76-1562 Search PubMed.
- A. von Engeln and J. Teixeira, A planetary boundary layer height climatology derived from ECMWF reanalysis data, J. Clim., 2013, 26, 6575–6590 CrossRef.
- G. P. Ayers, H. Granek and R. Boers, Ozone in the marine boundary Layer at Cape Grim: model simulation, J. Atmos. Chem., 1997, 27, 179–195 CrossRef CAS.
- S. A. Conley, I. C. Faloona, D. H. Lenschow, T. Campos, C. Heizer, A. Weinheimer and C. A. Cantrell, et al., A complete dynamical ozone budget measured in the tropical marine boundary layer during PASE, J. Atmos. Chem., 2011, 68, 55–70 CrossRef CAS.
- I. Faloona, D. H. Lenschow, T. Campos, B. Stevens, M. Van Zanten, B. Blomquist, D. Thornton, A. Bandy and H. Gerber, Observations of entrainment in eastern Pacific marine stratocumulus using three conserved scalars, J. Atmos. Sci., 2005, 62, 3268–3285 CrossRef.
- R. Wood and C. S. Bretherton, Boundary Layer Depth, Entrainment, and Decoupling in the Cloud-Capped Subtropical and Tropical Marine Boundary Layer, J. Clim., 2004, 17, 3576–3588 CrossRef.
- V. E. Kousky and C. F. Ropelewski, The Tropospheric Seasonally Varying Mean Climate over the Western Hemisphere (1979-1995), NCEP Climate Prediction Center ATLAS no 3, 1997, https://www.cpc.ncep.noaa.gov/products/precip/atlas3/ Search PubMed.
- C. Ihara and Y. Kushnir, Change of mean midlatitude westerlies in 21st century climate simulations, Geophys. Res. Lett., 2009, 36, L13701, DOI:10.1029/2009GL037674.
- K. Bowman and G. D. Carrie, The mean-meridional transport circulation of the troposphere in an idealized GCM, J. Atmos. Sci., 2001, 59, 1502–1514 CrossRef.
- (a) E. F. Danielsen and V. K. Mohnen, Project Dustorm report: Ozone transport, in situ measurements and, meteorological analyses of tropopause folding, J. Geophys. Res., 1977, 82, 5867–5877 CrossRef CAS; (b) D. M. Murphy and D. W. Fahey, An estimate of the flux of stratospheric reactive nitrogen and ozone into the troposphere, J. Geophys. Res., 1994, 99, 5325–5332 CrossRef CAS.
- A. Stohl, P. Bonasoni, P. Cristofanelli, W. Collins, J. Feichter, A. Frank, C. Forster, E. Gerasopoulos, H. Gäggeler, P. James, T. Kentarchos, H. Kromp-Kolb, B. Krüger, C. Land, J. Meloen, A. Papayannis, A. Priller, P. Seibert, M. Sprenger, G. J. Roelofs, H. E. Scheel, C. Schnabel, P. Siegmund, L. Tobler, T. Trickl, H. Wernli, V. Wirth, P. Zanis and C. Zerefos, Stratosphere-troposphere exchange: A review, and what we have learned from STACCATO, J. Geophys. Res., 2003, 108, 8516, DOI:10.1029/2002/JD002490.
- O. Wild, Modelling the global tropospheric ozone budget: exploring the variability in current models, Atmos. Chem. Phys., 2007, 7, 2643–2670 CrossRef CAS.
- J. E. Johson and I. S. A. Isaksen, Tropospheric ozone chemistry. The impact of cloud chemistry, J. Atmos. Chem., 1993, 16, 99–122 CrossRef.
- D. D. Parrish, R. G. Derwent, W. Steinbrecht, R. Stübi, R. Van Malderen and M. Steinbacher, et al., Zonal similarity of long-term changes and seasonal cycles of baseline ozone at northern mid-latitudes, J. Geophys. Res.: Atmos., 2020, 125, e2019JD031908, DOI:10.1029/2019JD031908.
- C. E. Junge, Global ozone budget and exchange between stratosphere and troposphere, Tellus, 1962, XIV, 363–377 Search PubMed.
- D. D. Parrish, R. G. Derwent and J. Staehelin, Long-term changes in northern mid-latitude tropospheric ozone concentrations: Synthesis of two recent analyses, Atmos. Environ., 2021, 248, 118227, DOI:10.1016/j.atmosenv.2021.118227.
- D. D. Parrish, et al., Investigations on the anthropogenic reversal of the natural ozone gradient between northern and southern midlatitudes, Atmos. Chem. Phys., 2021, 20, 15617–15633, DOI:10.5194/acp-21-9669-2021.
- J. Lelieveld and F. J. Dentener, What controls tropospheric ozone?, J. Geophys. Res., 2000, 105, 3531–3551 CrossRef CAS.
- D. D. Parrish, et al., Seasonal cycles of O3 in the marine boundary layer: Observation and model simulation comparisons, J. Geophys. Res.: Atmos., 2016, 121, 538–557, DOI:10.1002/2015JD024101.
- Q. Tang, M. J. Prather and J. Hsu, Stratosphere-troposphere exchange ozone flux related to deep convection, Geophys. Res. Lett., 2011, 38, L03806, DOI:10.1029/2010GL046039.
- J. R. Ziemke, S. Chandra, G. J. Labow, P. K. Bhartia, L. Froidevaux and J. C. Witte, A global climatology of tropospheric and stratospheric ozone derived from Aura OMI and MLS measurements, Atmos. Chem. Phys., 2011, 11, 9237–9251 CrossRef CAS.
- P. S. Monks, A review of the observations and origins of the spring ozone maximum, Atmos. Environ., 2000, 34, 3545–3561 CrossRef CAS.
Footnote |
| † Electronic supplementary information (ESI) available. See https://doi.org/10.1039/d2ea00009a |
| This journal is © The Royal Society of Chemistry 2022 |


