Thermal conduction and rectification phenomena in nanoporous silicon membranes†
Konstanze R.
Hahn
 *,
Claudio
Melis
 and
Luciano
Colombo

Department of Physics, University of Cagliari, Cittadella Universitaria, 09042 Monserrato, Italy. E-mail: konstanze.hahn@dsf.unica.it
First published on 31st May 2022
Abstract
Non-equilibrium molecular dynamics simulations have been applied to study thermal transport properties, such as thermal conductivity and rectification, in nanoporous Si membranes. Cylindrical pores have been generated in crystalline Si membranes with different configurations, including step-like, ordered and random pore distributions. The effect of interface and overall porosity on thermal transport properties has been investigated as well as the impact of the porosity profile on the direction of the heat current. The lowest thermal conductivity and highest thermal rectification for equal porosity have been found for a step-like pore distribution. Increasing interface porosity resulted in an increase of thermal rectification, which has been found to be systematically higher for random pore distribution with respect to an ordered one. Furthermore, a maximum in rectification of 5.5% has been found for a specific overall porosity (Φtot = 0.02) in samples with constant interface porosity and ordered pore distribution. This has been attributed to an increased effect of asymmetric interface boundary resistance resulting from increased fluctuations of the latter with altering temperature. The average value of the interface boundary resistance has been found to decrease with increasing porosity for samples with ordered pore distribution leading to a decrease in thermal rectification.
Introduction
Understanding and control of thermal transport is of crucial importance in many technological applications. Rigorous temperature control, for example, is critical in photovoltaic devices1,2 where too high temperatures can result in a drastic decrease of the photovoltaic performance. Similarly, fast heat dissipation is required in microelectronic devices3 to avoid overheating and guarantee a stable functionality. In thermoelectric devices, on the other hand, a low thermal conductivity is desired4–6 in order to achieve high efficiency characterized by the thermoelectric figure of merit which is inversely proportional to the thermal conductivity.Silicon is one of the most widely used materials in all of these applications. Numerous studies exist on Si-based materials and how thermal transport is affected by doping,7–12 nanostructuring13–16 and porosity.17–20 Interesting results regarding control of thermal transport have further been obtained for thin films, or membranes, in particular, in connection with alteration of the crystalline structure by (nano)pores.21–24
Recently the concept of thermal rectification has been discussed for devices where thermal management is crucial.20,23,25 A detailed knowledge of parameters affecting thermal rectification is the basis of tailoring heat flux in order to control, for example, cooling and energy conversion in nanostructured devices and can eventually lead to the creation of logic devices where phonons are used as information carriers, also called thermal diodes.26–28 Thermal rectification basically is the ratio between the amount of heat transported along one or the other direction in a structurally or chemically asymmetric material. Different expressions are found in literature. Probably the most widely used definition of thermal rectification R refers to the heat flux J in forward (fwd) and reverse (rev) thermal bias condition R = |Jfwd − Jrev|/|Jrev|. With respect to thermal diodes or transistors, porous structures are of particular interest, since thermal transport and thermal rectification can potentially be adjusted by several parameters such as pore size, shape and distribution.
Using molecular dynamics simulations, thermal conductivity has previously been studied in bulk-like Si structures with varying porosity. The porosity has been realized with ordered nanopores of a given radius and random nanoporous structures.19 Results showed a steady, non-linear decrease of thermal conductivity with increasing porosity for both ordered and random porous structures. Thermal conductivity in samples with random nanoporosity has been found to be marginally larger with respect to ordered regular spherical pores. Introducing a gradient in porosity for randomly distributed and shaped pores, thermal rectification has been proven to exist and to be affected by the porosity profile in direction of the heat transport.20 Values between 1 and 4% have been calculated in model Si-based thermal diodes for thermal rectification at a temperature of 600 K.
In a recent experimental study, porous crystalline Si membranes have been investigated, yielding a dependence of thermal rectification on the absorbed power generating the temperature gradient and resulting in a maximum thermal rectification of ca. 14% when the device is operated in vacuum.23
Despite the increasing number of studies that have been carried out recently on thermal rectification in nanoporous Si, there is still need of detailed and fundamental research on the factors affecting thermal conductivity and rectification in such materials. In this respect, our work concentrates on the examination of thermal transport properties of model nanoporous Si membranes applying non-equilibrium molecular dynamics simulations. Several types of nanoporous structures have been analyzed including step-like, ordered and random pore distributions. Furthermore, the effect of interface and overall porosity on thermal conductivity and rectification has been investigated as well as the role of interface thermal resistance. In our previous works20,29 we have addressed the thermal rectification issue either in bulk-like systems or in nanowires. The nanoporous silicon membranes considered here are in fact novel low-dimensional systems, only very recently proposed and experimentally investigated23 and, to the best of our knowledge, not yet addressed by any atomistic simulations so far.
Methods
Computational setup
In this work molecular dynamics simulations have been carried out using the Lammps code30,31 to calculate thermal conductivity and thermal rectification in various samples of porous Si membranes. The Stillinger–Weber potential has been applied to describe interatomic forces.32 This force field has been used previously showing good agreement to experiments.33–35Optimization of the lattice parameter of bulk Si resulted in a0 = 5.431 Å which has been used for all membranes calculated here. Thermal transport was simulated in [100] direction of the crystalline structure, hereafter referred to as z-direction. The membranes had a cross-section of 2.7 nm × 49 nm and a length of 100 nm (Fig. 1), corresponding to a repetition of the 8-atomic unit cell of 90 × 5 and 180, respectively, in x × y and z direction.
 | ||
| Fig. 1 Sketch of the Si membrane samples that have been analyzed in this work. Heat flow has been simulated in z-direction. | ||
For all calculations a time step of 1 fs has been used. To guarantee a relaxed steady state of the systems and allow for thermodynamically favored rearrangements of atoms at the pore sites, samples have been annealed at 900 K prior to the calculation of heat flux. In order to achieve a proper annealing, the samples have been heated in 10 ps from 300 K to 900 K, followed by annealing at 900 K for 200 ps and cooling back to 300 K in 120 ps. This procedure has been followed by 90 ps at 300 K with microcanonical constraints (NVE) to verify a properly relaxed steady state.
Thermal transport phenomena are then calculated using the non-equilibrium molecular dynamics (NEMD) methodology29,36 where a section of 5·a0 at the left and right end of the sample is coupled to a cold and hot Nosé–Hoover thermostat, respectively, and atoms of the last four atomic layers at each edge of the membrane have been fixed to their lattice point. The temperature of the hot and cold reservoir have been set to 500 and 100 K, respectively, in order to obtain the heat flux and thermal conductivity at 300 K.
The heat flux has been calculated as the numerical time derivative of the heat Qcold and Qhot per unit cross-sectional area Sxy (132.7 nm2) injected into and extracted from the hot and cold reservoir, respectively, given by  . In a properly achieved nonequilibrium steady state condition, the modulus of the heat fluxes into and out of the thermostats should be equal. To ensure such steady state condition, the relative difference of the heat fluxes of each thermostat has been calculated by
  and carefully monitored. The samples have been relaxed until the error between hot and cold reservoir was below 2%. For most samples, this accuracy has been reached after 8 × 10⁶ time steps. The effective heat flux used for calculation of the thermal conductivity and rectification has been taken as the average value of the two,
  .
.
Thermal conductivity has been calculated from the heat flux according to
 | (1) |
 is the average gradient of the temperature profile in direction z of the heat flow.
In all samples, the heat flux has been found to be higher in direction of a negative porosity gradient. This direction is thus defined as forward bias and heat flux is labeled with Jfwd (Fig. 2). When the sample is operated in opposite direction it is defined as reverse bias and the heat flux labeled accordingly with Jrev. Thermal rectification has been calculated as  .
.
Sample generation
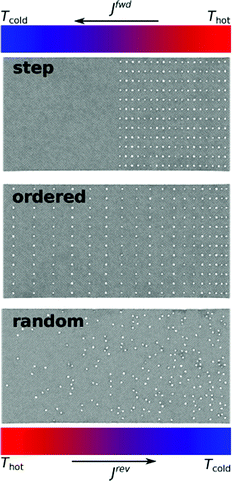
Three different kinds of pore distribution have been analyzed: a step-like distribution, and two non-homogeneous distributions, respectively ordered and random (Fig. 2). In the first case, cylindrical pores have been generated only in one half of the whole sample, resulting in a step-like function of the porosity in direction of heat flow. Pores have been ordered regularly in rows and columns.In an ordered distribution, the position of pores in z-direction has been determined by the number np,‖ of pores in this direction and a linearly decreasing distance between neighboring pores. This kind of distribution results in a reciprocal porosity function in direction of the heat current.
Samples with random distribution have been generated by separating the crystalline membrane in equidistant sections in z-direction and randomly defining the center of each pore. The number of pores in each section has been set in order to result in a linear increase of porosity. The characteristics of the porosity profiles for ordered and random pore distribution are discussed in the following section (see Fig. 4 and 6).
In the following np is defined as the total number of pores and np,⊥ as the number of pores in x-direction. The total number of pores np together with the pore diameter dp define the overall porosity Φtot. In general, the porosity is defined by Φtot = Vpores/Vtot, where Vpores = np·dp·hp is the volume of cylindrical pores with diameter dp and height hp, which corresponds to the height of the membrane in the present case. In this study, the pore volume Vpores has been calculated directly from the number of missing atoms with respect to the corresponding non-porous sample.
For a better comparison of rectification of various samples, the interface porosity Φ⊥ has been defined as Spores/Sxy, where Spores is the area of pores in the cross-section (xy) plane. Spores has been calculated from the ideal cross-section area of one pore Sp = hp·dp times the number of pores in x-direction np,⊥. In samples with random distribution, np,⊥ and np,‖ correspond to the parameters that have been used to generate the random position of pores.
Results
Effect of pore distribution
Porosity of all samples has been achieved by generating cylindrical pores with a given diameter. As described in the previous section, the overall porosity Φtot depends on the total number of pores np and their diameter dp. A first comparison has been done for a total number of pores of np = 216 in membranes with the dimensions given in Fig. 1 and a pore diameter dp of 0.9 nm resulting in Φtot = 0.03. Samples with a step-like, ordered and random pore distribution have been generated as shown in Fig. 2. For all configurations, an interface porosity Φ⊥ of 0.22 and 0.33 has been considered, corresponding to np,⊥ = 12 and 18, respectively, where np,⊥ stands for the number of pores in direction orthogonal to the heat flow. In samples with random pore distribution, np,⊥ is the average number of pores in each section with thickness Δz that has been used to randomly generate the pores centers (see previous section).Results of the thermal conductivity κ, heat flux J and rectification R are shown in Table 1. A remarkable reduction of heat flux and thermal conductivity is observed when the interface porosity Φ⊥ is increased from 0.22 (np,⊥ = 12) to 0.33 (np,⊥ = 18) for step-like and ordered pore distribution. In samples with random distribution, the algorithm for random pore generation with np,⊥ = 12 and 18 resulted in statistically indistinguishable configurations. Therefore, only small differences in thermal conductivity, heat flux and rectification are observed in the two configurations represented in Table 1.
| n p,⊥ | Φ ⊥ | κ fwd [W m−1 K−1] | κ rev [W m−1 K−1] | J fwd [W nm−2] | J rev [W nm−2] | R [%] | |
|---|---|---|---|---|---|---|---|
| Step | 12 | 0.22 | 6.47 | 6.24 | 2.44 × 10⁻⁸ | 2.39 × 10⁻⁸ | 2.1 |
| 18 | 0.33 | 5.52 | 5.41 | 2.11 × 10⁻⁸ | 2.06 × 10⁻⁸ | 2.3 | |
| Ordered | 12 | 0.22 | 6.44 | 6.36 | 2.34 × 10⁻⁸ | 2.32 × 10⁻⁸ | 0.6 |
| 18 | 0.33 | 5.76 | 5.66 | 2.08 × 10⁻⁸ | 2.06 × 10⁻⁸ | 1.1 | |
| Random | ≈12 | ≈0.22 | 6.00 | 5.90 | 2.26 × 10⁻⁸ | 2.23 × 10⁻⁸ | 1.6 |
| ≈18 | ≈0.33 | 6.06 | 5.95 | 2.30 × 10⁻⁸ | 2.26 × 10⁻⁸ | 1.8 |
Thermal rectification is found to be highest for a step-like pore distribution and, more specifically, slightly higher in the sample with higher interface porosity. The sample with a step-like porosity profile can basically be described as two different materials connected in series, where one segment is composed of crystalline Si and the other of porous Si with a porosity of 2·Φtot = 0.06. In this case, the overall thermal conductivity κtot can also be calculated as  , where κ1 and κ2 is the thermal conductivity of the crystalline and the porous segment, respectively, and can be obtained from the linear temperature profile in z-direction (see Fig. S3 of ESI†). In forward and reverse bias, thermal conductivity of the crystalline Si segment resulted respectively in 12.7 W m−1 K−1 and 11.2 W m−1 K−1. In contrast, the same thermal conductivity of 4.3 W m−1 K−1 is obtained for the porous Si segment in both forward and reverse bias. This indicates, that thermal conductivity in the porous segment is less dependent on temperature than the crystalline one, which eventually leads to a notable thermal rectification.
For a non-homogeneous but ordered pore distribution a notable increase in rectification is observed in the sample with higher interface porosity Φ⊥. It increases from 0.6 to 1.1% with increasing Φ⊥ from 0.22 (np,⊥ = 12) to 0.33 (np,⊥ = 18). The higher interface porosity leads to a reduction of the thermal conductivity and in turn affects the rectification. In order to obtain the same overall porosity Φtot in the samples with ordered pore distribution, the number of pores in direction of the heat flow np,‖ had to be adjusted, thus altering the porosity profile in direction of the heat current which is supposed to have a notable effect on the rectification and is discussed more in detail in the following.
Effect of interface porosity with constant overall porosity
As shown in the previous paragraph, the interface porosity, in particular for configurations with ordered pore distribution, can notably affect the thermal conductivity and rectification in nanoporous Si membranes. This effect has been analyzed more in detail for samples with ordered and random pore distribution. While keeping the total number of pores constant (np = 216), and thus the overall porosity (Φtot = 0.03), the number of pores orthogonal to the heat current has been altered, resulting in an interface porosity Φ⊥ of 0.17, 0.22, 0.33 and 0.44.Fig. 3 shows the thermal conductivity κ, averaged between forward and reverse bias, as a function of the interface porosity. In samples with ordered pore distribution, the thermal conductivity steadily decreases with increasing interface porosity, similar to what has been shown previously for bulk porous Si.19 In contrast, the average thermal conductivity in samples with random pore distribution is not affected by the change in interface porosity. The interface porosity for random pore distribution has been defined from the parameters used to generate the random distributed pores, which takes a certain number of pores orthogonal to the heat flow that have to be distributed randomly in a segment of a certain thickness. This, however, does not represent the actual interface porosity, since pores are not aligned at the same position z, but rather gives an average value. This average value has been used to compare the results to the case of ordered pore distribution. Explaining why κ does not show any dependence on Φ⊥ in samples with random pore distribution.
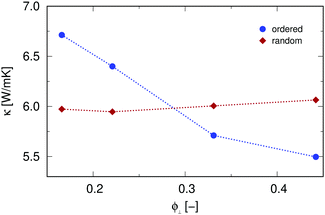 | ||
| Fig. 3 Thermal conductivity as a function of interface porosity Φ⊥ in samples with ordered (circles) and random (diamonds) pore distribution. | ||
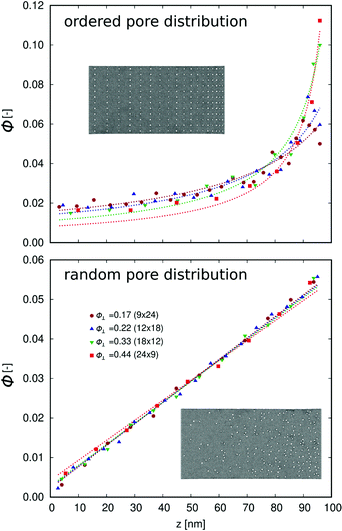
In case of an ordered pored distribution, increasing the interface porosity while keeping the overall porosity constant dictates that the number of pores in direction of the heat current is reduced, and thus results in a higher porosity gradient. The porosity profile shown in Fig. 4 has been fitted to Φ(z) = a0/(1 + a1·z).
For samples with random pore distribution, the porosity profile is linear and has been fitted to Φ(z) = b0 + b1·z. Here, only marginal changes are observed in the porosity profile Φ(z) with altering interface porosity as a result of the randomized distribution of pore centers. In fact, the fitted porosity gradient b1 is almost identical for all samples with random distribution. However, it has to be noted that the fluctuation of Φ(z) is highly depended on the segments Δz that have been used for the calculation of each data point and these fluctuation increase with increasing interface porosity.
Analysis of thermal rectification revealed a marginal increase with increasing interface porosity up to 0.33, while a remarkable increase of the rectification is observed when increased further to Φ⊥ = 0.44 (Fig. 5). This behavior is similar for both ordered and random pore distribution. For all calculated interface porosities, rectification in samples with random pore distribution was higher than in the ones with ordered pore distribution.
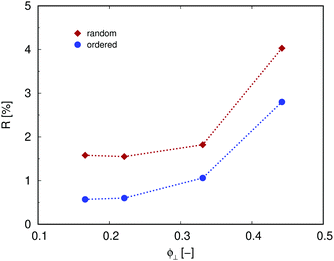 | ||
| Fig. 5 Thermal rectification as a function of interface porosity Φ⊥ for ordered (circles) and random (diamonds) pore distribution. | ||
Even though the porosity profile and thermal conductivity only showed marginal differences for various random distributions, a trend in rectification is notable when parameters for the random distribution are changed in a similar way as for samples with ordered pore distribution. This suggests that thermal rectification does not only depend on the porosity profile but also on the actual distribution of pores which is difficult to systematically capture in representative numbers. In summary, we argue that in samples with equal overall porosity Φtot, random distribution profits thermal rectification. The latter has been found to increase for both ordered and random pore distribution with increasing interface porosity Φ⊥.
Effect of interface thermal resistance
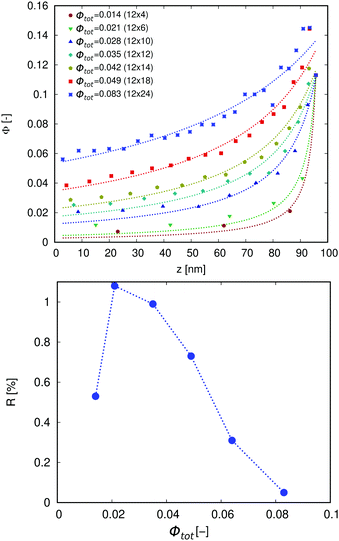
Several configurations have been investigated for an ordered pore distribution where the interface porosity Φ⊥ has been kept constant while altering the overall porosity Φtot. This basically translates to a constant number of pores orthogonal to the heat flow np,⊥ and a variation of the number of pores in direction of the heat flow np,‖. The diameter of pores has been set to 1.4 nm. Fig. 6 shows the porosity profile and the thermal rectification as a function of the overall porosity.A low overall porosity, and thus low np,‖, results in an increasing porosity gradient in direction of the heat flow (Fig. 6, top). With increasing np,‖, the change in porosity gradient decreases and the porosity profile approaches a linear behavior (see profile for Φtot = 0.083, np,‖ = 24). This increase in pore density in direction of the heat flow results in a decrease in rectification as shown in Fig. 6 (bottom).
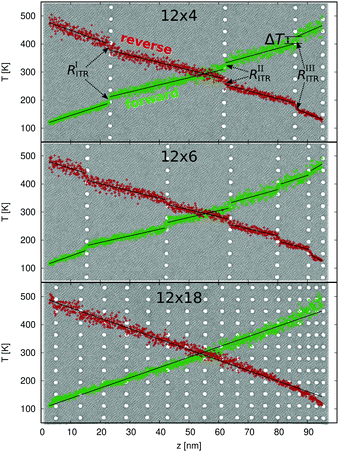
Interestingly, the rectification shows a maximum at np,‖ = 6 (Φtot = 0.021). This can be explained by the interface thermal resistance (RITR = ΔT/J) which is formed in samples where pore columns can be assumed to be isolated boundaries separating regions of crystalline Si. As can be seen in the temperature profiles in Fig. 7 for samples with np,‖ = 4, 6 and 18 (Φtot = 0.014, 0.021 and 0.064, respectively) an interface thermal resistance at the position of pores is formed for np,‖ = 4 and 6, represented by an abrupt temperature discontinuity ΔT.
In order to rationalize the scenario described above and assess the role of temperature dependent thermal conductivity and interface thermal resistance, the overall thermal conductivity κtot of some samples has been approximated using the concept of thermal resistors connected in series according to
 | (2) |
 ), while RiITR is the interface thermal resistance between segment i and i + 1. While the first sum takes care of the inseparable dependence of space and temperature of the thermal conductivity κ(z, T), which is a necessary condition for thermal rectification, the second term takes into consideration asymmetric behavior of the interface thermal resistance RITR with temperature.
In the case of np,‖ = 4 (Φtot = 0.014), four segments of crystalline Si can be identified with a linear temperature profile, while the segment number increases to six in the 12 × 6 sample (np,‖ = 6, Φtot = 0.021). Using the temperature gradient of these segments, the thermal conductivity of crystalline Si κSi is calculated giving rise to the temperature dependence of κSi. The values obtained have then been fitted to
| κSi(T) = a0 + a1·T + a2·T2 + a3·T3 + O(T4). | (3) |
In order to calculated the overall thermal conductivity in forward and reverse bias in the 12 × 6 sample, where the maximum thermal rectification has been found, the interface boundary resistance RITR of each boundary has been estimated from the temperature differences ΔT between each segment i with constant temperature gradient. Values of RITR and average temperature Ti of each segment can be found in the ESI† (Table S2).
The overall thermal conductivity has then been obtained from eqn (2), where n = np,‖ = 6. With this approach, forward and reverse thermal conductivity resulted in 7.7 and 7.3 W m−1 K−1, respectively. Relying on the thermal conductivity in forward and reverse bias, thermal rectification is usually defined as Rκ = |κfwd − κrev|/κrev. Using this definition the rectification is found to be 5.5%.
With the intention to get a more detailed understanding, which effects are dominant for thermal rectification, the overall thermal conductivity has been calculated as well neglecting the interface thermal resistance, i.e. the second term of eqn (2). In this case, the forward and reverse thermal conductivity is calculated to be 9.9 and 9.6 W m−1 K−1 which results in a rectification of 3% and indicates, that the effect of asymmetric interface boundary resistance plays a notable role in this case.
For a comparison, this approach has been additionally used to calculate the overall thermal conductivity in the 12 × 4 sample with n = np,‖ = 4 (Φtot = 0.014) and in the 12 × 18 sample with n = np,‖ = 18 (Φtot = 0.064). Values of Ti and RITR for sample 12 × 4 are reported in the ESI† (Table S1). The increased number of pores in direction of the heat flow np,‖ in the 12 × 18 leads to a situation where the interface thermal rectification vanishes resulting in a continuous temperature profile (Fig. 7, bottom). The concept of thermal resistors connected in series has been applied as well to this case, however, neglecting the second term of eqn (2), which has a finite value only for non-vanishing RITR.
Using this model, the forward and reverse thermal conductivity in the 12 × 4 sample resulted in 8.9 and 8.6 W m−1 K−1, respectively, yielding a thermal rectification of 3.4%. A similar value of the thermal rectification is obtained in the 12 × 18 sample with a thermal conductivity of 10.2 and 9.9 W m−1 K−1 in forward and reverse bias, respectively. Both values of the rectification are notably lower with respect to the result obtained for the 12 × 6 sample (5.5%) and similar to the approximation for 12 × 6 when interface boundary resistance is neglected (3%) demonstrating that RITR plays a significant role leading to the maximum in thermal rectification in this sample. It can therefore be concluded that the decrease in thermal rectification with increasing overall porosity for Φtot > 0.02 mainly depends on a decrease in interface thermal resistance.
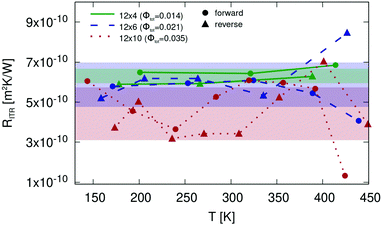
Aiming at a deeper understanding of this effect, the interface thermal resistance RITR for samples 12 × 4, 12 × 6 and 12 × 10 has been estimated and is shown in Fig. 8 as a function of temperature.
In the 12 × 4 sample, which has the lowest number of pores in direction of the heat current np,‖ (lowest overall porosity), hardly any temperature dependence of RITR is observed. The same is true for sample 12 × 6 up to a temperature of 350 K. Further increase of the temperature, however, shows increased fluctuation of RITR in both forward and reverse bias. In the sample with highest np,‖ (12 × 18), the same trend of increased fluctuation of RITR is observed at all temperatures. In addition, the average value of RITR is significantly lower with respect to the other two samples, in line with the fact that interface effects are decreasing with increasing number of pores np,‖, eventually leading to a continuous temperature profile which confirms vanishing interface thermal resistance. The two competing effects of increasing fluctuation and decreasing values of RITR can be quantified in the standard deviation ΔRITR and the arithmetic mean ![[R with combining macron]](https://www.rsc.org/images/entities/i_char_0052_0304.gif) ITR. Values of these parameters for the three samples are shown in Table 2.
ITR. Values of these parameters for the three samples are shown in Table 2.
![[R with combining macron]](https://www.rsc.org/images/entities/i_char_0052_0304.gif) ITR and its standard deviation ΔRITR for samples 12 × 4 (Φtot = 0.014), 12 × 6 (Φtot = 0.021) and 12 × 10 (Φtot = 0.035)
ITR and its standard deviation ΔRITR for samples 12 × 4 (Φtot = 0.014), 12 × 6 (Φtot = 0.021) and 12 × 10 (Φtot = 0.035)
| Sample | n p,‖ | Φ tot |
![[R with combining macron]](https://www.rsc.org/images/entities/i_char_0052_0304.gif) ITR [m2 K W−1]
ITR [m2 K W−1] |
ΔRITR [m2 K W−1] |
|---|---|---|---|---|
| 12 × 4 | 4 | 0.014 | 6.3 × 10⁻¹⁰ | 3.6 × 10⁻¹¹ |
| 12 × 6 | 6 | 0.021 | 5.9 × 10⁻¹⁰ | 1.1 × 10⁻¹⁰ |
| 12 × 10 | 10 | 0.035 | 4.3 × 10⁻¹⁰ | 1.3 × 10⁻¹⁰ |
Based on these results we conclude that the average interface thermal resistance ![[R with combining macron]](https://www.rsc.org/images/entities/i_char_0052_0304.gif) ITR decreases with increasing np,‖ (increasing porosity), while fluctuation ΔRITR of temperature dependent interface thermal resistance increases. The first effect causes a reduction of the thermal rectification which eventually vanishes as confirmed by the continuous temperature profile of the 12 × 18 sample in Fig. 7 (bottom). On the other hand, increase of the fluctuation ΔRITR results in larger differences between forward and reverse bias and therefore an increase in thermal rectification.
ITR decreases with increasing np,‖ (increasing porosity), while fluctuation ΔRITR of temperature dependent interface thermal resistance increases. The first effect causes a reduction of the thermal rectification which eventually vanishes as confirmed by the continuous temperature profile of the 12 × 18 sample in Fig. 7 (bottom). On the other hand, increase of the fluctuation ΔRITR results in larger differences between forward and reverse bias and therefore an increase in thermal rectification.
This could ultimately explain the maximum in thermal rectification shown in Fig. 6 for sample 12 × 6. The two mechanisms described above have competing effects on the interface thermal resistance, producing a maximum for the sample with np,‖ = 6 (12 × 6, Φtot = 0.021), thus resulting in a maximum thermal rectification.
It should be noted that the values for thermal rectification R shown in Fig. 6 have been calculated from the heat flux  while in the model described above it has been obtained from the thermal conductivity
  where the overall thermal conductivity has been modeled by resistors connected in series considering a step-wise constant thermal conductivity in connection with interface boundary resistance RITR while neglecting other scattering events that are captured, for example, in a continuously changing thermal conductivity κ(z, T). Furthermore, this model relies on approximations for RITR, ΔT/Δz and κSi(T), thus introducing additional sources of error. Both factors contribute to the discrepancy between values shown in Fig. 6 and the once obtained from the model. Nevertheless, the model values are in qualitative agreement with the ones obtained directly from the heat flux and give valuable insight into the mechanisms controlling thermal rectification. Both methods agree qualitatively to previously conducted experiments where a rectification of similar systems of 14% has been found.23
Conclusion
The thermal conductivity and thermal rectification at 300 K has been analyzed for various configurations of porous Si membranes. Comparison of step-like, ordered and random pore distribution revealed the lowest thermal conductivity and highest rectification for a step-like pore distribution. Variation of the interface porosity reduced the thermal conductivity but only marginally increased thermal rectification. In samples with ordered pore distribution, on the other hand, a notable increase in thermal rectification with increasing interface porosity has been observed. In samples with random pore distribution, interface porosity can only be approximated and has not shown a significant change in thermal conductivity when increased from Φ⊥ = 0.22 to 0.33.The effect of interface porosity has further been studied for ordered and random pore distribution in samples with constant overall porosity Φtot = 0.03. For both types of pore distribution, increase in interface porosity resulted in an increase of rectification, in particular for Φ⊥ > 0.33. Thermal rectification was systematically higher in samples with random pore distribution.
In addition, the overall porosity has been varied in samples with ordered pore distribution, keeping constant the interface porosity. With increasing porosity the change in porosity gradient decreases, eventually leading to a linear porosity profile in direction of heat flux. This further results in a decrease of thermal rectification. Interestingly, rectification also decreases for very low porosities, leading to a maximum at an overall porosity Φtot of 0.02. This can be explained by the effect of interface thermal resistance on thermal rectification which is controlled by two competing factors. On the one hand this is the average value of the interface resistance which depends on the number of pores in direction of the heat flow and on the other hand its fluctuation with temperature. The average interface thermal resistance decreases with increasing number of pores (increasing porosity), while the fluctuation of the resistance decreases, resulting in a maximum in thermal rectification of 5.5% found at Φtot = 0.02.
Conflicts of interest
There are no conflicts to declare.Acknowledgements
This work is financed by Ministero dell'Università e Ricerca (MIUR) under the Piano Operativo Nationale 2014-2020 asse I, action I.2 “Mobilità dei Ricercatori” (PON 2014-2020, AIM), through project AIM1809115-1.References
- M. C. Browne, B. Norton and S. J. McCormack, Renewable Sustainable Energy Rev., 2015, 47, 762–782 CrossRef CAS.
- M. Y. Wong, C. Y. Tso, T. C. Ho and H. H. Lee, Int. J. Heat Mass Transfer, 2021, 164, 120607 CrossRef.
- D. G. Cahill, W. K. Ford, K. E. Goodson, G. D. Mahan, A. Majumdar, H. J. Maris, R. Merlin and S. R. Phillpot, J. Appl. Phys., 2003, 93, 793–818 CrossRef CAS.
- M. S. Dresselhaus, G. Chen, M. Y. Tang, R. G. Yang, H. Lee, D. Z. Wang, Z. F. Ren, J. P. Fleurial and P. Gogna, Adv. Mater., 2007, 19, 1043–1053 CrossRef CAS.
- G. J. Snyder and E. S. Toberer, Nat. Mater., 2008, 7, 105–114 CrossRef CAS PubMed.
- K. R. Hahn, C. Melis, F. Bernardini and L. Colombo, Phys. Rev. Mater., 2021, 5, 065403 CrossRef CAS.
- M. C. Steele and F. D. Rosi, J. Appl. Phys., 1958, 29, 1517–1520 CrossRef CAS.
- B. Abeles, Phys. Rev., 1963, 131, 1906–1911 CrossRef.
- J. Garg, N. Bonini, B. Kozinsky and N. Marzari, Phys. Rev. Lett., 2011, 106, 045901 CrossRef PubMed.
- C. Melis and L. Colombo, Phys. Rev. Lett., 2014, 112, 065901 CrossRef.
- K. R. Hahn, C. Melis, F. Bernardini and L. Colombo, Front. Mech. Eng., 2021, 7, 66 Search PubMed.
- D. Narducci, L. Zulian, B. Lorenzi, F. Giulio and E. Villa, Appl. Phys. Lett., 2021, 119, 263903 CrossRef CAS.
- A. J. Minnich, H. Lee, X. W. Wang, G. Joshi, M. S. Dresselhaus, Z. F. Ren, G. Chen and D. Vashaee, Phys. Rev. B: Condens. Matter Mater. Phys., 2009, 80, 155327 CrossRef.
- Y. He, D. Donadio and G. Galli, Appl. Phys. Lett., 2011, 98, 144101 CrossRef.
- I. Savic, D. Donadio, F. Gygi and G. Galli, Appl. Phys. Lett., 2013, 102, 073113 CrossRef.
- L. Ferre Llin, A. Samarelli, S. Cecchi, T. Etzelstorfer, E. Muller Gubler, D. Chrastina, G. Isella, J. Stangl, J. M.-R. Weaver, P. S. Dobson and D. J. Paul, Appl. Phys. Lett., 2013, 103, 143507 CrossRef.
- J. H. Lee, J. C. Grossman, J. Reed and G. Galli, Appl. Phys. Lett., 2007, 91, 223110 CrossRef.
- Y. P. He, D. Donadio, J. H. Lee, J. C. Grossman and G. Galli, ACS Nano, 2011, 5, 1839–1844 CrossRef CAS PubMed.
- R. Dettori, C. Melis, X. Cartoixà, R. Rurali and L. Colombo, Phys. Rev. B: Condens. Matter Mater. Phys., 2015, 91, 054305 CrossRef.
- R. Dettori, C. Melis, R. Rurali and L. Colombo, J. Appl. Phys., 2016, 119, 215102 CrossRef.
- D. Song and G. Chen, Appl. Phys. Lett., 2004, 84, 687 CrossRef CAS.
- M. Sledzinska, B. Graczykowski, F. Alzina, U. Melia, K. Termentzidis, D. Lacroix and C. M. Sotomayor Torres, Nanotechnology, 2019, 30, 265401 CrossRef CAS PubMed.
- M. Kasprzak, M. Sledzinska, K. Zaleski, I. Iatsunskyi, F. Alzina, S. Volz, C. M. Sotomayor Torres and B. Graczykowski, Nano Energy, 2020, 78, 105261 CrossRef CAS.
- R. A. Duncan, G. Romano, M. Sledzinska, A. A. Maznev, J.-P. M. Péraud, O. Hellman, C. M.-S. Torres and K. A. Nelson, J. Appl. Phys., 2020, 128, 235106 CrossRef CAS.
- C. Melis, G. Barbarino and L. Colombo, Phys. Rev. B: Condens. Matter Mater. Phys., 2015, 92, 245408 CrossRef.
- B. Li, L. Wang and G. Casati, Phys. Rev. Lett., 2004, 93, 184301 CrossRef PubMed.
- B. Li, L. Wang and G. Casati, Appl. Phys. Lett., 2006, 88, 143501 CrossRef.
- L. Wang and B. Li, Phys. Rev. Lett., 2007, 99, 177208 CrossRef PubMed.
- R. Rurali, X. Cartoixà and L. Colombo, Phys. Rev. B: Condens. Matter Mater. Phys., 2014, 90, 041408(R) CrossRef.
- S. Plimpton, J. Comput. Phys., 1995, 117, 1–19 CrossRef CAS.
- S. Plimpton, A. Thompson and P. Crozier, LAMMPS Molecular Dynamics Simulator, https://lammps.sandia.gov.
- F. H. Stillinger and T. A. Weber, Phys. Rev. B: Condens. Matter Mater. Phys., 1985, 31, 5262 CrossRef CAS PubMed.
- P. K. Schelling, S. R. Phillpot and P. Keblinski, Phys. Rev. B: Condens. Matter Mater. Phys., 2002, 65, 144306 CrossRef.
- D. P. Sellan, E. S. Landry, J. E. Turney, A. J.-H. McGaughey and C. H. Amon, Phys. Rev. B: Condens. Matter Mater. Phys., 2010, 81, 214305 CrossRef.
- X. Zhang, H. Xie, M. Hu, H. Bao, S. Yue, G. Qin and G. Su, Phys. Rev. B: Condens. Matter Mater. Phys., 2014, 89, 054310 CrossRef.
- X. Cartoixà, L. Colombo and R. Rurali, Nano Lett., 2015, 15, 8255–8259 CrossRef PubMed.
Footnote |
| † Electronic supplementary information (ESI) available. See DOI: https://doi.org/10.1039/d2cp00775d |
| This journal is © the Owner Societies 2022 |

